
Abstract
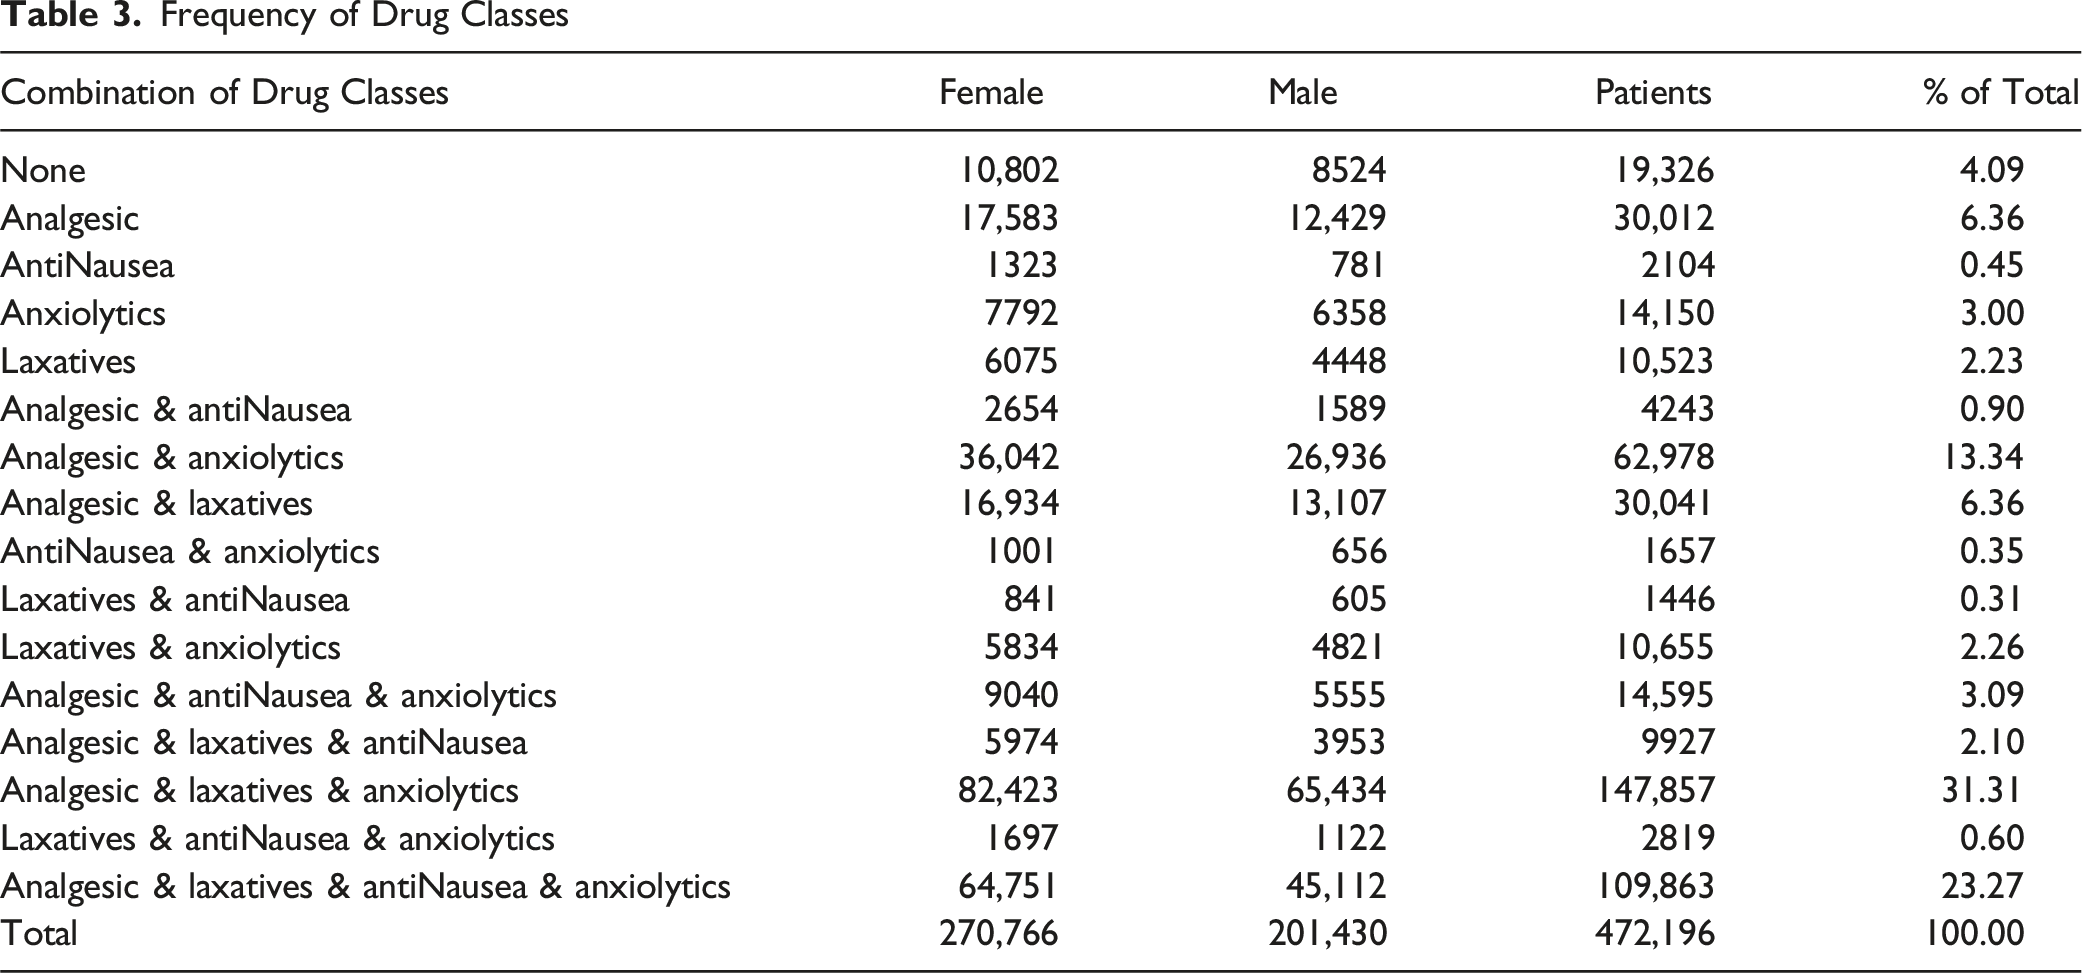
Hospice provides comfort care to patients at end of life. Survival of patients in hospice shows considerable variation. Using a large national database of hospice patient data from 2015-6 we perform a descriptive analysis and examine this variation, and associated factors. In our secondary analysis of 472,196 patients enrolled into hospice, we found a median duration of survival of less than 4 weeks, although approximately ten percent of patients survive longer than 6 months, the duration that CMS sets as the maximum survival prognosis for admission to hospice. Among the 4 drug classes (analgesic, anxiolytic, anti-nausea and laxatives) recognized by CMS as appropriate for hospice patients only 4% of patients had no prescriptions in these classes. Analgesic use rose steadily across the hospice episode, particularly near death. The variation in survival among patients and the frequency of survival in excess of 6 months points to the need for more accurate predictive models and an opportunity to employ statistical analysis for hospice admission.
Introduction
Hospice in the United States delivers comfort-focused, goal-concordant care to individuals with a physician-certified prognosis of 6 months or less under the Medicare Hospice Benefit. 1 Utilization has expanded over the past 2 decades, yet late referral remains common and lengths of stay are often short: national reports show a median hospice stay of only a few weeks, with substantial heterogeneity across settings and diagnoses.2-4 In a recent single-system study, Crowley et al reported a median survival of approximately 17 days after enrollment, highlighting how little time many patients spend in hospice before death. 5 Because end-of-life care accounts for a sizable share of Medicare expenditures, these patterns make prognosis and timely referral central policy and clinical issues.6-8
Medication management is a core component of hospice practice. CMS guidance emphasizes 4 key palliative drug classes—analgesics, anti-emetics, laxatives/anticholinergics, and anxiolytics—as essential for symptom control,9,10 and observational work confirms that these agents dominate hospice prescribing. 11
Building on this framework, this study uses a large cohort data from a large national hospice pharmacy benefit manager (PBM) Enclara Pharmacia Inc., linking survival outcomes to longitudinal prescribing across the 4 core drug classes. To summarize clinical complexity and comorbidity, diagnoses are mapped to the CMS Hierarchical Condition Categories (HCC) model, which aggregates ICD codes into ten mutually-exclusive risk-relevant groups 12 to enable comparable survival analyses. We aim to (1) characterize U.S. national hospice length-of-stay patterns across admission settings and patient subgroups; (2) quantify time-varying use of the 4 major palliative drug classes near death, with a focus on analgesics; and (3) examine how medication use relates to survival patterns that may serve as markers of hospice quality and referral timing.
Prior Studies
The growth of hospice and palliative care in the United States has been well documented, with rising enrollment, increasing non-cancer representation, and shifting patterns of site of death and care transitions.2-4,13,14 Classic work by Christakis and Escarce showed that Medicare hospice patients have relatively short post-enrollment survival and that age and sex are associated with differences in length of stay. 15 More recent analyses, including Crowley’s nine-category HQC framework, reports of the Medicare Payment Advisory Commission 25 and national studies of specialist palliative care in the UK, have reinforced substantial variation in survival by diagnosis and setting, with particularly long trajectories in dementia and shorter ones in acute or renal conditions.5,16 However, these studies are typically confined to single systems or countries and use differing disease groupings, limiting comparability.
End-of-life care also imposes considerable financial burden on Medicare, with a sizable fraction of spending concentrated in beneficiaries’ last year of life.6-8 Hospice enrollment has been shown to reduce costs and improve care quality across a range of lengths of stay, 17 strengthening the case for timely referral. Yet accurately identifying which patients are likely to benefit from earlier enrollment remains challenging. Prognostic studies and validation of tools such as performance scales and disease-specific models show only modest accuracy, and multiple investigations have found that physicians and nurses tend to overestimate survival, particularly for patients with non-cancer diagnoses or frailty.18-21 Parallel work has examined survival prediction in specific disease cohorts (for example, advanced cancer or organ failure), often finding associations with sex, age, and quality-of-life measures, but these models are rarely integrated into routine hospice decision-making.22,23
Medication use at the end of life has been described primarily in terms of static prevalence of drug classes. Sera, McPherson, and Holmes 11 reported that opioids, anxiolytics, anticholinergics, antiemetics, and laxatives are among the most commonly prescribed medications in hospice populations, and CMS guidance delineates expected coverage of 4 palliative drug classes.9,10 However, few studies link standardized diagnostic groupings to detailed, longitudinal pharmacy data to examine how trajectories of palliative medication use—particularly analgesic intensity—relate to survival in large, heterogeneous hospice cohorts. At the same time, prognostic accuracy remains limited: in a multicenter hospice study, survival was underestimated in 20% and 12% of cases and overestimated in 34% and 48% of cases by physicians and nurses, respectively, 19 underscoring the need for robust, data-driven predictive models.
Taken together, the existing literature documents short and highly variable hospice survival, growing non-cancer representation, substantial Medicare costs, and limited accuracy of clinician prognosis, but leaves several gaps. Prior studies are often single-system, employ heterogeneous disease categorizations, seldom combine national-scale survival analysis with high-resolution medication trajectories using a unified framework such as CMS-HCCs, and rarely consider prescribed drug trajectories and hospice survival simultaneously. This study addresses these gaps by applying a reproducible HCC-to-10-category mapping in a large national cohort, integrating diagnosis-specific survival, 6-month outcomes, and dynamic analgesic use, and thereby laying the groundwork for multivariable Cox models that incorporate time-varying medication covariates to improve prognosis and guide more timely hospice referral.
Data
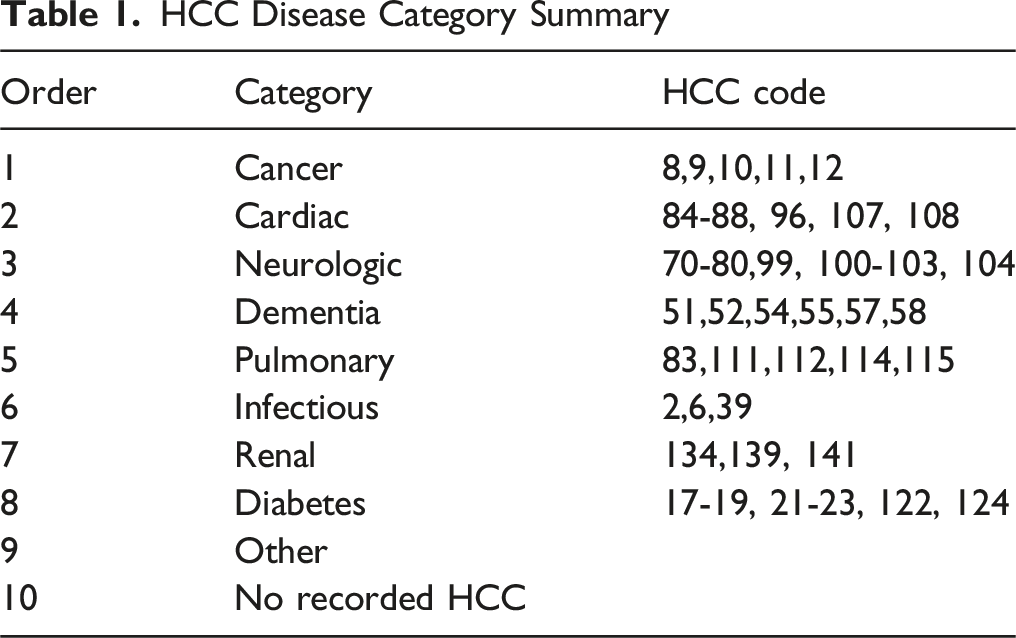
HCC Disease Category Summary
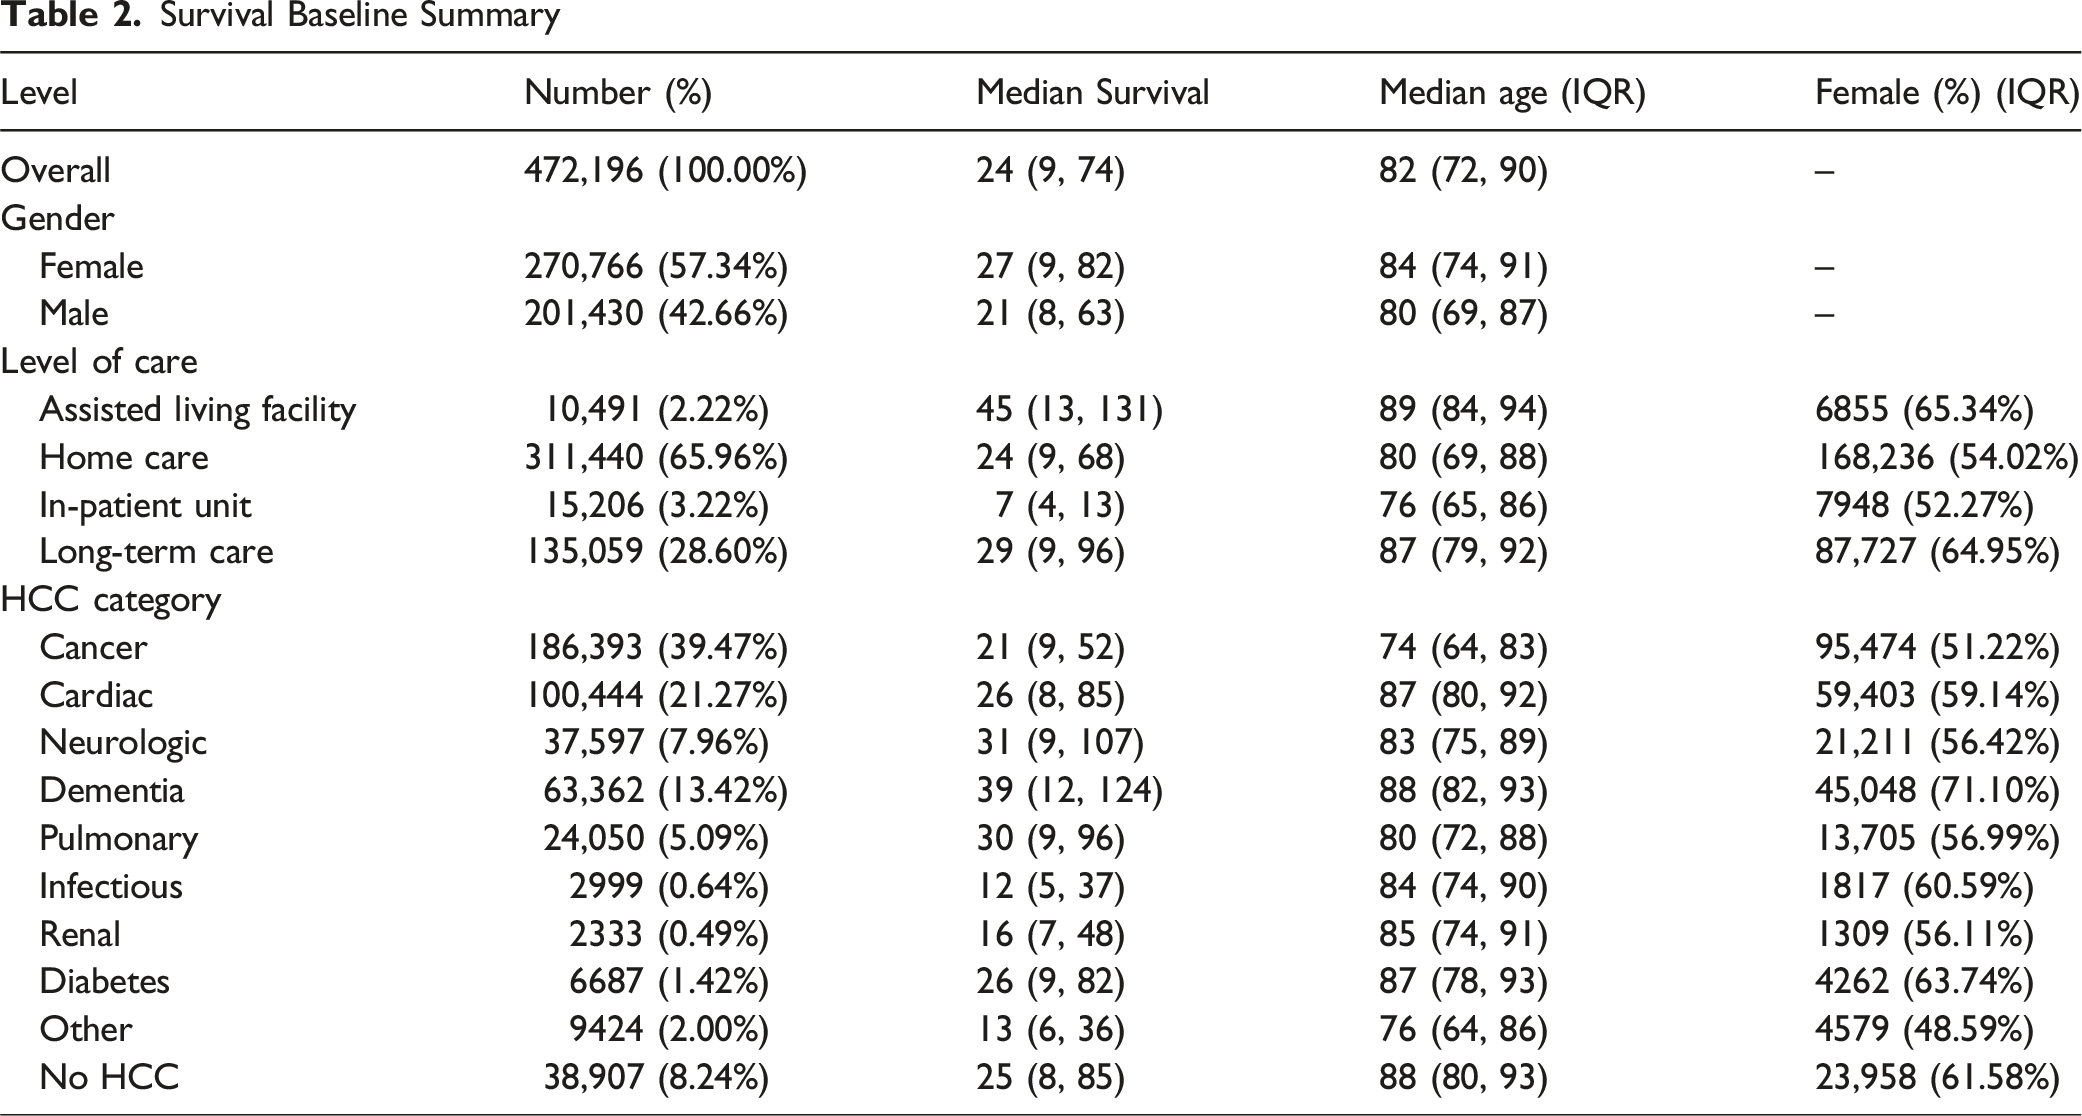
Survival Baseline Summary
Methods
We conducted a retrospective cohort analysis of the dataset described above to characterize survival patterns and end-of-life medication use in hospice. Building on the HCC mapping framework discussed in Section 3, we then consolidated HCCs into 10 mutually exclusive disease classes to facilitate comparisons across clinically coherent groups. When patients triggered multiple courses, a prespecified priority hierarchy assigned a single primary class. The detailed disease categories are shown in Table 1.
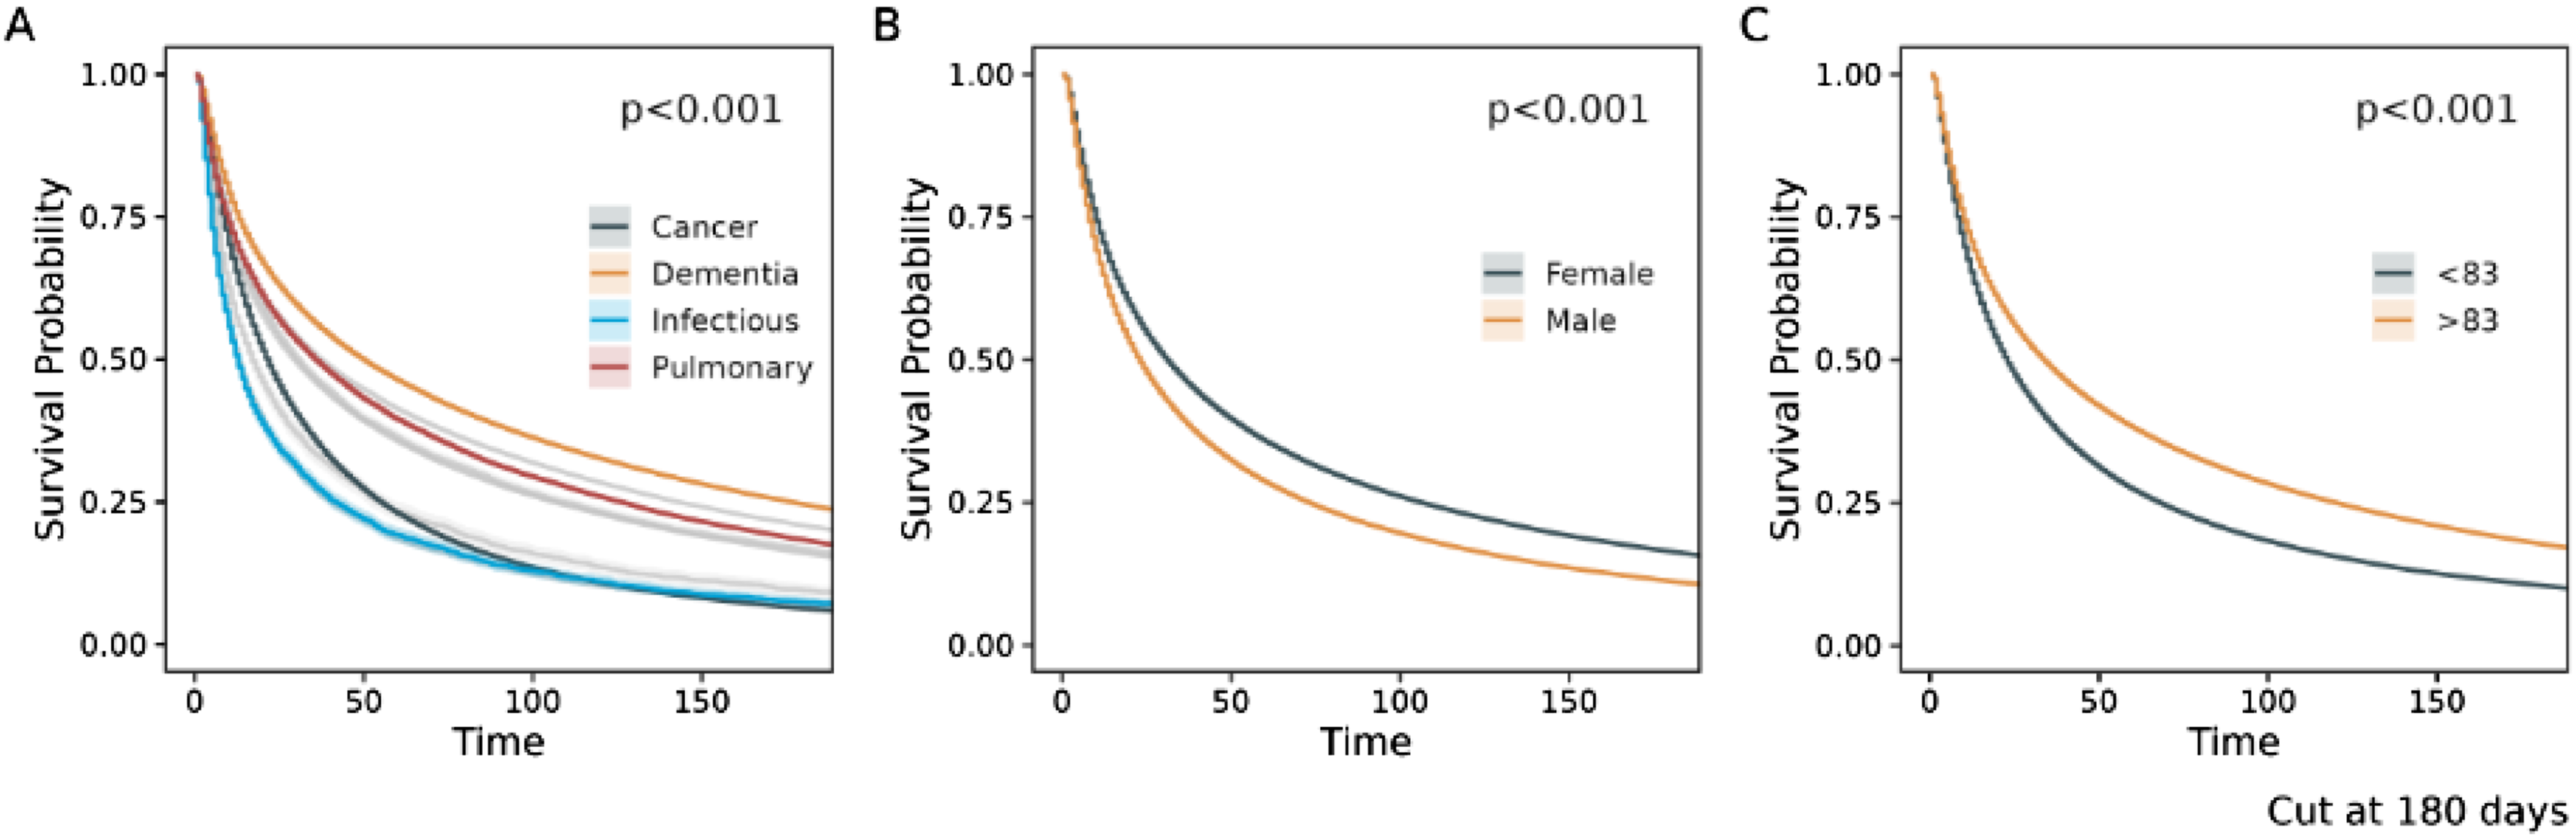
The primary outcome was duration in hospice, defined as the number of days from hospice enrollment to the recorded date of death. Patients without a death date and those discharged alive were excluded from median survival calculations. For patients with a death date, we summarized longitudinal medication exposure during hospice, computing daily average and median analgesic doses overall and by primary HCC class. Survival functions were estimated using Kaplan–Meier methods and displayed for (1) HCC classes, (2) sex, and (3) age groups (>83 and ≤83). Group differences in survival were evaluated using the log-rank test; continuous variables are summarized as medians with interquartile ranges. Because KM curves consider only 1 grouping variable at a time and cannot adjust for confounding, future work will employ multivariable Cox proportional-hazards models to quantify independent effects of diagnosis, demographics, and time-varying medication use on mortality risk.
Six-month survival was defined as being alive 180 days after enrollment. We estimated unadjusted odds ratios (ORs) for 6-month survival comparing each disease class with cancer (reference), males with females (reference), and age >83 years with ≤83 years (reference) (Age 83 is the median age of patients in the dataset). We then fitted logistic regression models with 6-month survival as the dependent variable and indicators for primary HCC class, sex, and age group to obtain adjusted odds ratios (aORs). Results are reported with 95% confidence intervals and two-sided P-values, with statistical significance assessed at α = 0.05. All data management and analyses were performed in R.
Results
Baseline Summary
Overall, median survival from enrollment was 24 days (IQR 9-74); a detailed survival distribution is shown in Figure 1. The median survival duration, which depends crucially on the mix of patients, diagnoses, and settings is longer than that reported in the 2025 MedPAC Report to Congress (18 days). Women had longer survival than men (27 [9-82] vs 21 [8-63] days) and were older at enrollment (84 [74-91] vs 80 [69-87] years). Survival varied markedly by level of care: the shortest median survival occurred in the inpatient unit (IPU, 74-13 days). Assisted living facilities had the longest median (45 [13-131])—patterns consistent with clinical acuity at admission. Median survival differed across categories: dementia (39 [12-124]), neurologic (31 [9-107]), and pulmonary (30 [9-96]) were longest; cancer was shorter (21 [9-52]), and infectious diseases (12 [5-37]) and renal (16 [7-48]) were shortest. Dementia and cardiac groups skewed older (median ages 88 and 87), and female representation was highest in dementia (71%) and long-term care (65%), mirroring observed survival advantages in those strata (Table 2). Kaplan-Meier curves are presented in Figure 2 and log-rank tests were significant for the difference in survival for age, gender, and HCC Categories (p ≤ .001). Distribution of length of stay in hospice Kaplan-Meier Survival Curves. (A): KM survival curve by primary disease categories (four categories are highlighted); (B): KM survival curve by gender; (C): KM survival curve by age group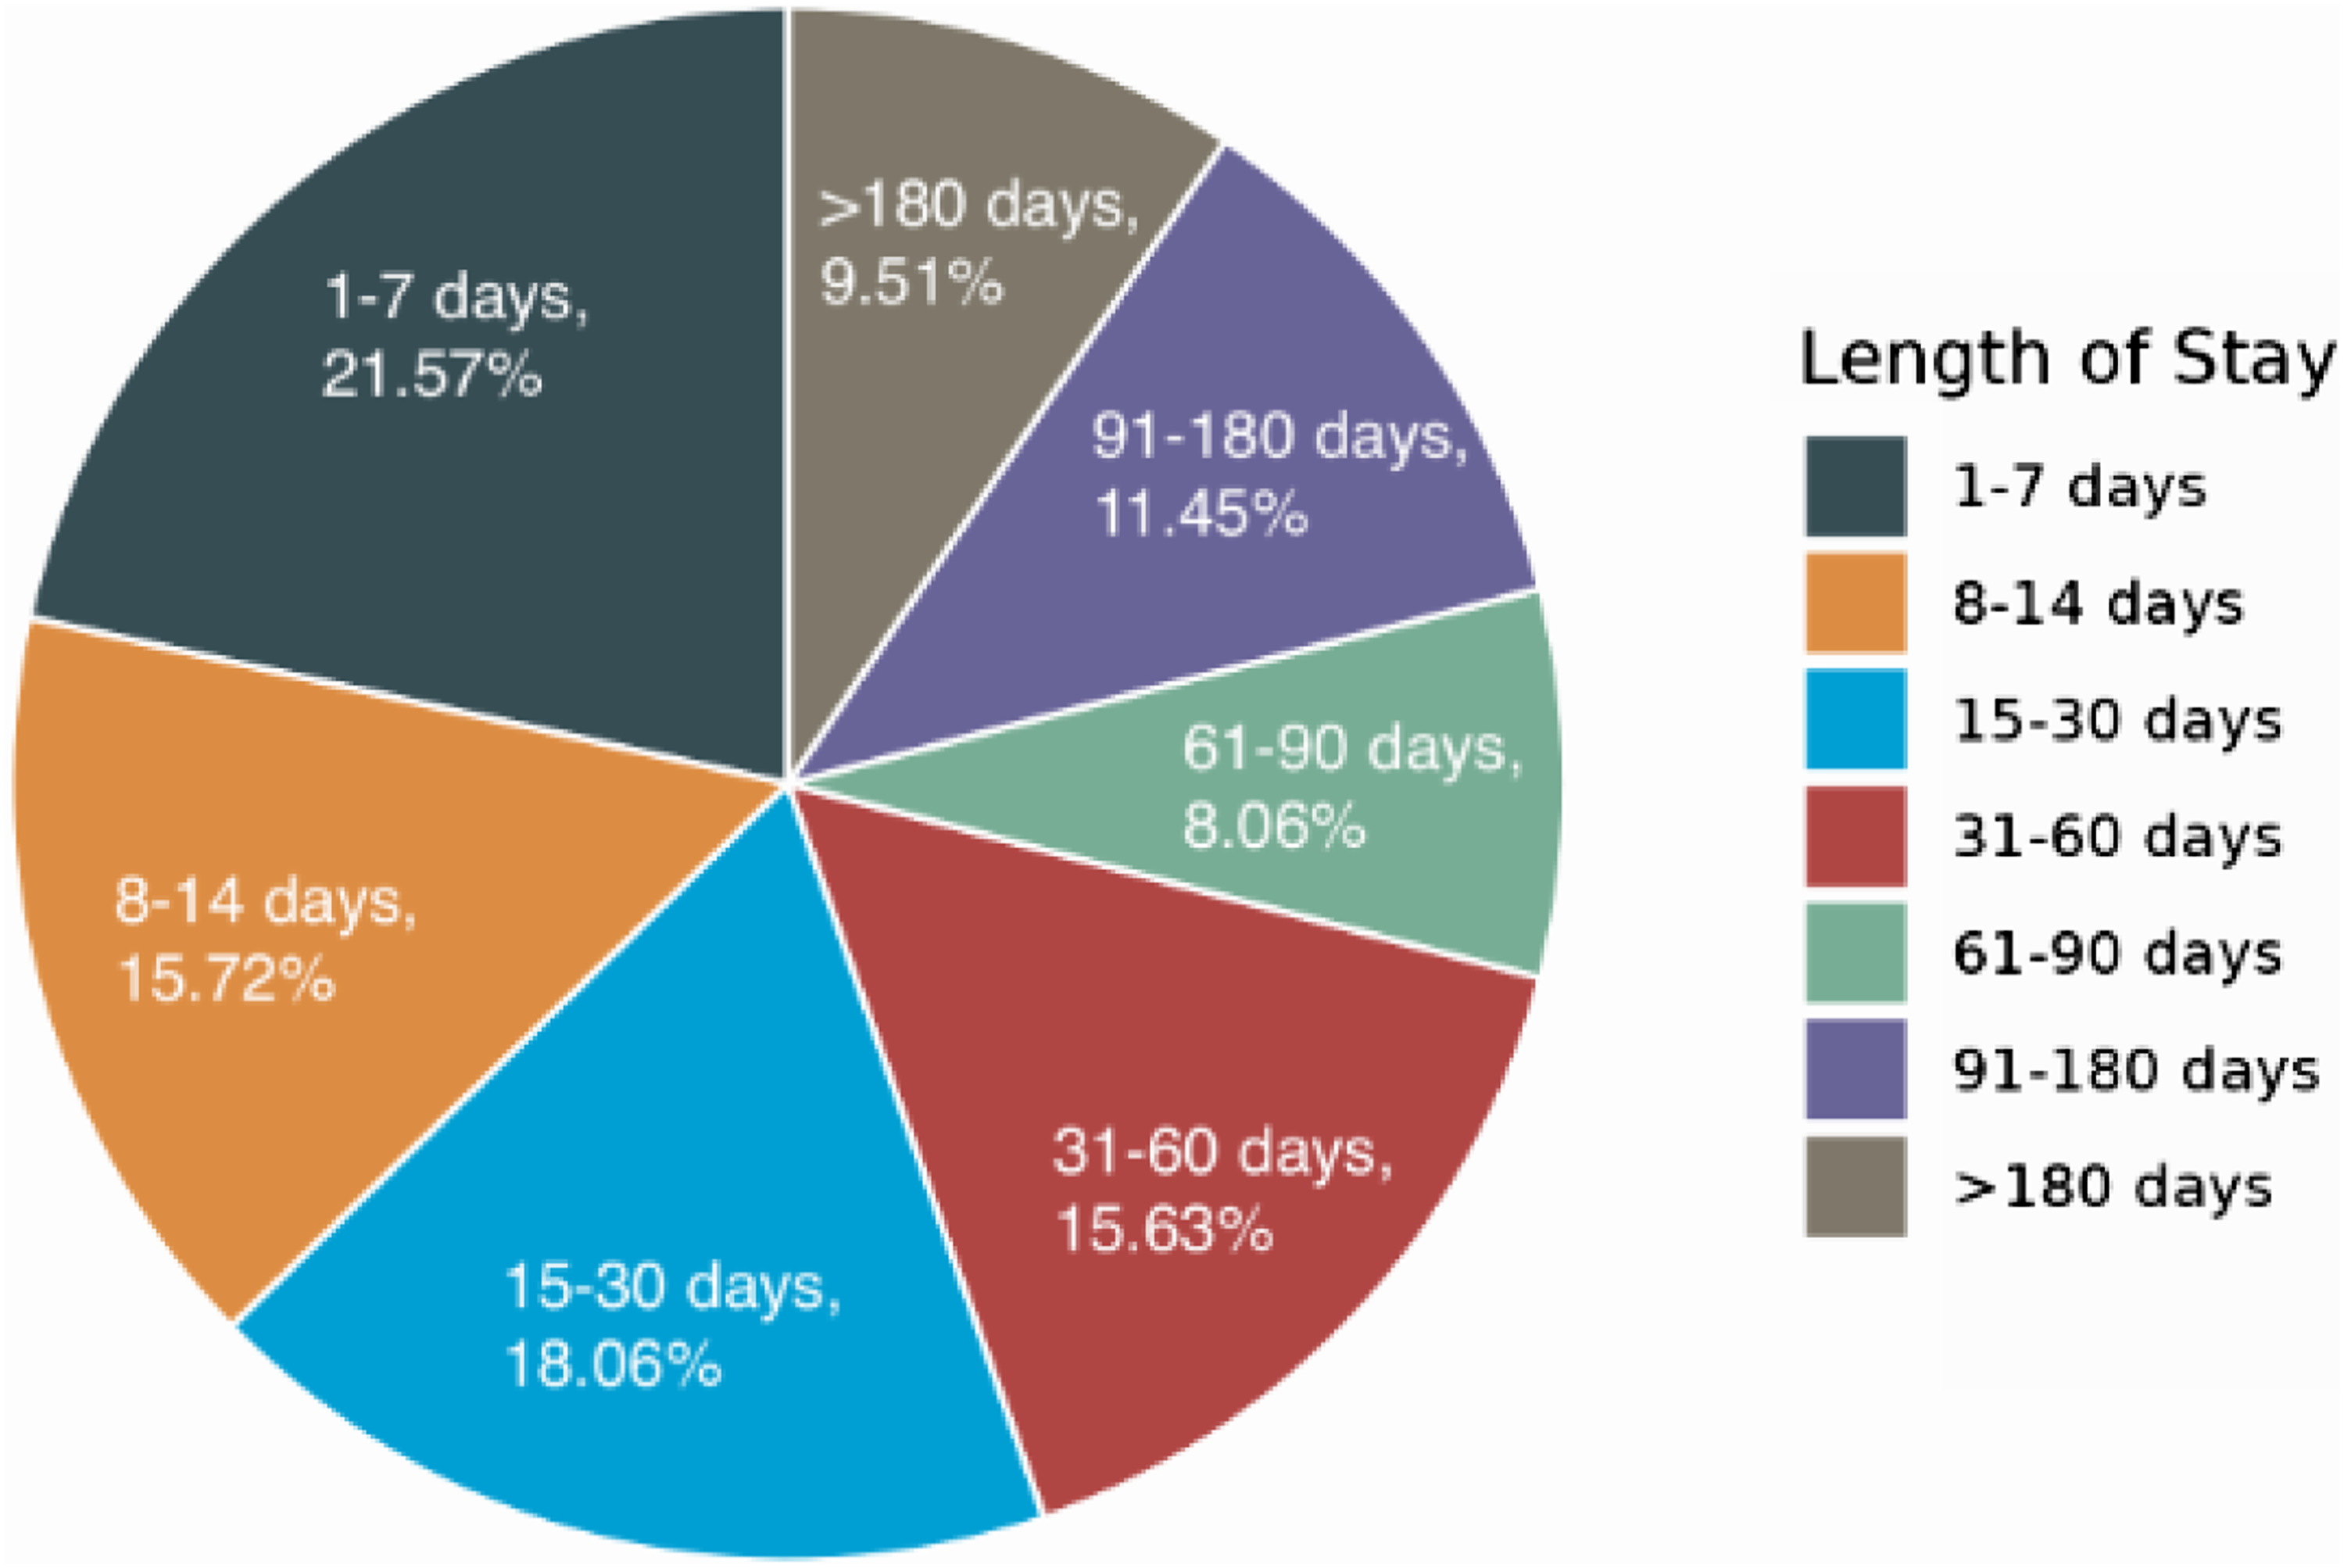
Six-Month Survival Outcomes
Overall, 9.5% of enrollees were alive at 180 days. Women were more likely than men to survive ≥6 months (15.8% vs 10.8%; aOR for men vs women 0.75 [0.74-0.77]). Older patients had higher 6-month survival (17.2% for >83 vs 10.2% for ≤83; aOR 1.25 [1.22-1.27]). Using cancer as the reference (6.2%), the highest long-survival rates were in dementia (23.7%; aOR 4.08 [3.97-4.19]) and neurologic disease (20.2%; aOR 3.61 [3.50-3.72]), followed by people without any HCC (19.8%; aOR 3.34 [3.24-3.44]) and pulmonary (17.6%; aOR 3.11 [2.99-3.22]). Cardiac (15.5%; aOR 2.50 [2.43-2.56]) and diabetes (16.0%; aOR 2.57 [2.41-2.75]) were intermediate. A notable finding is that infectious remained low (7.3%) and was not significantly different from cancer after adjustment (aOR 1.09 [0.95-1.25]). (Figure 3) Survival longer than 6 Months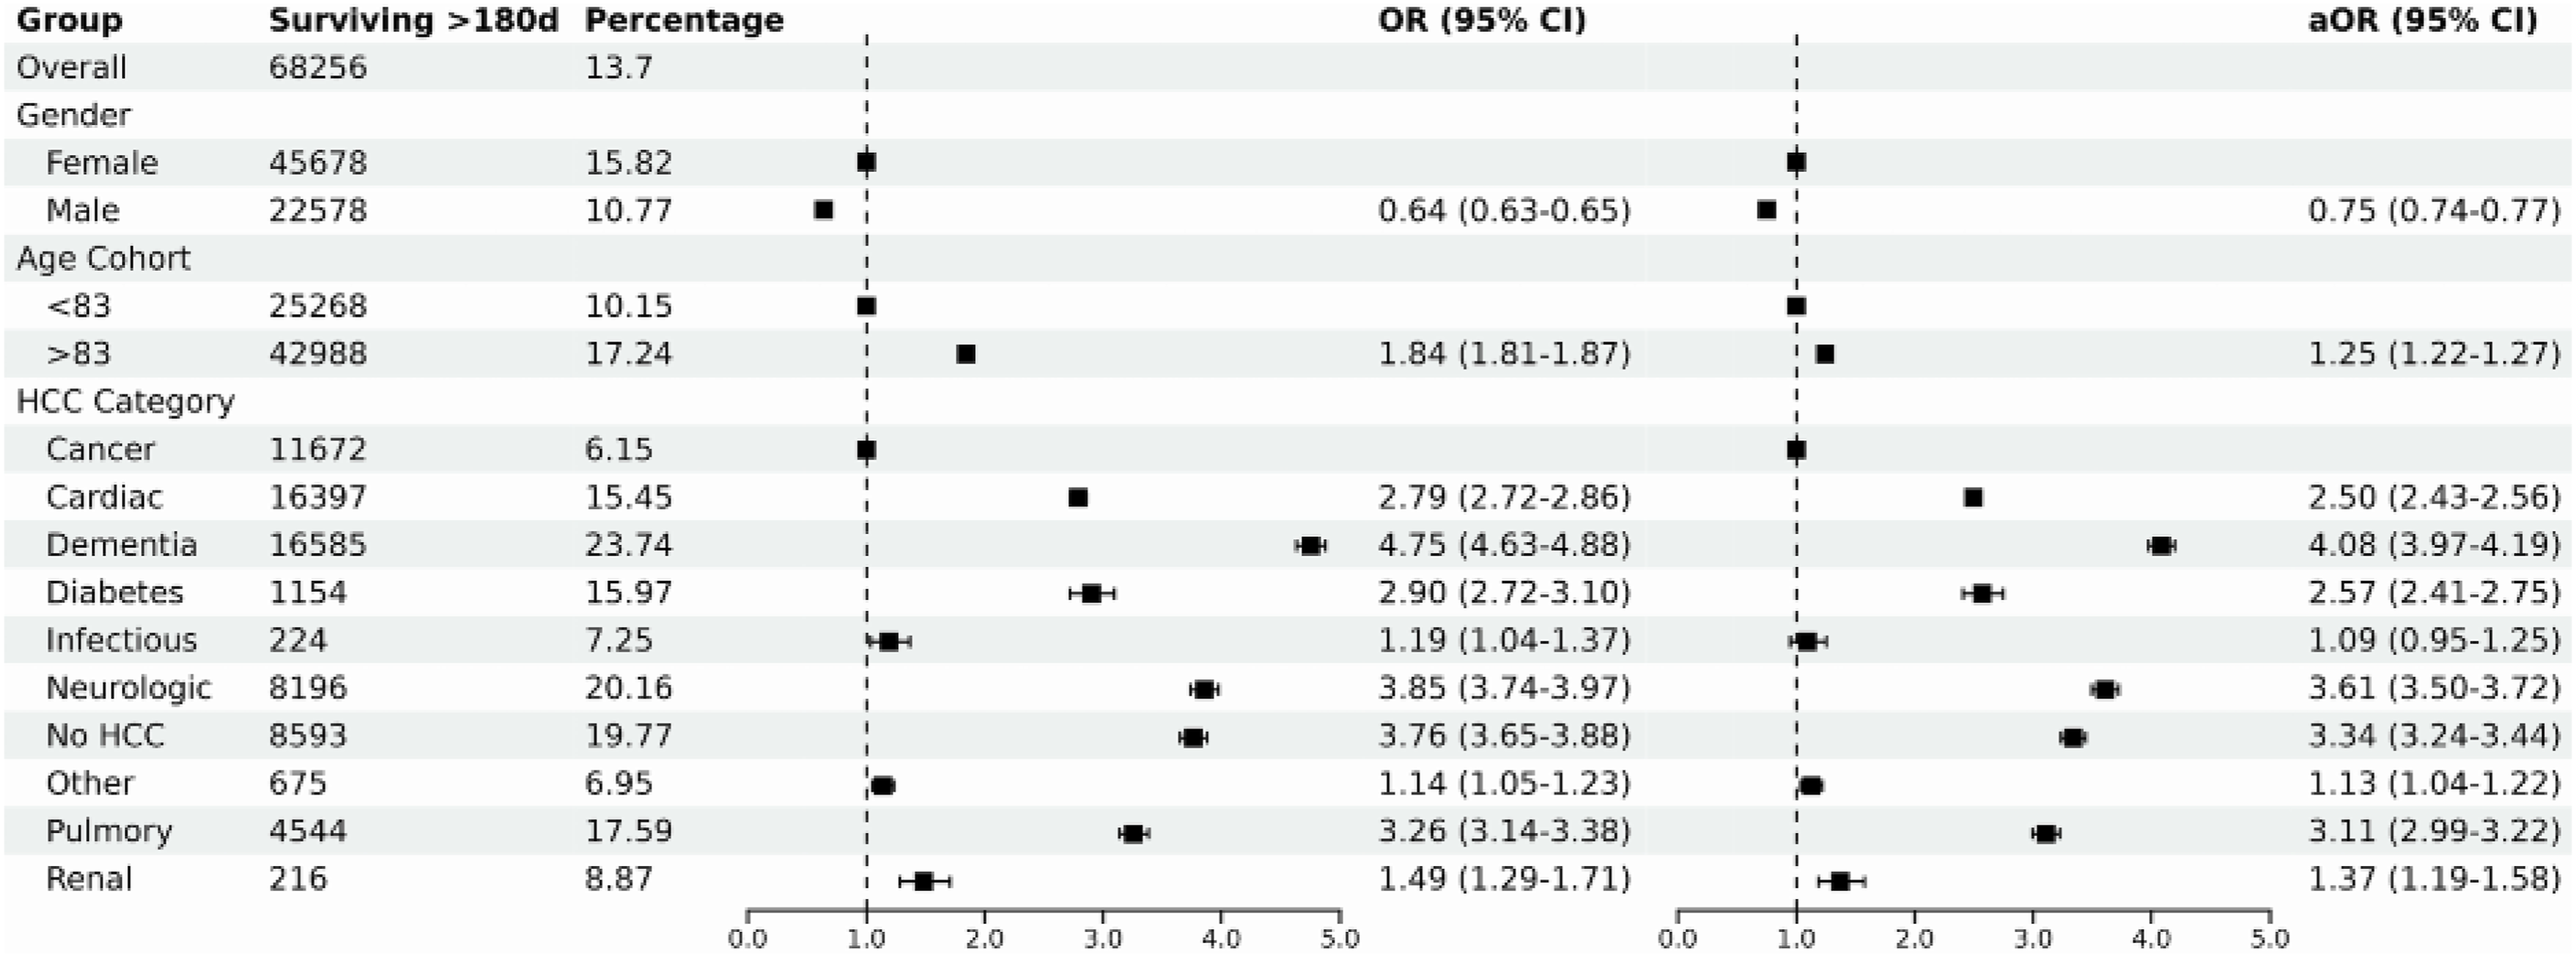
Prescribed Drugs at End of Life
Frequency of Drug Classes
Analgesic use rose steadily across the hospice episode and surged near death. Averaged across the cohort, daily analgesic dose increased gradually through the prior year and then accelerated after D–30 (the period 30 days prior to death), with the mean nearly quadrupling by the final 3-day window; medians were consistently lower than means but showed the same late inflection, indicating a right-skew driven by a growing high-dose tail (Figure 4(A)). Stratifying by diagnosis, cancer patients had the highest median dose at every window and the steepest end-of-life escalation; infectious and pulmonary groups followed with intermediate-to-high late dosing; dementia remained lowest throughout, with only a modest rise in the final week (Figure 4(B)). All categories showed a clear uptick from D–7 to D and a pronounced jump in the last 3 days, consistent with intensifying symptom burden at the end of life. We focus on analgesics here because pain medications are the most consistently prescribed and standardized (via dose conversions) across hospices, providing a cleaner, comparable signal of symptom intensity and proximity to death than the more intermittent patterns typical of anti-nauseants, anti-cholinergics/laxatives, and anxiolytics. Prescribed Drug Dosage at EOL. (A): Cumulative Daily Analgesic Dose at End of Life; (B): Daily Analgesic Dose at End of Life by HCC Categories (three highest and the lowest condition categories are highlighted)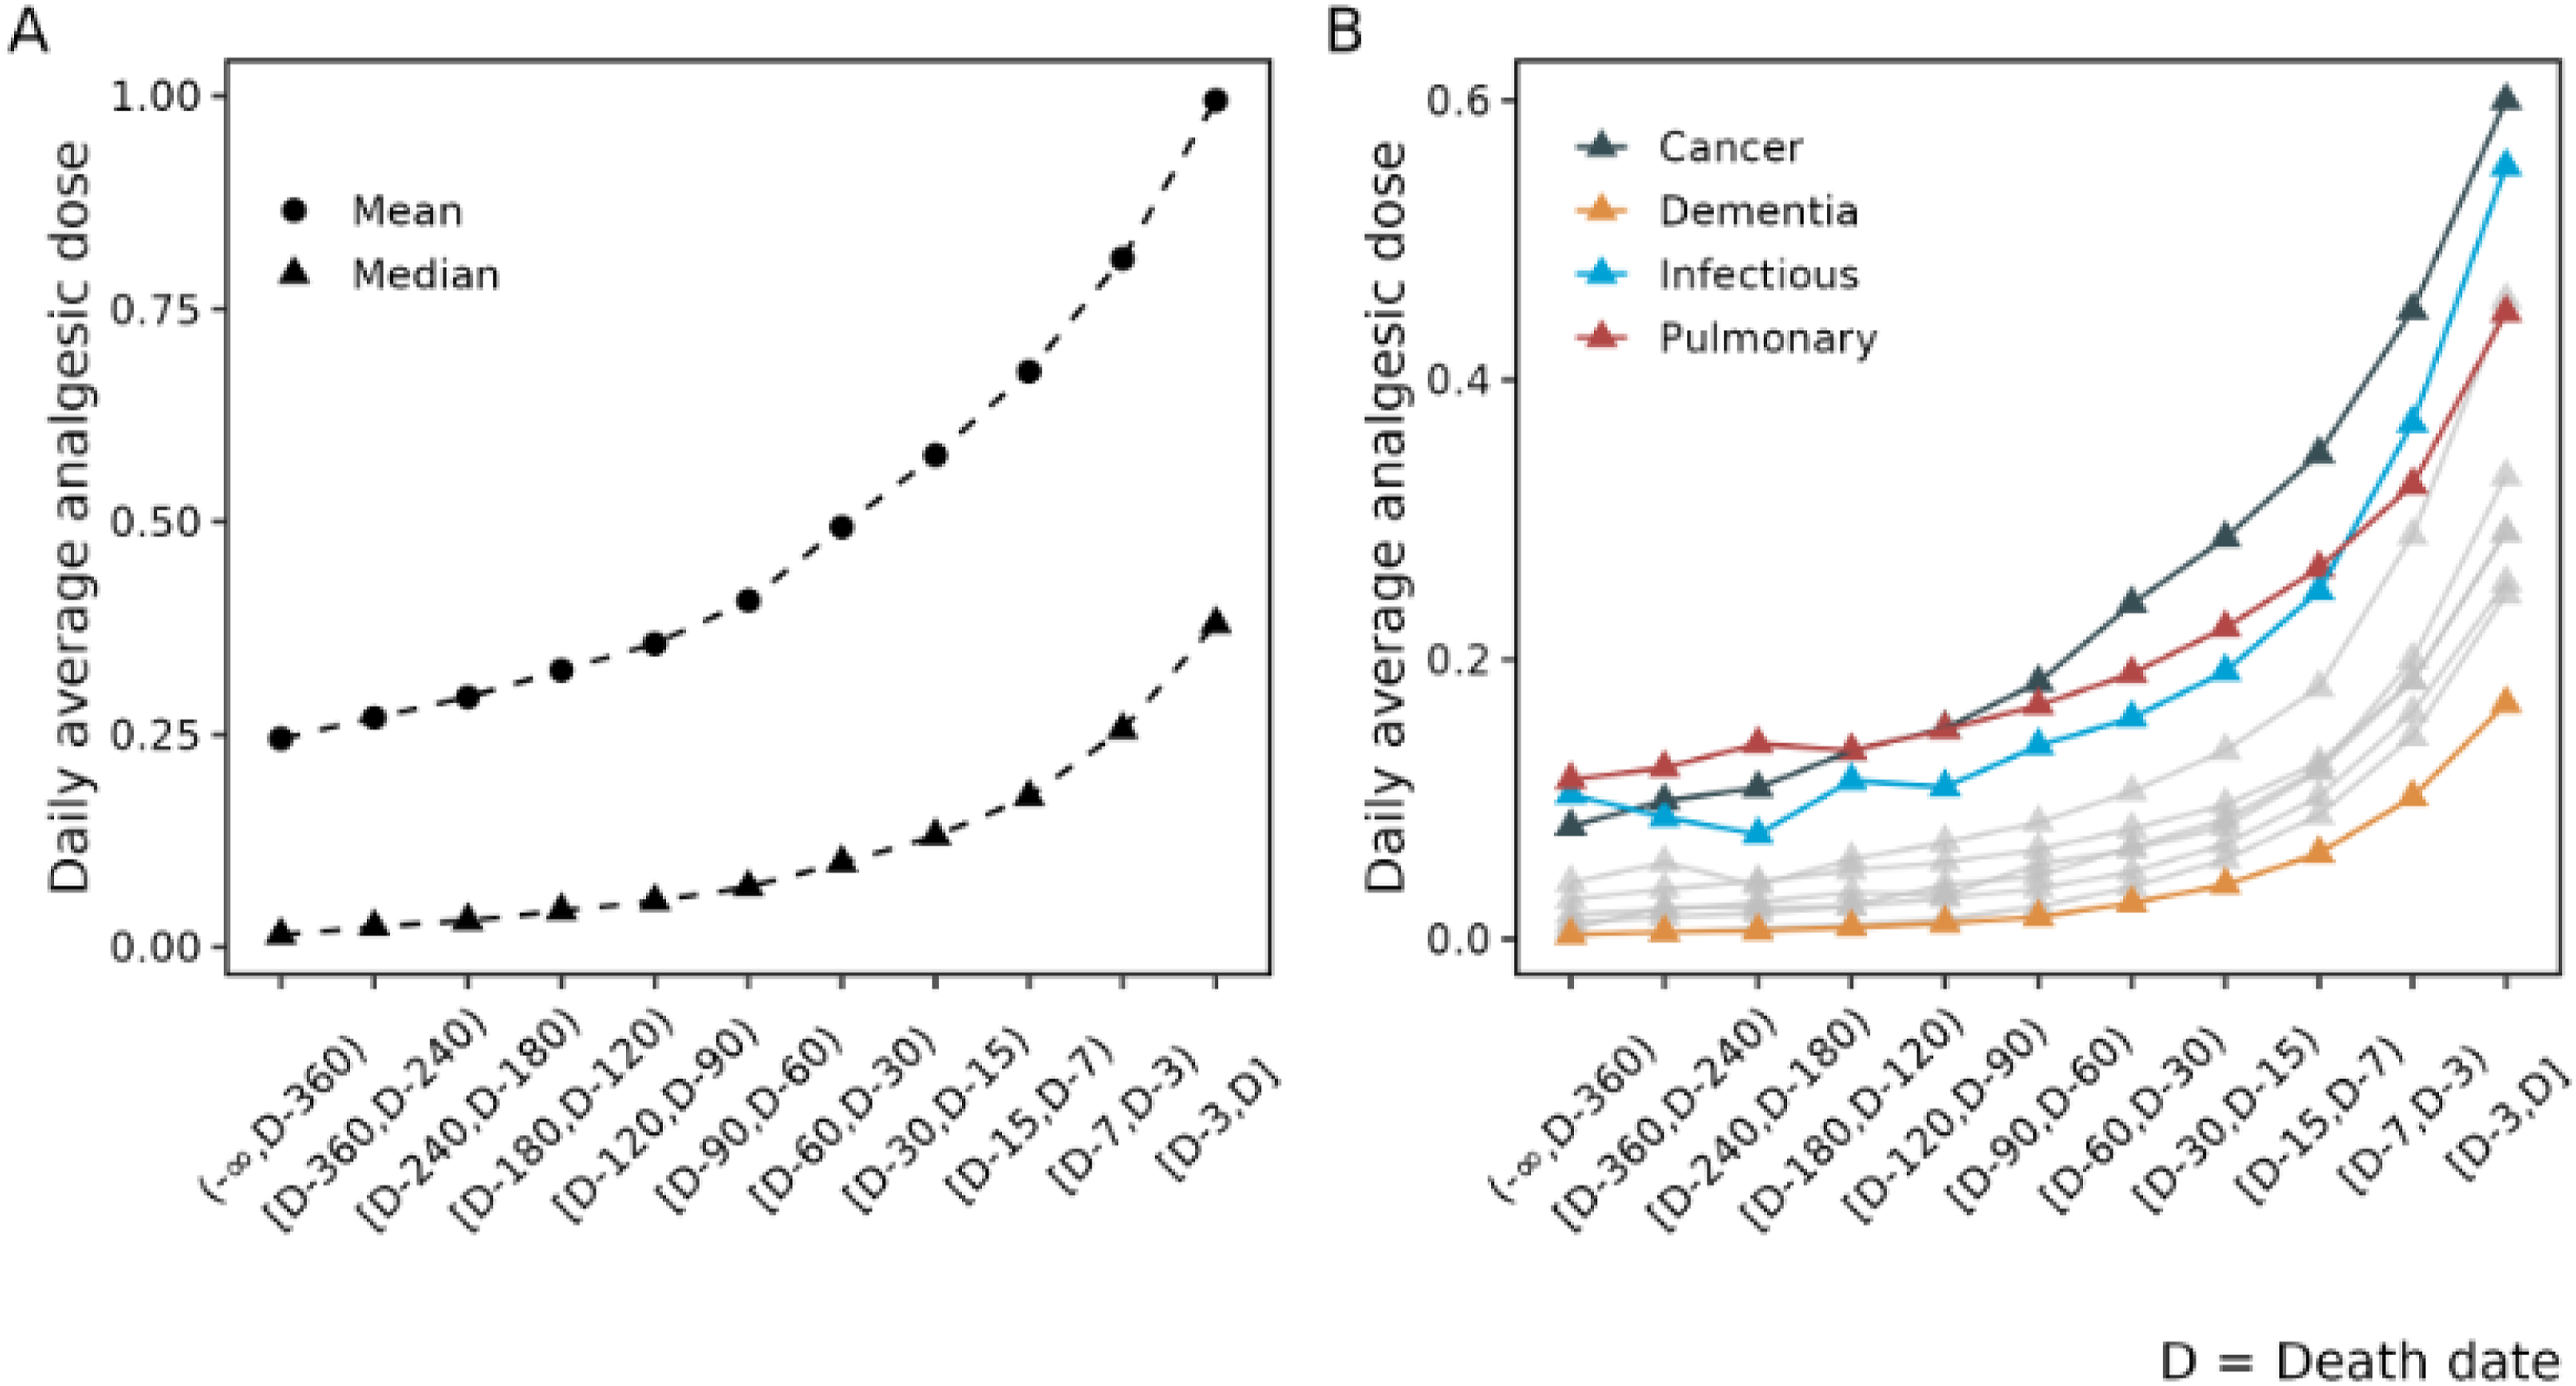
Discussion
In our secondary analysis of 472,196 patients enrolled into hospice, we found a median duration of survival of less than 4 weeks, though at least 25% of enrollees survived around 1 week, and another 25% survived 2 months. The survival was somewhat longer than the 17 days reported in Crowley’s recent single-system analysis, 5 which likely reflects case-mix—two-thirds of our cohort received routine home care, and dementia comprised 13% of patients, both groups known to have longer trajectories. 2 International comparisons reinforce that structural differences in hospice systems contribute to survival duration: median referral-to-death intervals in UK specialist palliative care (48 days) are consistently longer than those observed in U.S. Medicare hospice, where the 6-month eligibility rule and patterns of late referral shape length of stay. 16
Cagle et al. 14 have shown that, in the U.S., non-cancer decedents often have shorter hospice use than cancer patients. In our data, cancer does not have the shortest median survival; infectious and renal categories are shorter in absolute days. However, when we look at survival beyond 180 days, cancer has 1 of the lowest long-survival proportions (6.2%), exceeded by nearly all other HCC categories except infectious and “other.” Dementia, neurologic disease, pulmonary, cardiac, and diabetes all show much higher 6-month survival rates and adjusted odds ratios. This reinforces the idea that “non-cancer” is not a homogeneous group: some non-cancer conditions (infectious, renal) are referred very late, while others (dementia, neurologic, pulmonary) have long, often unpredictable courses, making 6-month prognostication particularly difficult.
Consistent with Sera, McPherson, and Holmes, 11 nearly all patients received at least 1 core palliative drug class, with high rates of co-prescribing. We extend this work by quantifying class combinations and, more importantly, describing end-of-life analgesic trajectories. Analgesic dose rose gradually over the hospice episode but increased sharply in the last 30 days and surged in the final 3 days across all diagnoses, with cancer showing the steepest escalation. Dementia maintained low dosing throughout. These findings suggest analgesic intensity may serve as a time-varying marker of symptom burden and proximity to death—an insight not captured in prior hospice survival studies or static prescribing summaries. 8
Conclusion
This analysis of a large national hospice database shows that median hospice survival remains short overall but varies widely by diagnosis, demographic factors, and care setting. Dementia, neurologic, and pulmonary conditions are associated with the longest stays, while infectious and renal diseases have the shortest. Nearly all patients receive multiple palliative drug classes, and analgesic doses rise sharply near death, providing a potential marker of clinical decline. These findings highlight substantial heterogeneity in hospice trajectories and underscore the need for diagnosis-aware, data-driven prognostic tools to support more timely and individualized referral and care planning.
Limitations
Although this study is based on a very large dataset, the data lack important information, in particular information about the patient prior to admission to hospice. As with any study of administrative data we do not know the difference between drug dispensing and utilization experience. Because the dataset is effectively a convenience sample it may not be nationally representative, although the size of the database may mitigate some of the potential bias.
Footnotes
Acknowledgement
The authors wish to thank research class students Yibing (Janice) Jiang, Jiajia Liu and Tashi Schaffner for their analysis of the data.
Funding
The authors received no financial support for the research, authorship, and/or publication of this article.
Declaration of Conflicting Interests
The authors declared no potential conflicts of interest with respect to the research, authorship, and/or publication of this article.