
Abstract
Flow-induced vibrations have proven to be a valuable power source for wireless sensors and MEMS devices. In this study, the energy harvesting aspects of an open cavity flow is explored and modelled as a single-degree-of-freedom system. Experiments with flow over a cavity of length-to-depth ratio of 3, with an incoming velocity of 30 m/s was taken as a case study to validate the model. It was observed in experiments that three distinct flow oscillation frequencies of significant amplitudes, corresponding to the different modes of oscillation were generated. To harvest this oscillatory power, a piezoelectric cantilever beam, mounted on the aft wall was subjected to unsteady pressure forces. To harvest efficiently, the natural frequency of the cantilever beam was tuned to lock in with the flow oscillation frequencies. The frequencies of cavity oscillations agreed well with Rossiter’s model in the experiments. A single-degree-of-freedom system assuming lumped parameters was used for modelling. The forcing term was described using a periodic function that uses empirical values for amplitude. The model was able to predict the overall trend and values of the average power and RMS voltage generated across a resistor load with reasonable accuracy. Using the model, the effects of cavity length, incoming velocity and resonant frequency were also studied.
1. Introduction
The academic and research interest in energy harvesting has increased tremendously over the last decade– a fact that can be evidenced from the number of publications released that is pertinent to this topic. While 412 research articles were published with energy harvesting as a keyword in the year 2005, the number rose to 7129 in 2021, according to the Scopus database. The research spans exploration of new sources, techniques and methods for energy harvesting as well as simulating and modelling them. Of these, energy harvesting from fluid flow-induced vibrations has attracted a spotlight owing to the abundance and more common occurrence of fluid flow in the form of rivers, wind and oceanic currents.
The main types of motion used for harvesting energy from fluid flow can be classified as flutter, buffeting, galloping and vortex-induced vibrations. In flutter-based energy harvesting, self-excited motions occur when the structure’s damping forces become inadequate to counter the aerodynamic forces and several non-linear models have been used to describe such energy harvesters (Abdelkefi, 2016). In transverse galloping, a bluff body attached to a cantilever beam and exposed to a wind starts oscillating with large amplitudes when the wind speed exceeds a critical value. Several lumped parameter models have been used to describe the energy harvesting characteristics of galloping-based energy harvesting. Zhao et al. (2013) compared three analytical models viz. the lumped parameter single-degree-of-freedom (SDOF) model, single-mode and multi-mode distributed model with Euler-beam representation. Their results showed that all three models were successful in predicting the average power generated by the energy harvester as well as their variation with wind speed and load resistance. The distributed parameter model had a more accurate representation of the aerodynamic force while the SDOF model was able to predict the cut-in wind speed better. They concluded that given the simplicity and ease, the SDOF model faired better in the prediction of the electro-aeroelastic behaviour of the galloping piezoelectric energy harvester. For the forcing term in the SDOF model, they used a polynomial expression of the angle of attack as
Another category of energy harvesters use vortex-induced vibrations (VIV) wherein the oscillator, typically a piezoelectric beam is placed in the wake region of a body like a cylinder, where periodic vortex shedding takes place. Akaydin et al. (2010) studied the power generated when a PVDF piezoelectric beam was placed in the wake region of a cylinder. The effect of resonance between the vortex shedding frequency and the piezoelectric beam was found to be significant in their studies. They also studied the distribution of voltage amplitudes in an open circuit condition and found that the probability distribution function of the amplitude obeyed a Rayleigh distribution. An SDOF model was proposed for the energy harvesting system, although no model for the forcing term was suggested in the work. Goushcha et al. (2015) studied the prospects of using a turbulent boundary layer for energy harvesting purposes. Along with experimental results, they also proposed a distributed parameter model based on the Euler-Bernoulli beam theory. Their model also incorporated the effects of various turbulent features as well as structural and electrical properties of the beam. Allen and Smits (2001) studied energy harvesting capabilities of a piezoelectric eel placed in the wake region of a bluff body. They used a simplified description of the oscillating system as an Euler-Bernoulli beam and also described a condition for lock-in to occur.
Due to their potential to power sensors using clean renewable energy, energy harvesting from fluid flows has triggered a re-examination of the previously undesirable structural response to fluid forces such as flutter, galloping, vortex-induced vibrations and buffeting. The academic community now views them with a hope to harness these undesirable and at times disastrous motions of the structure and transform them to useable sources of power. A most recent addition to this list is the self-sustained flow oscillations that are generated in cut-outs in aerodynamic surfaces, commonly called cavity flows. Since the exploratory study of Krishnamurty (1955), flow over rectangular cavities have been well-researched and analysed over the following decades. Rossiter (1964) was one of the first researchers to propose an empirical model to predict the frequency of flow oscillations in a cavity. This model is based on the assumption that vortical disturbances triggered from the cavity leading-edge travel downstream and interact with the aft wall. This interaction creates pressure disturbances that travel in the upstream direction to trigger further vortical disturbances at the leading edge – thus completing a feedback cycle. The model is fairly accurate and has been proven to apply to a wide range of flow conditions including supersonic inflows (Bauer and Dix, 1991; Saddington et al., 2016; Thangamani, 2019; Vikramaditya and Kurian, 2009a). However, that is not the case with predicting the amplitudes of the flow oscillations. There is not a widely accepted and applicable analytical model for predicting the amplitude which creates difficulty in describing the forcing term for energy harvesting. Bilanin and Covert (1973) proposed an analytical model wherein the shear layer was assumed as a thin vortex sheet and by using a line pressure force at the leading edge. This model, though matched well at higher supersonic Mach numbers did not show the same agreement at other regimes. Tam and Block (1978) improved the model by incorporating the effects of a finite shear layer and treated the shear layer interactions more rigorously. However, the results had limited success in a narrow regime.
Thangamani and Kok (2022) attempted to harvest energy from the flow oscillations emanating inside a cavity exposed to a low subsonic flow, using a piezoelectric cantilever beam attached perpendicularly to the cavity’s aft wall. The study used experimental and computational means to explore the potential of utilising cavity flows as a source of micro-energy harvesting. This work proposes an SDOF model for predicting the average power generated by the piezoelectric beam by making some assumptions regarding the flow. Unlike some of the models mentioned before, the forcing term for this scenario is challenging since the piezoelectric beam is exposed to a fluctuating incident shear layer. A periodic forcing term based on empirical values have been used and the results obtained has been validated and compared against the experimental values.
2. Experimental details
The key experimental objective was to design, construct and test a small scale cavity model that is capable of generating self-sustaining flow oscillations and utilise this for harvesting micro-wattage power. The experimental results obtained will be used to validate the proposed SDOF model. A test section, made of acrylic, embedded with a cavity of dimensions L × D × W = 150 mm × 50 mm × 50 mm was fabricated. This will yield a length-to-depth (L/D) and length-to-width (L/W) ratio of 3 (see Figure 1). An L/D ratio in the range 2–7 is said to exhibit open flow cavity whereupon the shear layer separating from the leading edge spans across and reaches towards the aft wall without touching the cavity floor (Tracy and Plentovich, 1993). Such open flow cavities exhibit strong oscillations (Ahuja and Mendoza, 1995) and a tuft flow visualisation for this cavity demonstrated the presence of flow oscillations by means of vigorous vibration of the tuft. The test section made was 310 mm long and was attached to the outlet of a converging section of a small scale wind tunnel called AF10, manufactured by TecQuipment® (Figure 2). The inlet velocity of the test section was measured to be 30 m/s and the boundary layer thickness based on 99% freestream velocity, measured at the leading edge of the cavity was found to be
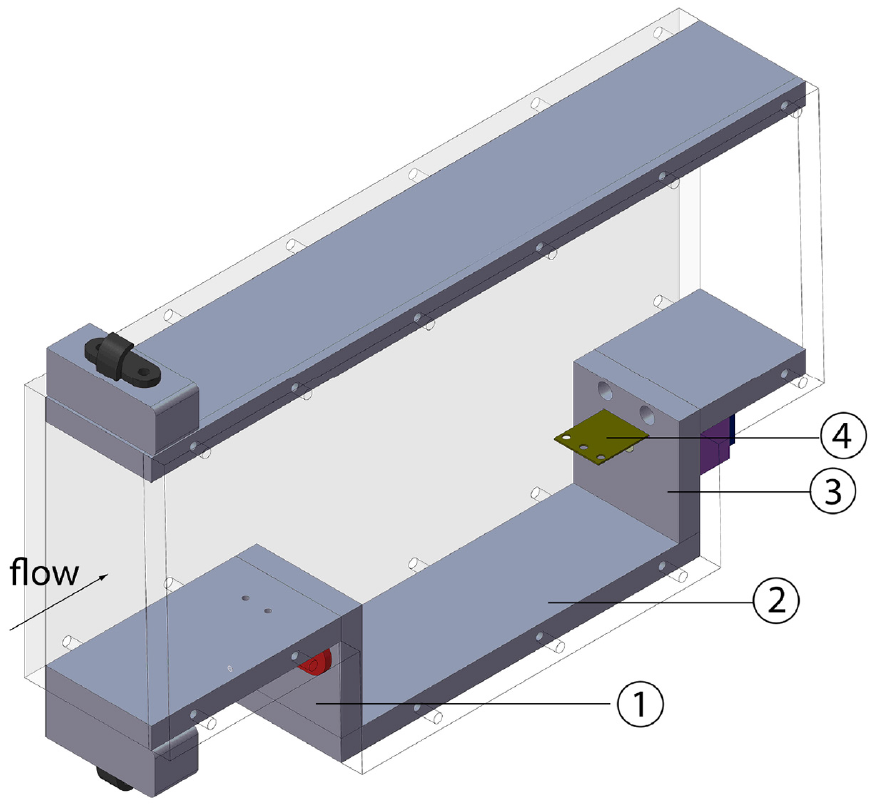
Test Section with piezoelectric beam located at aft wall. Numbered components show the (1) front wall, (2) cavity floor, (3) aft wall, (4) piezoelectric beam.
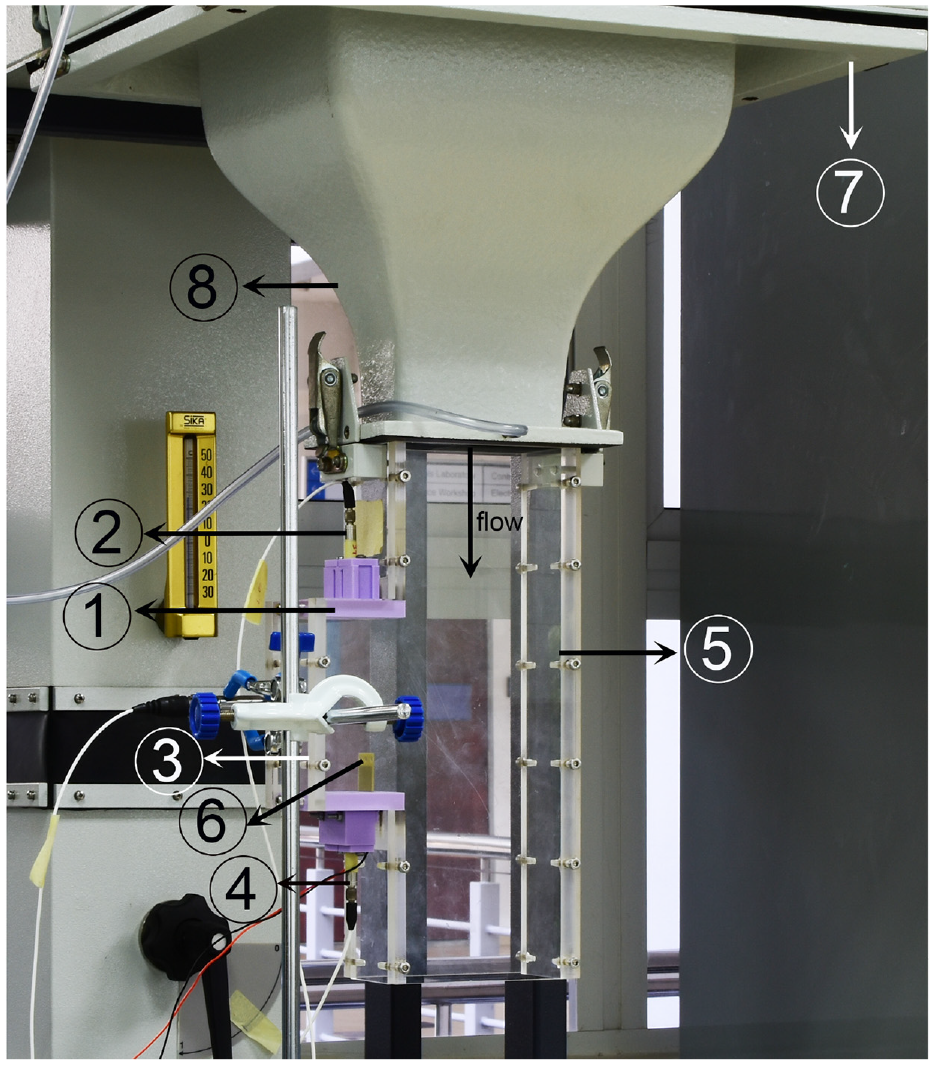
Test section assembly attached to flow bench (flow direction is vertically downwards). Numbered components show the (1) front wall, (2) front wall microphone, (3) cavity, (4) aft wall microphone, (5) rectangular test section with embedded cavity, (6) piezoelectric beam, (7) settling chamber and (8) converging nozzle.
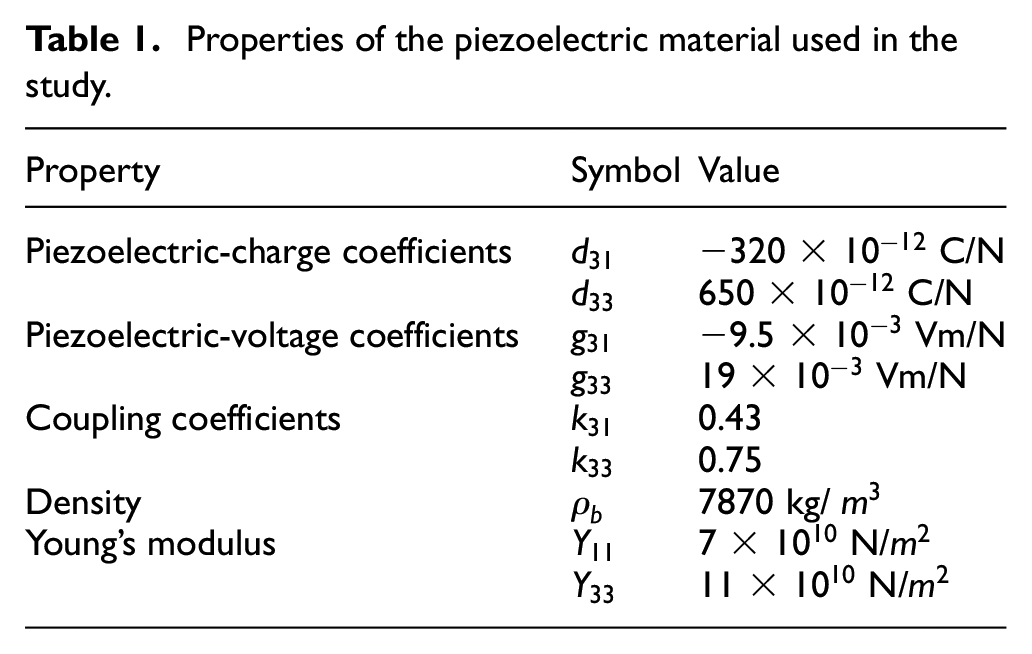
For energy harvesting, a single-layered PZT-5H piezoelectric beam (Piezoelectric Beam abbreviated as PB hereupon), manufactured by Midé was used. The PB weighs 2 g and is suitable for harnessing energy at resonant frequencies up to 660 Hz. Some of the key properties of the PB are given in Table 1.
Properties of the piezoelectric material used in the study.
The PB was installed perpendicularly to the aft wall at a depth of 0.22D from the trailing edge (Figure 3). Results obtained from CFD studies showed this to be a region of very high levels of unsteady pressure and hence this location was chosen (Thangamani and Kok, 2022). The resonant frequency of the PB can be changed by changing the clamping length and/or by adding masses to the tip. The fixtures required for holding the PB was 3D printed. The overall dimensions of the PB are
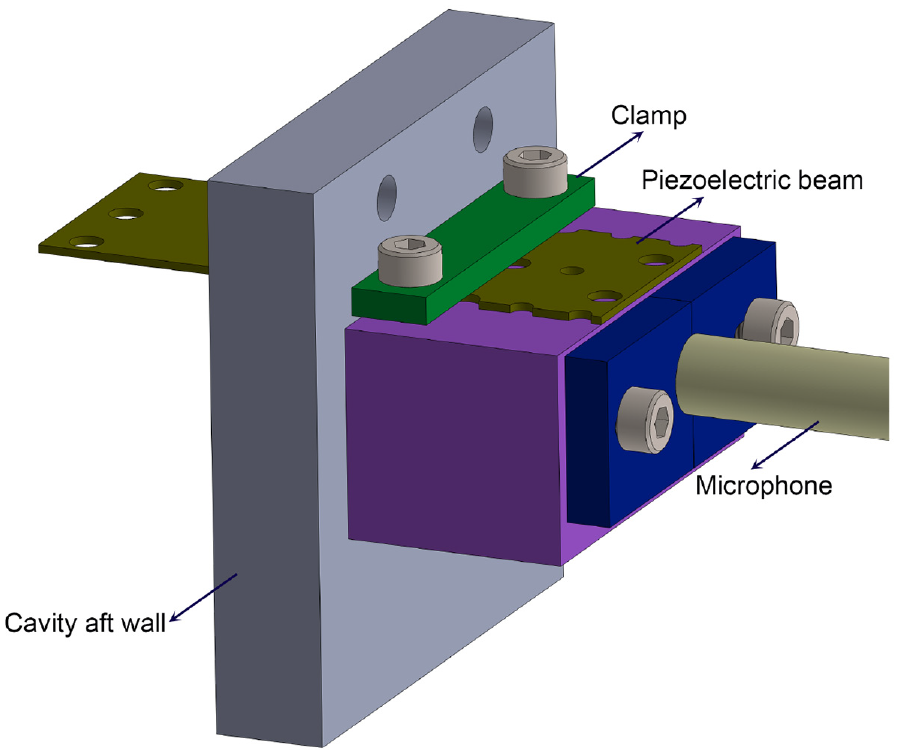
Detailed view of piezoelectric beam installed at aft wall.
The frequency of cavity flow oscillations was measured using pre-polarised 130F21 microphones manufactured by PCB. The 130F21 microphone is an Integrated Circuit Piezoelectric (ICP®) model with a sensitivity of 45 mV/Pa and has a built-in preamplifier. Three microphones of diameter 1/4″ each were flush-mounted on the cavity front wall, floor and aft wall respectively. Their centre locations are (x/L, y/D, z/W) = (0, −0.42, 0), (0.5, −1, 0) and (1, −0.42, 0) respectively. The axis directions are shown in Figure 1 and the origin is kept at the centre of the leading edge.
The tip displacement of the PB in free oscillations was measured using a Keyence manufactured IL-100 high-precision laser sensor that was used along with an IL-1000 amplifier unit. The IL-100 is a CMOS analogue laser sensor that has a displacement measurement range of 55 mm (75 mm–130 mm from the laser head). The system has a repeatability of 4
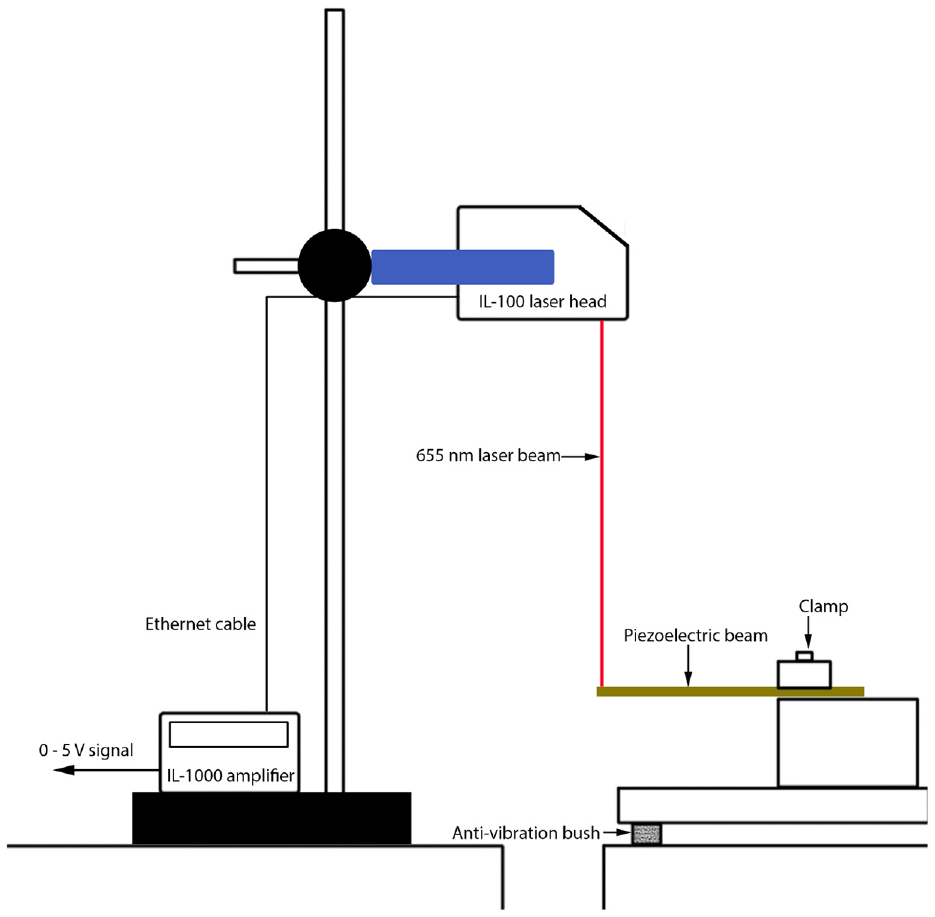
Keyence IL-100 set up to measure tip displacements.
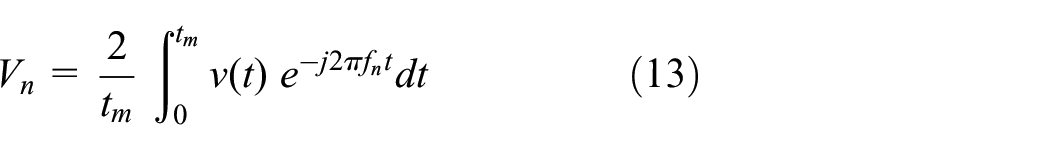
Data acquisition was done using a National Instruments data acquisition module NI USB-4431 which has a 24-bit resolution and can acquire signals at a sampling rate of up to 102.4 kHz. For transient pressure acquisition, 327,680 samples were acquired at a sampling speed of 32,768 Hz for a measurement time of 10 s. Welch’s method was used to plot power spectral densities in order to identify the various frequencies of interest. For this, the sample was divided to 8192-point segments with a 50% overlap using a Hamming window, yielding a frequency resolution of 4 Hz. To obtain the final power spectral density plots used in this work, the spectrum obtained from 10 different tunnel runs were averaged to obtain even more accuracy. Over the different tunnel runs, no change in dominant frequencies was noticed. The maximum standard uncertainty in amplitude for any of the first three cavity modes,

3. Results and discussion
In this section, the unsteady pressure field of the baseline cavity is discussed first, followed by the cavity with the PB. The details of the energy harvested are also provided here. In the subsequent section, a simplified mathematical model based on single-degree-of-freedom (SDOF) assumption is described and compared with the results obtained in the experiments.
3.1. Baseline cavity
The basic mechanism responsible for self-sustaining oscillations observed in a cavity flow has been well-established in several works (Heller and Bliss, 1975; Rossiter, 1964; Thangamani and Kurian, 2013; Tracy and Plentovich, 1993; Vikramaditya and Kurian, 2009b). Rossiter (1964) was the first to propose a feedback model that was improved by subsequent researchers. According to this fluid-acoustic model, vortical disturbances created at the leading edge convect downstream with a velocity
where
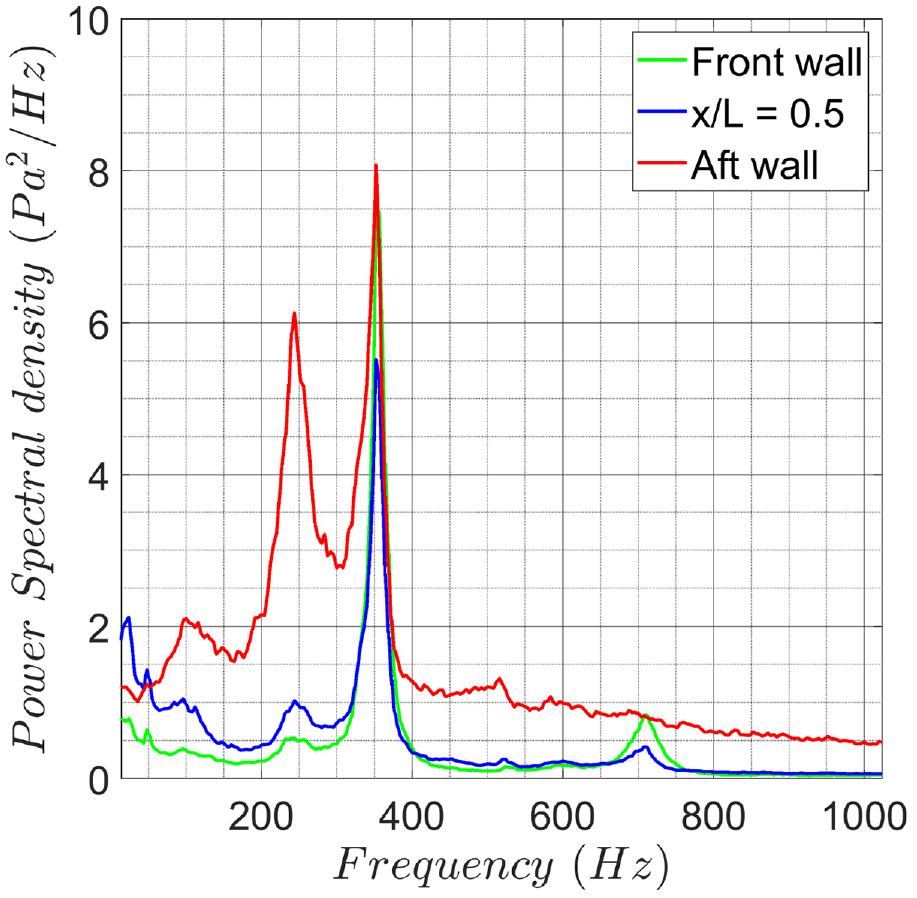
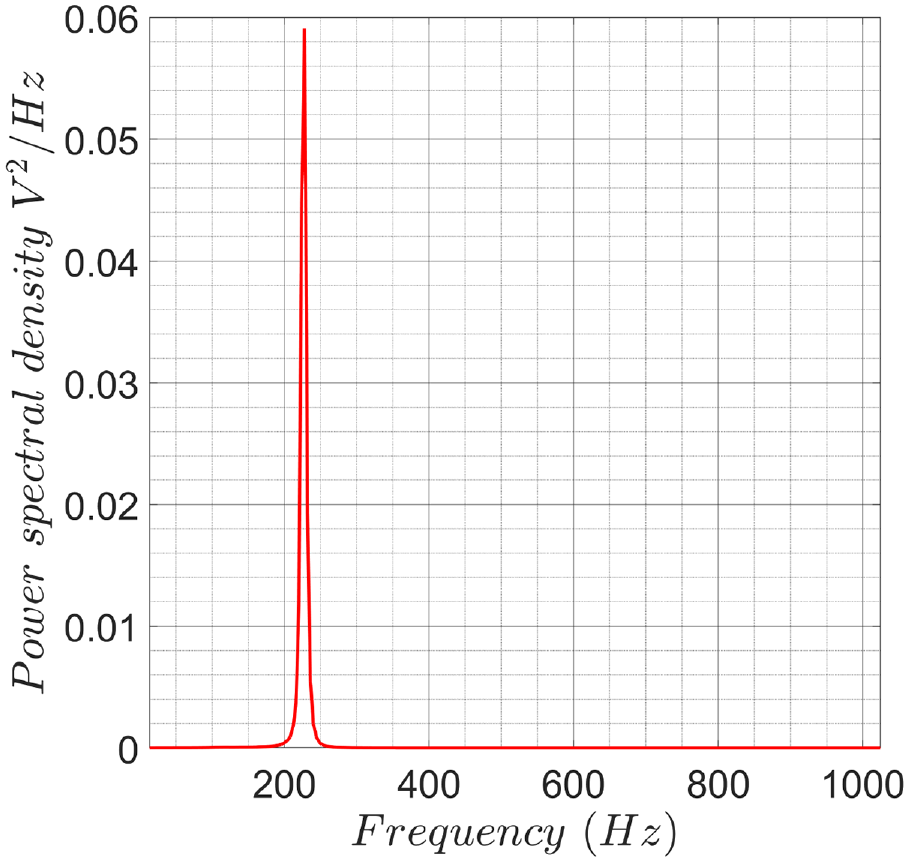
Power spectral densities for the baseline cavity (Thangamani and Kok, 2022).
Three prominent peaks at 116, 244 and 352 Hz can be noticed in the plot. It can be seen that the dominant mode of flow oscillation for the baseline cavity is the third mode (n = 3) followed by the second mode. The first mode is feeble and is spread over a wider band. For brevity, the first, second and third modes of oscillations would be denoted as
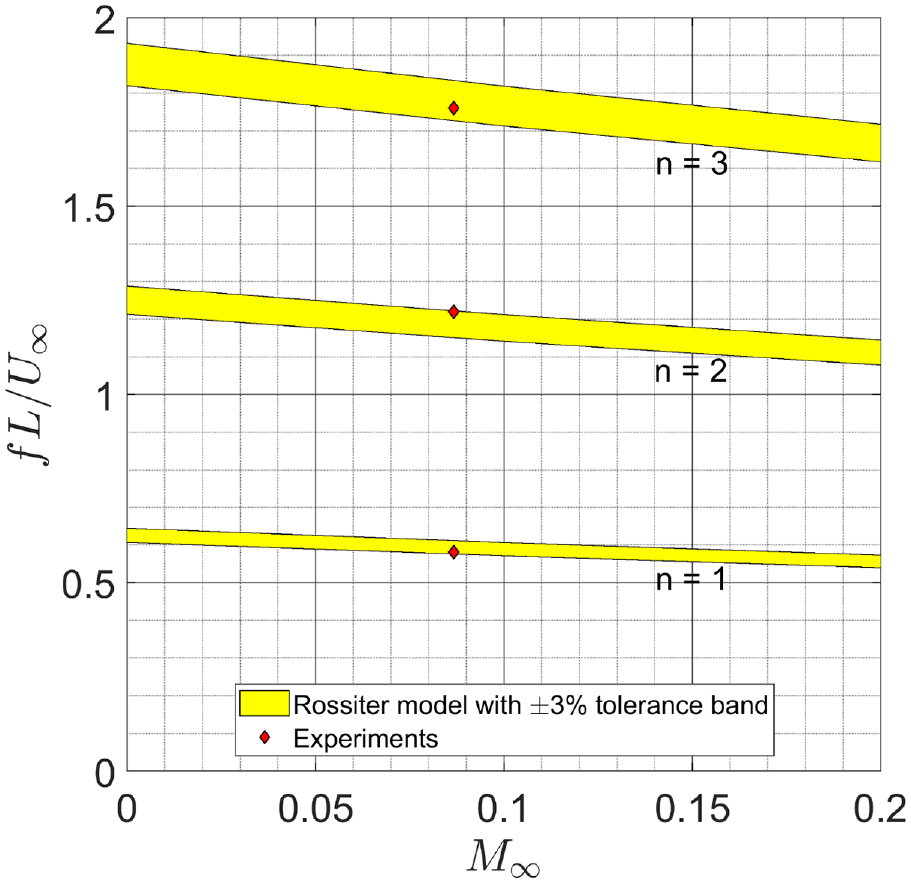
Comparison of experimental Strouhal numbers with Rossiter’s model (
3.2. Cavity with piezoelectric beam
For energy harvesting, the PB was installed perpendicularly to the aft wall at a distance of 0.22 D from the trailing edge. This is a region of high-pressure fluctuation and is expected to apply an external forcing for the PB, thus oscillating it to generate electrical energy. Although the introduction of PB into the cavity does not change the outer dimensions of the cavity, it still may have some impact on the flow dynamics within it due to its intrusiveness and the location near the trailing edge which is vital for the feedback cycle. To study the effect of this, the power spectral density at the aft wall when the PB is fitted is compared with the baseline case. It can be seen from Figure 7 that when the PB is located at the aft wall, the spectrum still has high levels of unsteadiness although a slight reduction in mode frequencies occur. Also, the dominant mode of oscillation shifts from
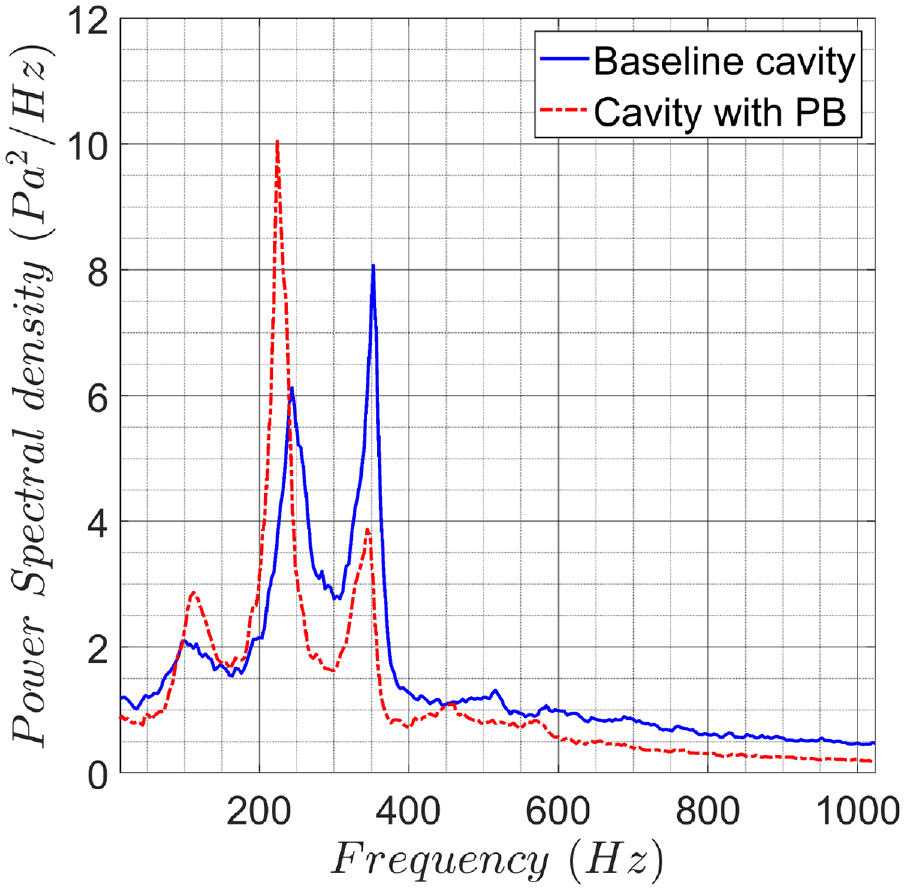
Comparison of spectra between baseline cavity and cavity with PB at aft wall (Thangamani and Kok, 2022).
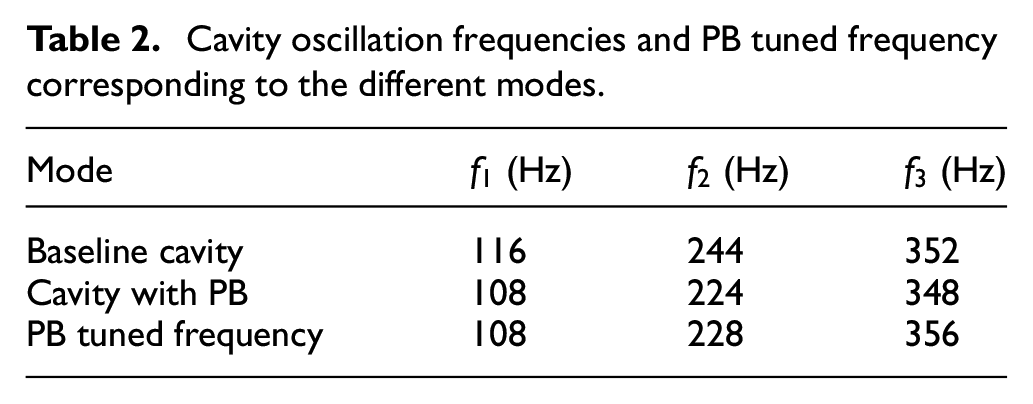
Cavity oscillation frequencies and PB tuned frequency corresponding to the different modes.
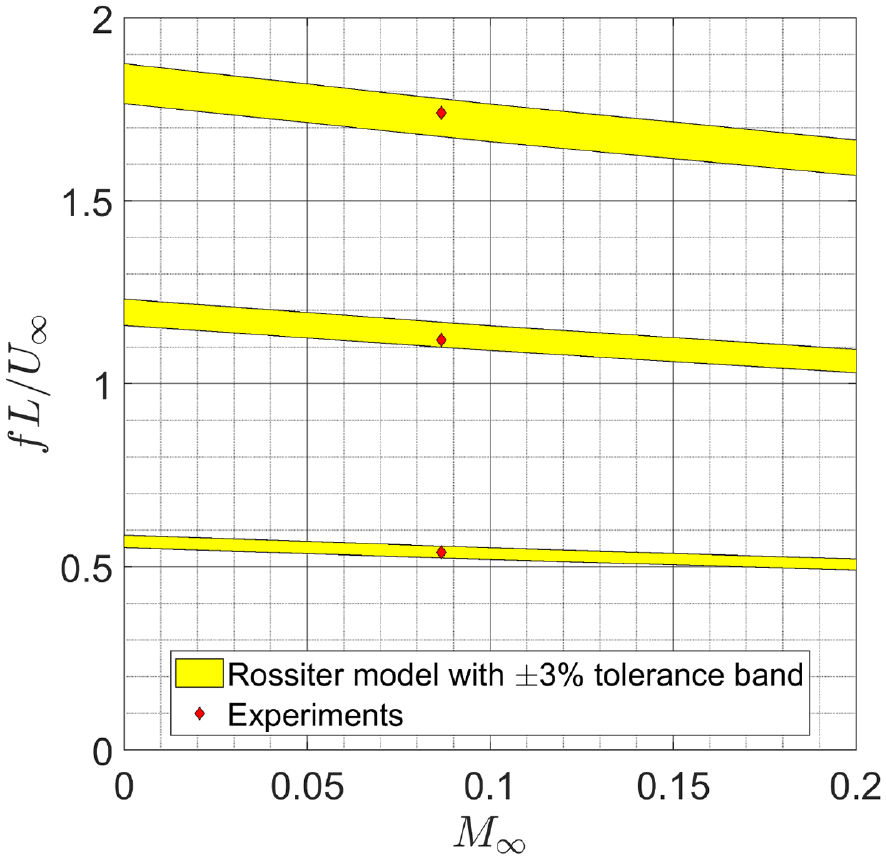
Comparison between experimental Strouhal numbers for cavity with PB and Rossiter’s model (
From the discussion above, it is clear that Rossiter’s model, given by equation (2), is well suited to be used for a theoretical model for estimating the frequencies of cavity flow oscillations. The suitable value of
3.3. Single degree-of-freedom (SDOF) model
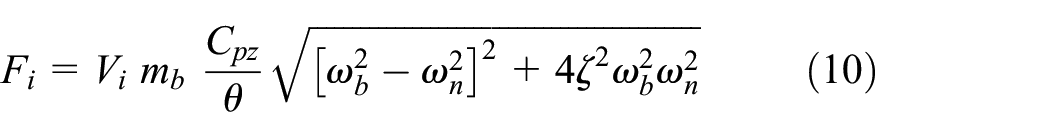
To mathematically model the system in order to predict the energy harvested by a PB installed in a given cavity flow, few simplifications and assumptions have been made. The amplitude of vibrations is assumed to be small enough to be described as a linear system. A single degree of freedom is assumed for the vibrations of the PB that is essentially fixed like a cantilever on the downstream end to the aft wall. To estimate the frequency of flow oscillations, equation (2) described by Rossiter is used. The real process occurring behind energy harvesting is a complex fluid-mechano-electrical phenomenon that is computationally expensive and complicated.
For the PB installed as a cantilever exposed to external fluid force, the governing equations for the cantilever beam oscillation and harvester circuit are given by
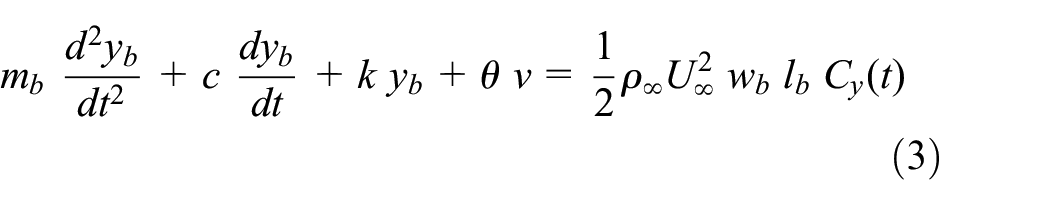
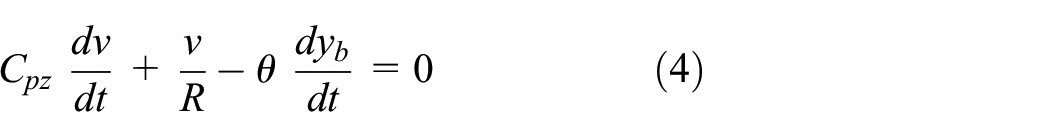
where
For solving the system of equations, we can rewrite the equations by defining a state vector
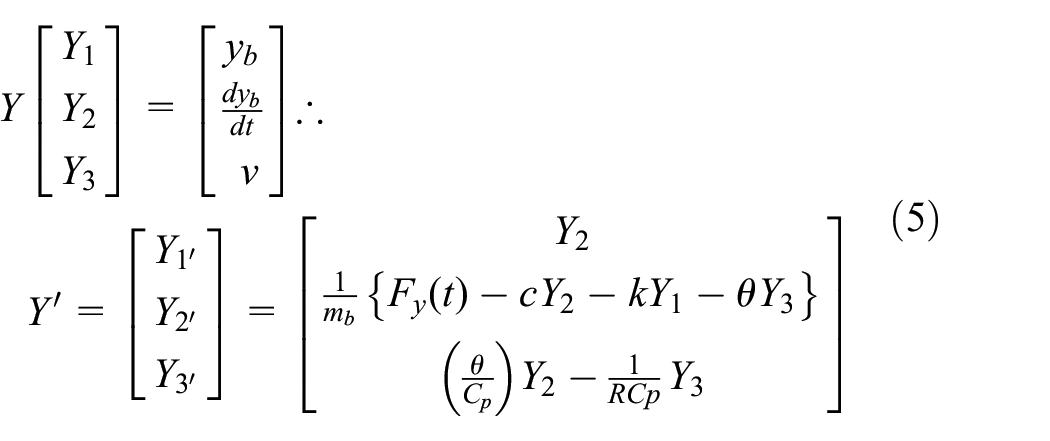
The first-order system of equation represented by equation (5) can be solved numerically using Matlab’s ode45 function and the validity of the model is tested for various cases viz. free oscillations with open circuit condition, forced oscillations with open circuit condition and forced oscillations with a resistor load.
Three different settings of the PB was tested corresponding to the three modes of cavity oscillation frequencies. The PB was tuned by either changing the length of the beam or by adding tip mass. The different tuned frequencies tested are shown in Table 2 and the tuned frequencies lie within 8 Hz of the cavity oscillation mode frequency. This will facilitate lock-in conditions with high amplitude oscillations of the PB resulting in better power harvesting. The clamped length of the PB was set at 37 and 34 mm for locking in with
3.4. Case 1: Free oscillations with open circuit condition
In the first case, the PB is allowed to undergo free oscillations without external forcing and the voltage output
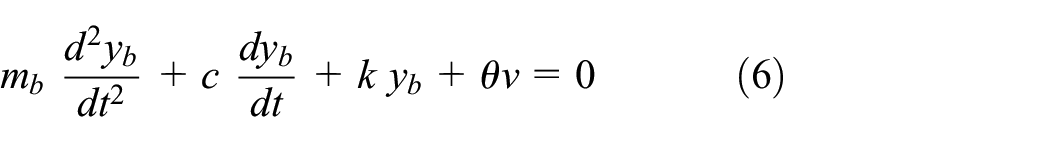
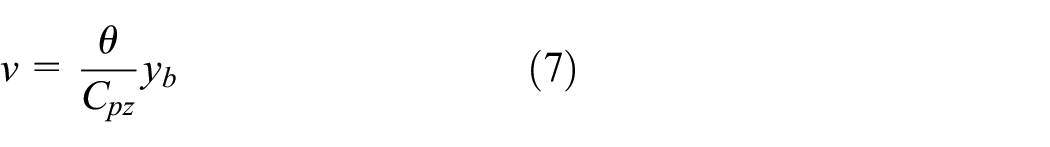
Combining equations (6) and (7) we get
It can be seen from equation (8) that the stiffness of the PB in this condition has increased as
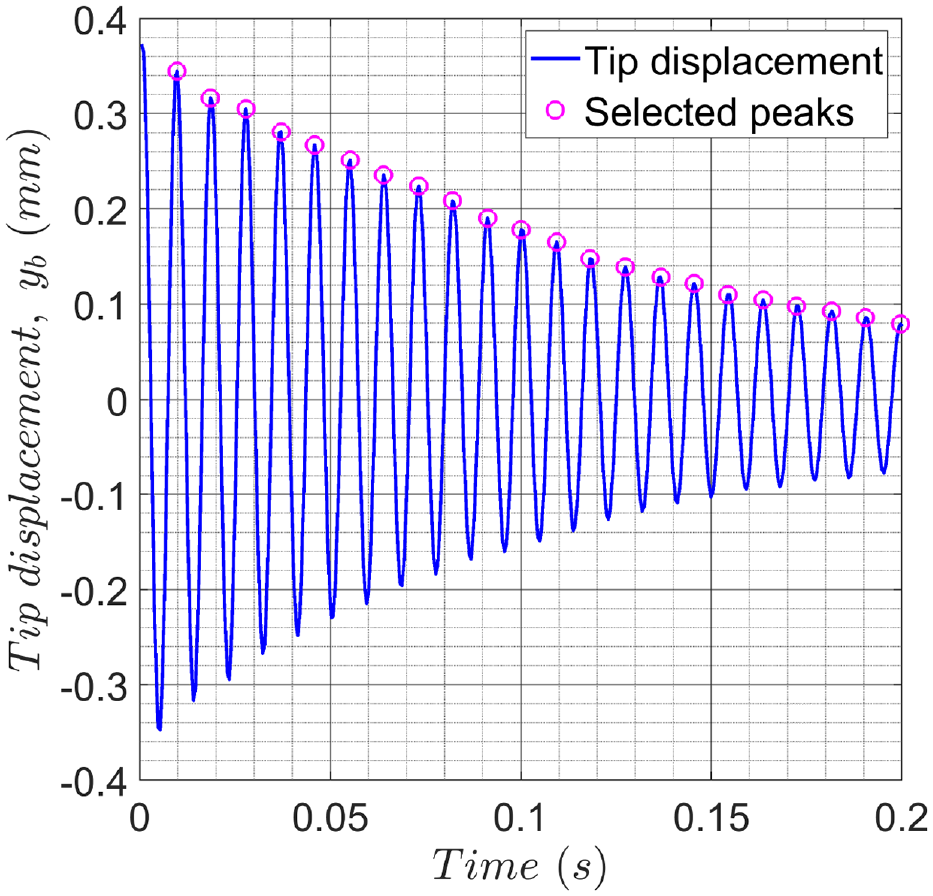
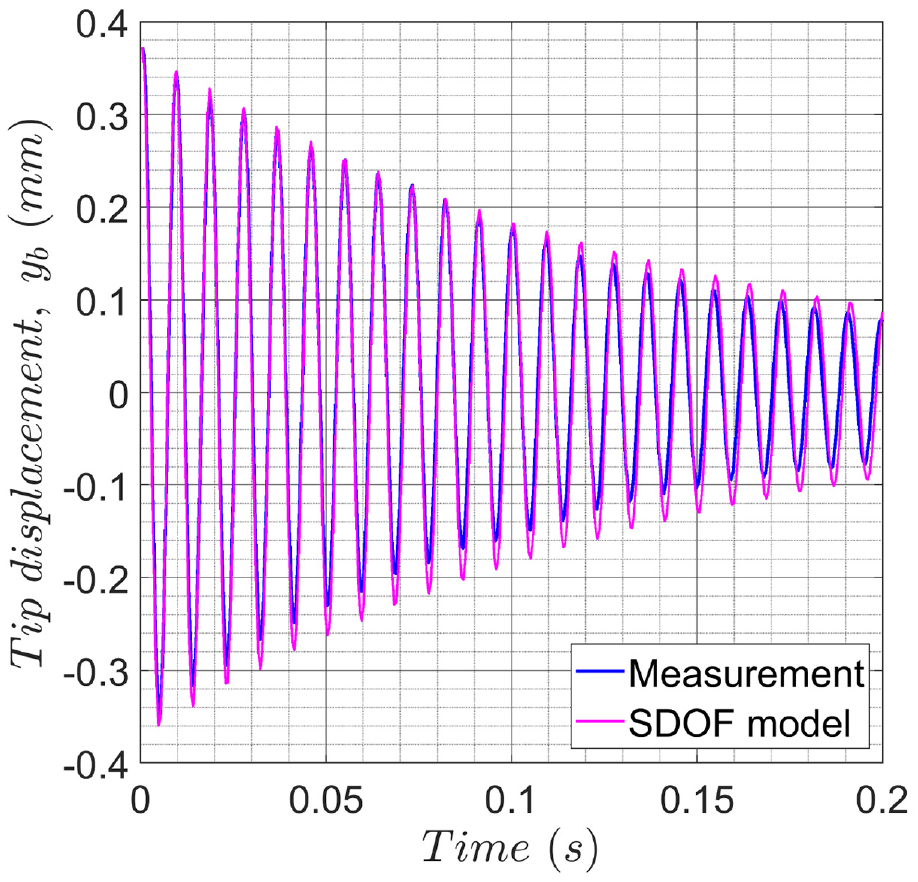
Measured tip displacement variation for ring out test with PB tuned to 108 Hz.
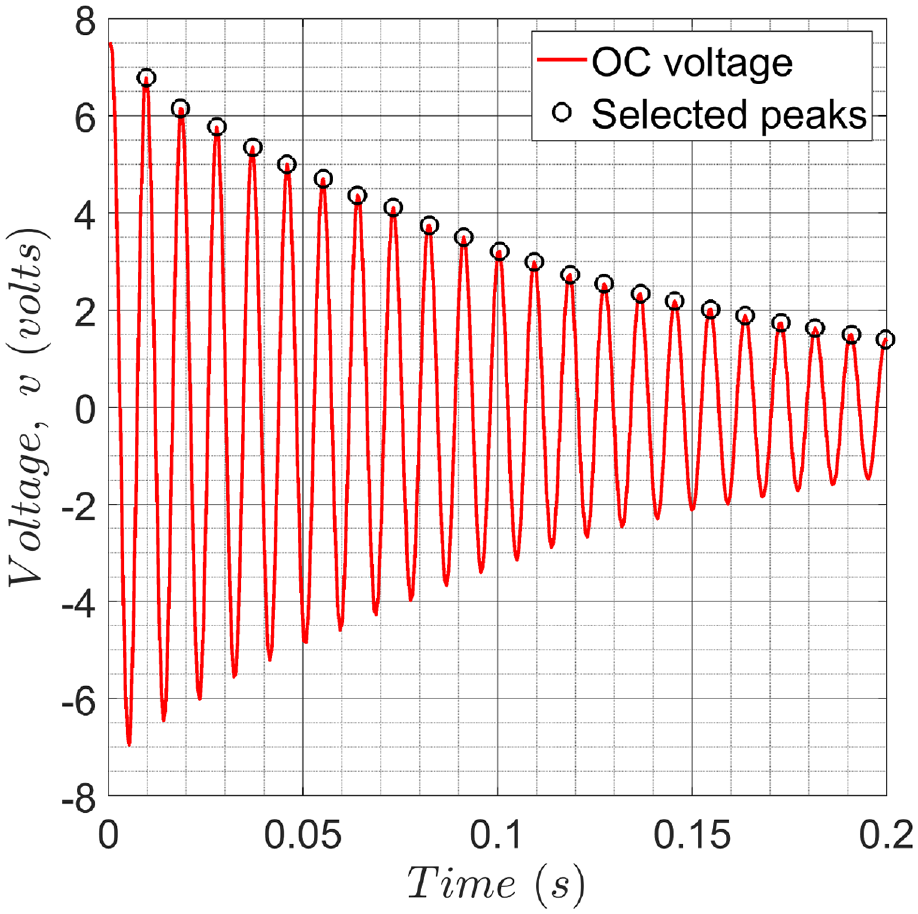
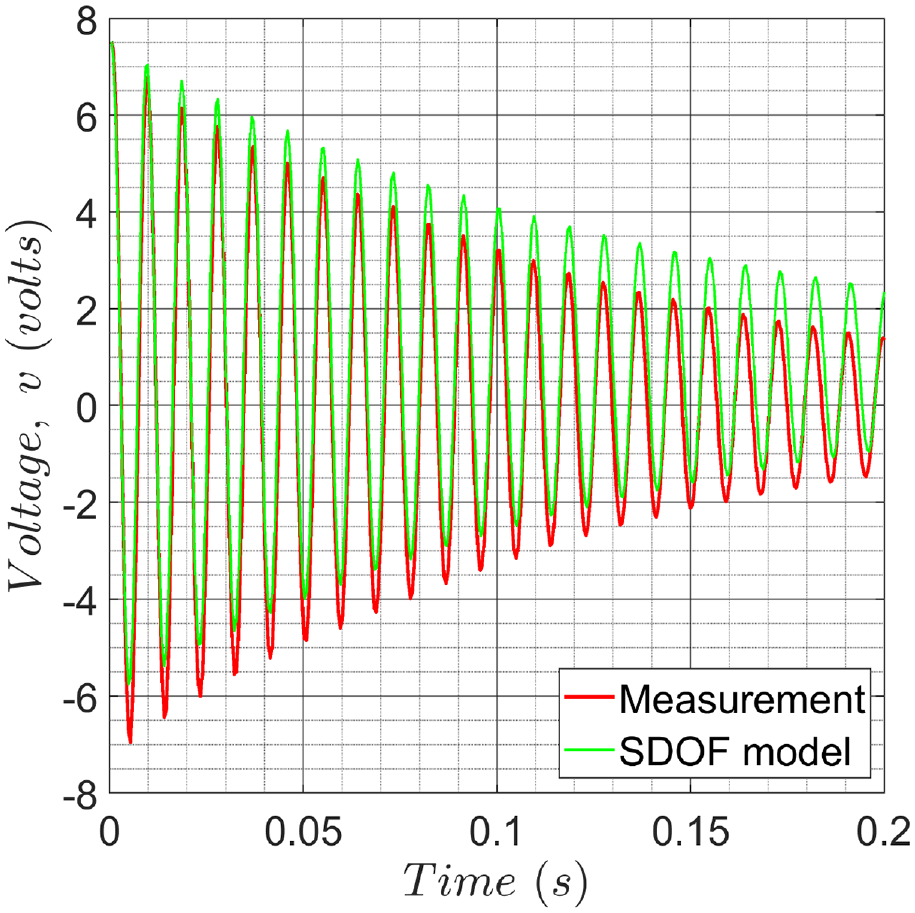
Measured voltage variation for ring out test with PB tuned to 108 Hz.
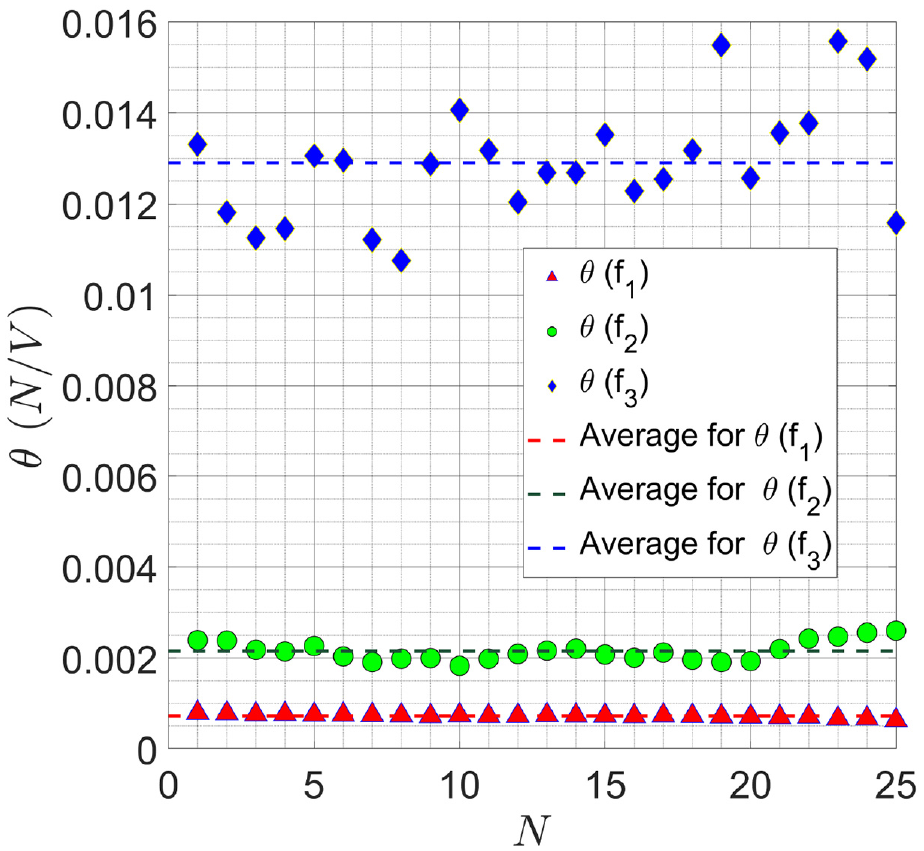
values obtained for various resonant conditions.
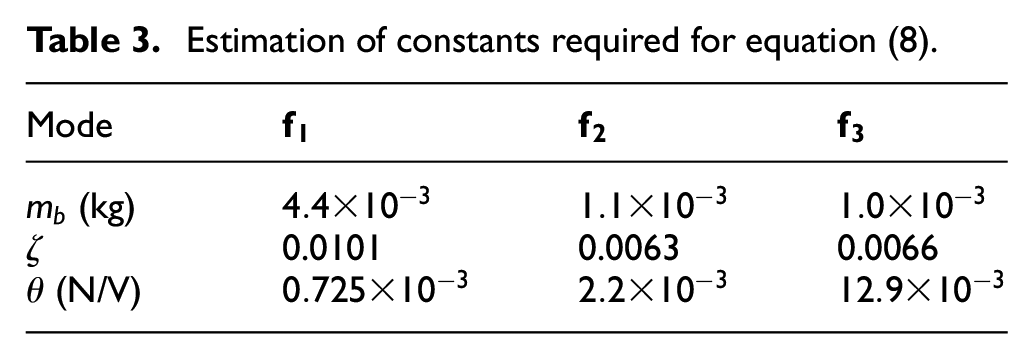
Estimation of constants required for equation (8).
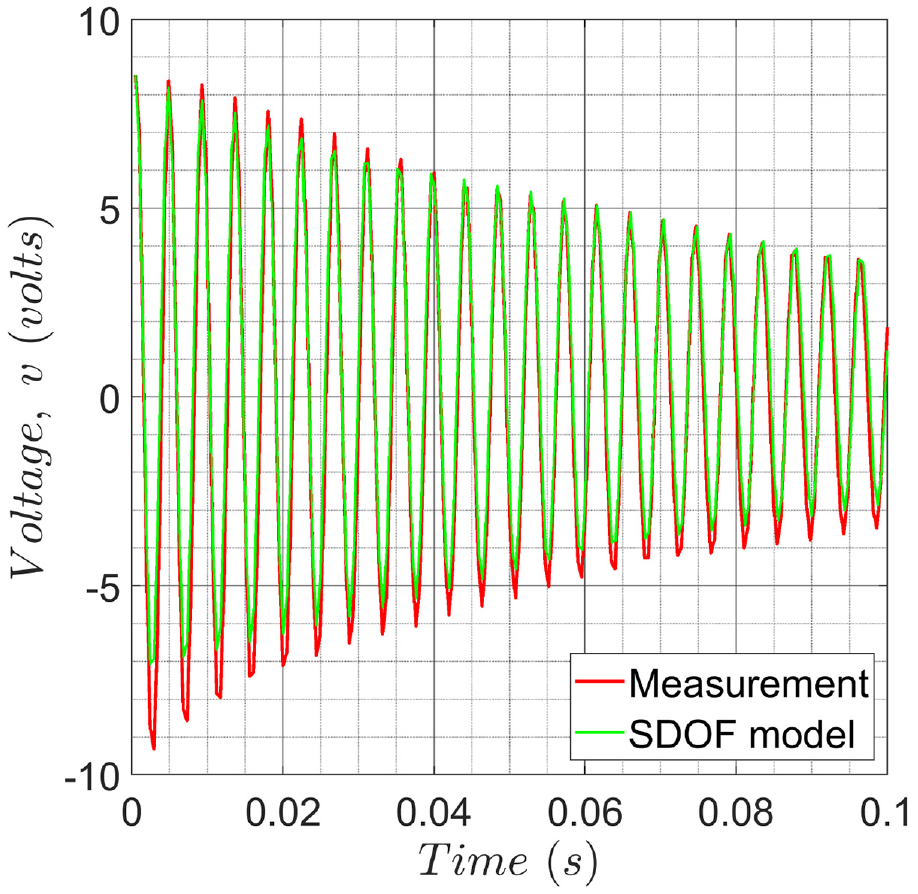
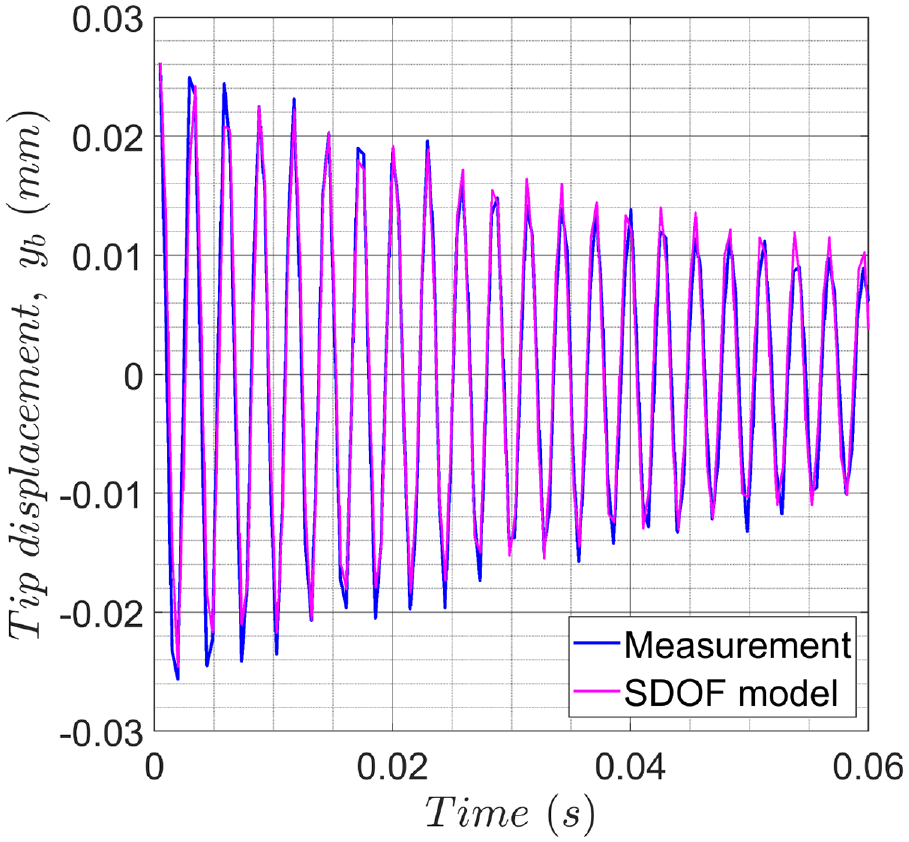
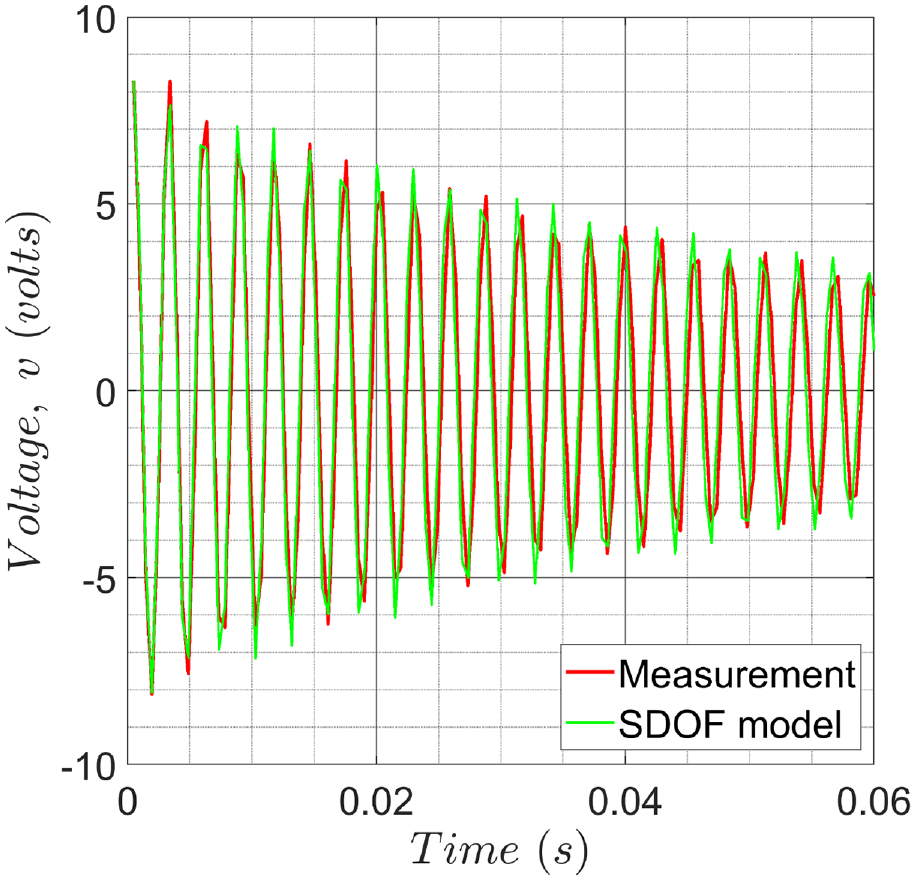
The open-circuit voltage response of the PB obtained by numerically solving the SDOF equation (8) has been compared with the experimental results in Figures 12 to 17 when PB was tuned to the different cavity flow frequencies. It can be noticed that the SDOF model is fairly reasonable in predicting the temporal response of the oscillating beam. The RMS value of the tip displacement for a period of
Comparison of tip displacement variation between experiments and SDOF model (
Comparison of voltage variation between experiments and SDOF model (
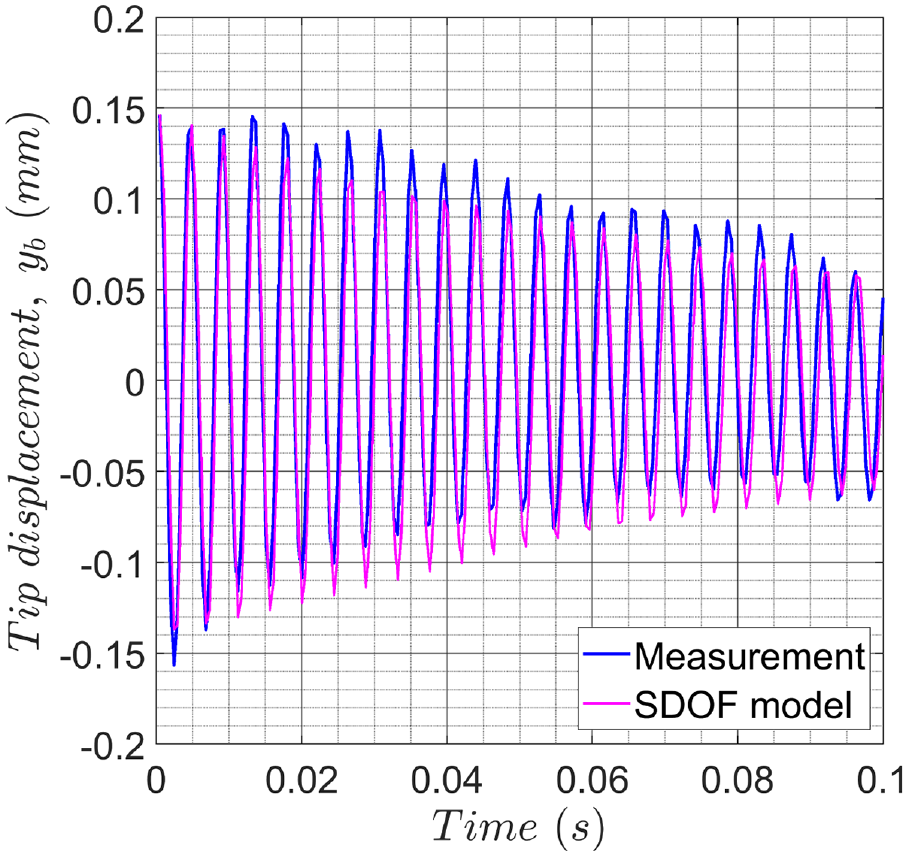
Comparison of tip displacement variation between experiments and SDOF model (
Comparison of voltage variation between experiments and SDOF model (
Comparison of tip displacement variation between experiments and SDOF model (
Comparison of voltage variation between experiments and SDOF model (
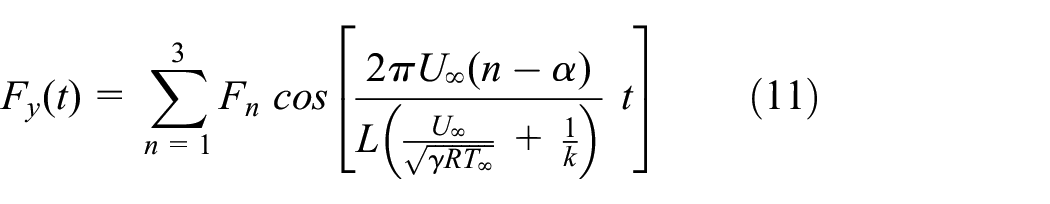
3.5. Case 2: Forced oscillations with open circuit
In forced oscillations with open circuit, the forcing term
In equation (9),
where

Frequency response of the PB at
However, upon closer inspection of the power spectrum of the peak, it was noted that multiple frequencies close to the
where
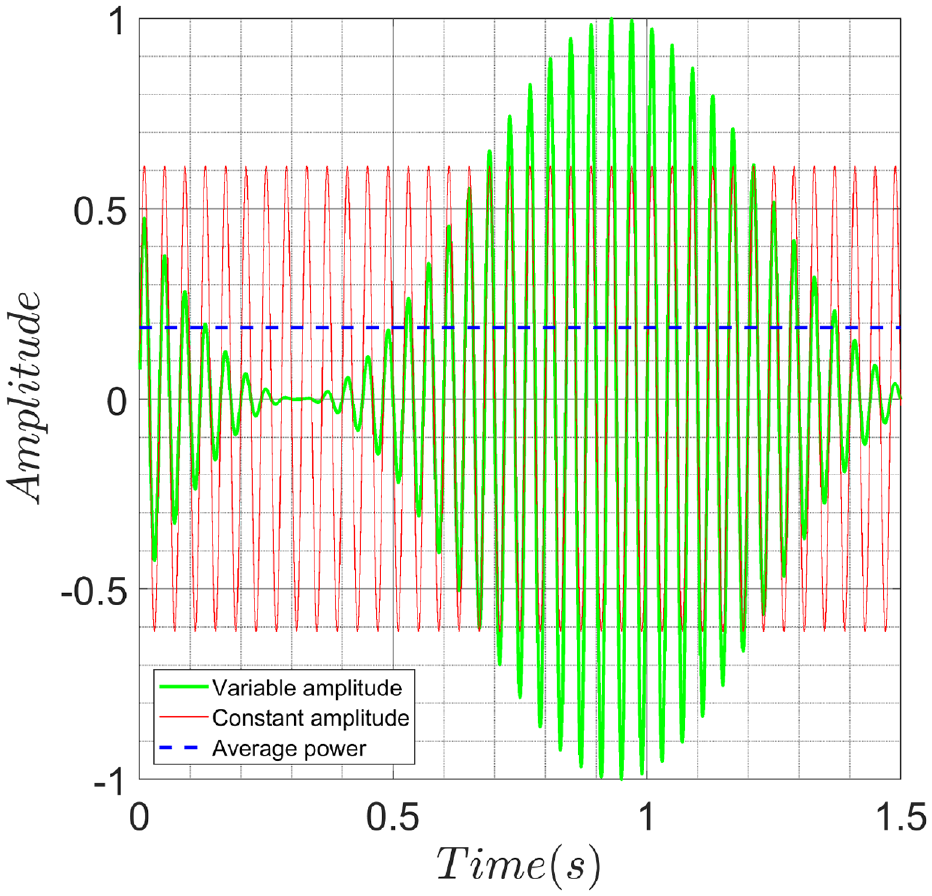
Comparison of two periodic signals with same average power – one with variable amplitude and another with constant amplitude.
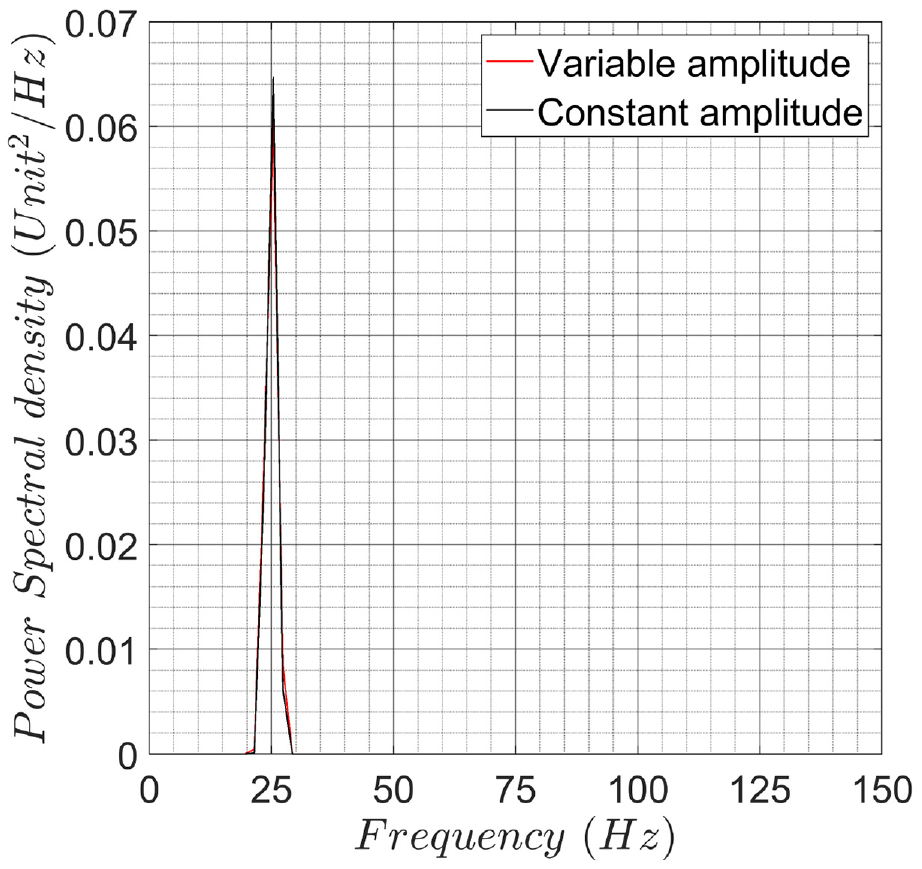
Frequency spectral density of the two different signals shown in Figure 19.
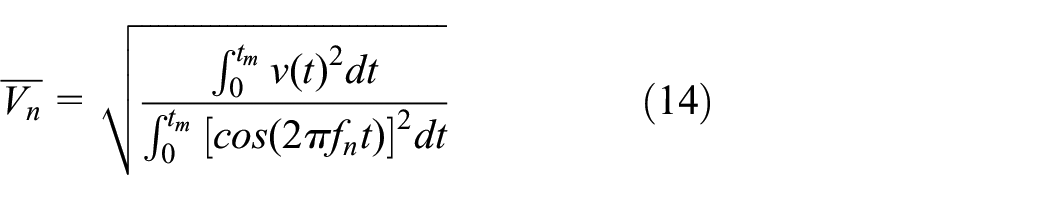
Thus the representative and empirical value of the coefficient for the force term corresponding to the
The values of
3.6. Case 3: Forced oscillations with resistor load
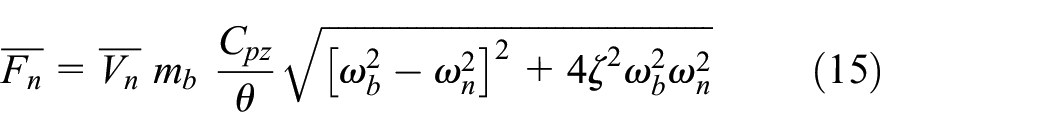
In this case, the system of equations is solved in its entirety. Following the discussion so far, the complete system to be solved is given as
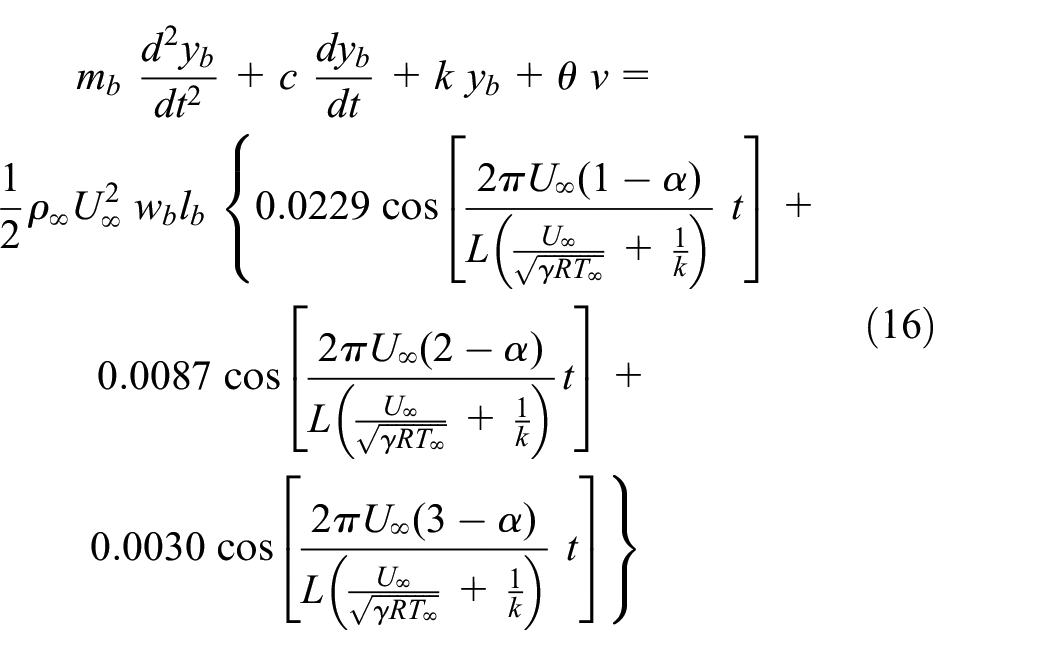
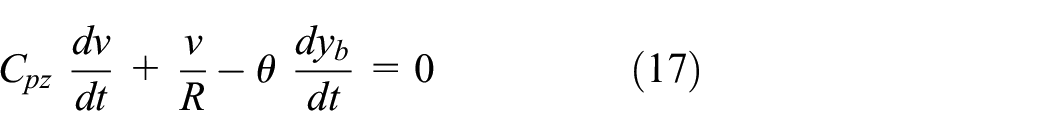
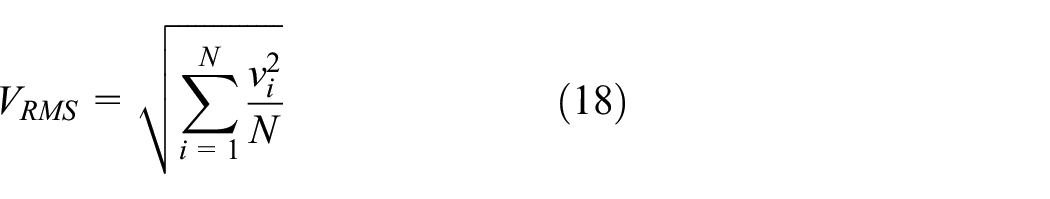
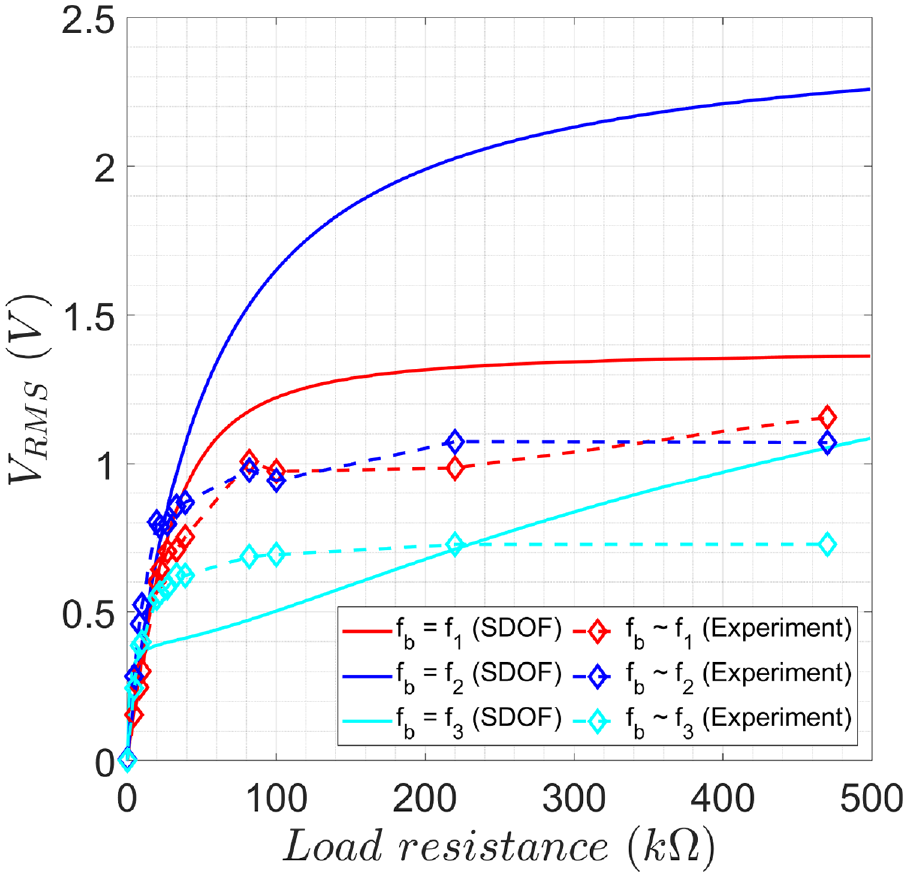
Equations (16) and (17) were solved simultaneously using a Matlab programme and the comparison of the average power across different load resistance values obtained from the SDOF model and the experiments is shown in Figure 21. The RMS voltage (
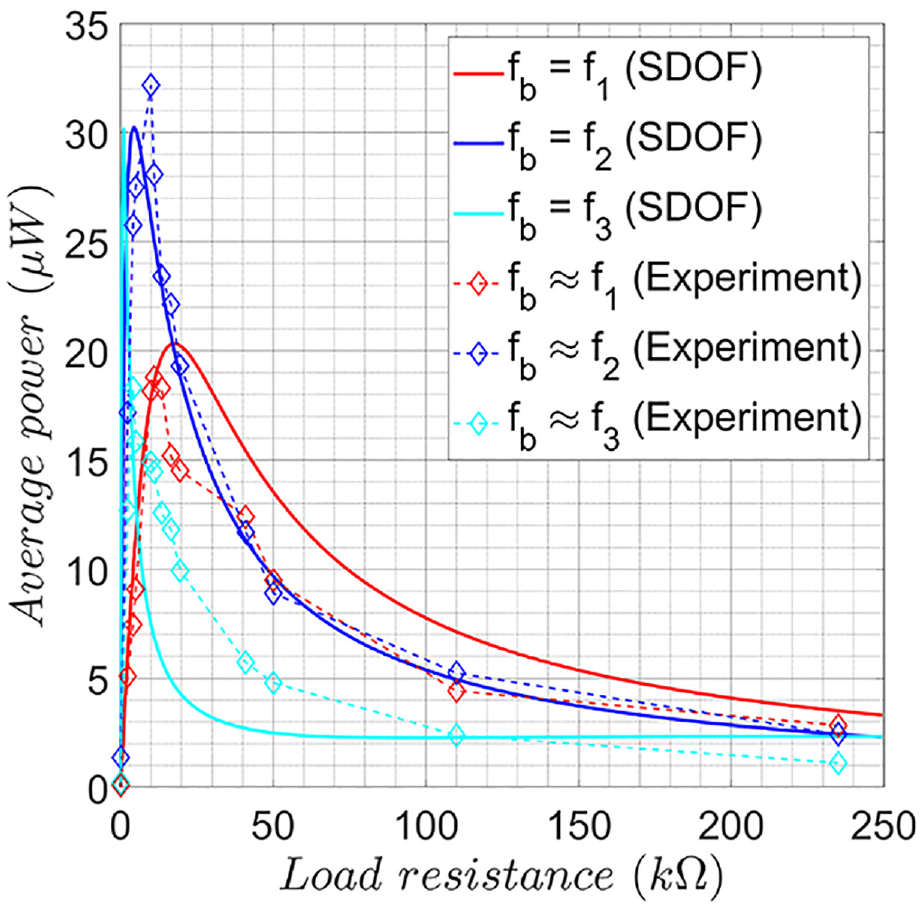
Comparison of average power across different load resistance values between the SDOF model and experiments.
From Figure 21, it can be noticed that the overall trend and the orders of magnitude obtained from the SDOF model solution are comparable to the experimental values. The same can be said for the
Comparison of
Effect of tuned beam frequency
3.7. Effect of resonance
The effect of resonance is demonstrated in Figures 24 and 25 for the second mode of oscillation. In Figure 24, the natural frequency of the beam,
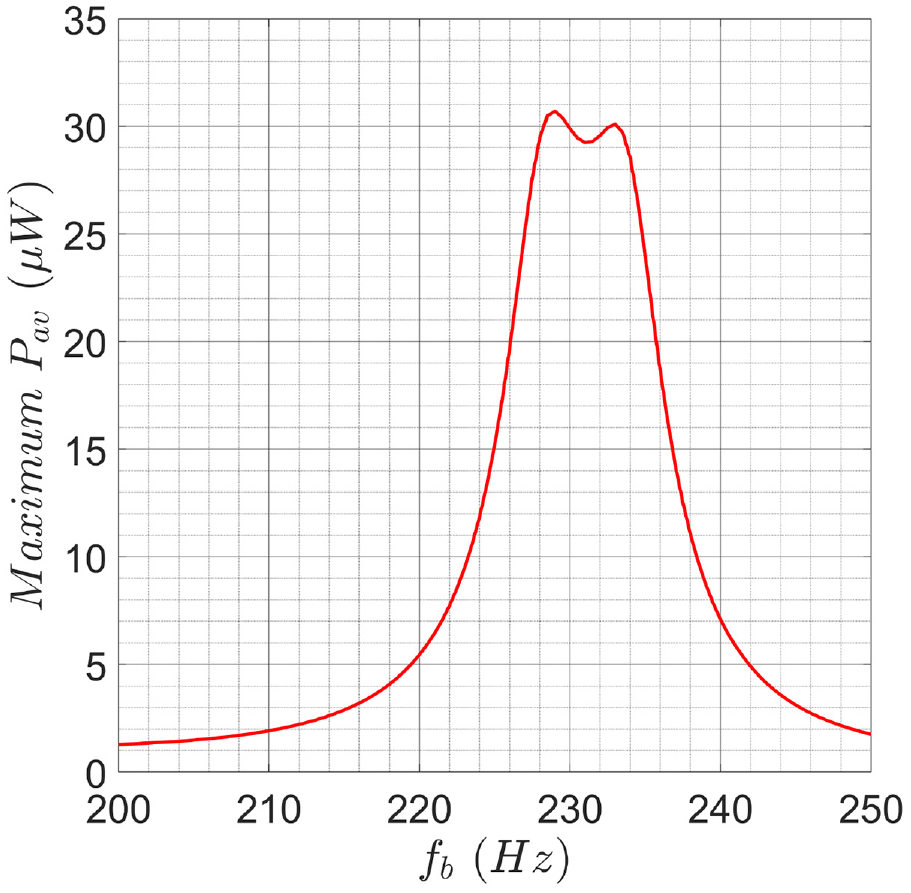
Variation of maximum average power with change in
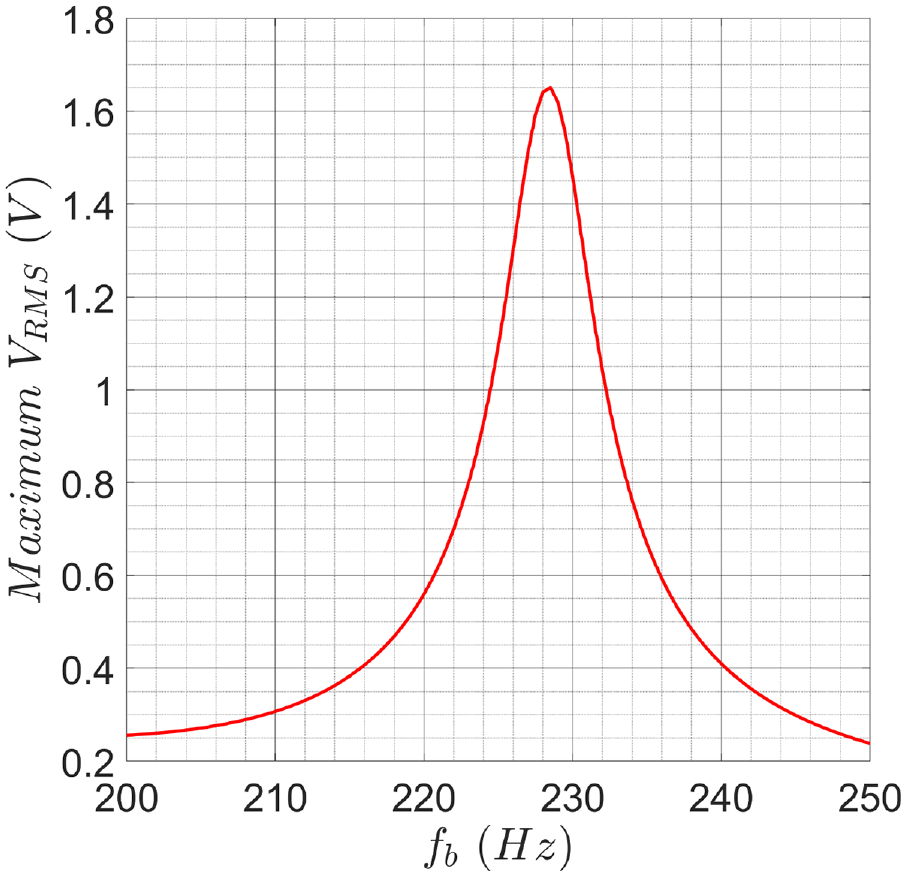
Variation of
3.8. Effect of incoming velocity
The effect of the incoming velocity on maximum
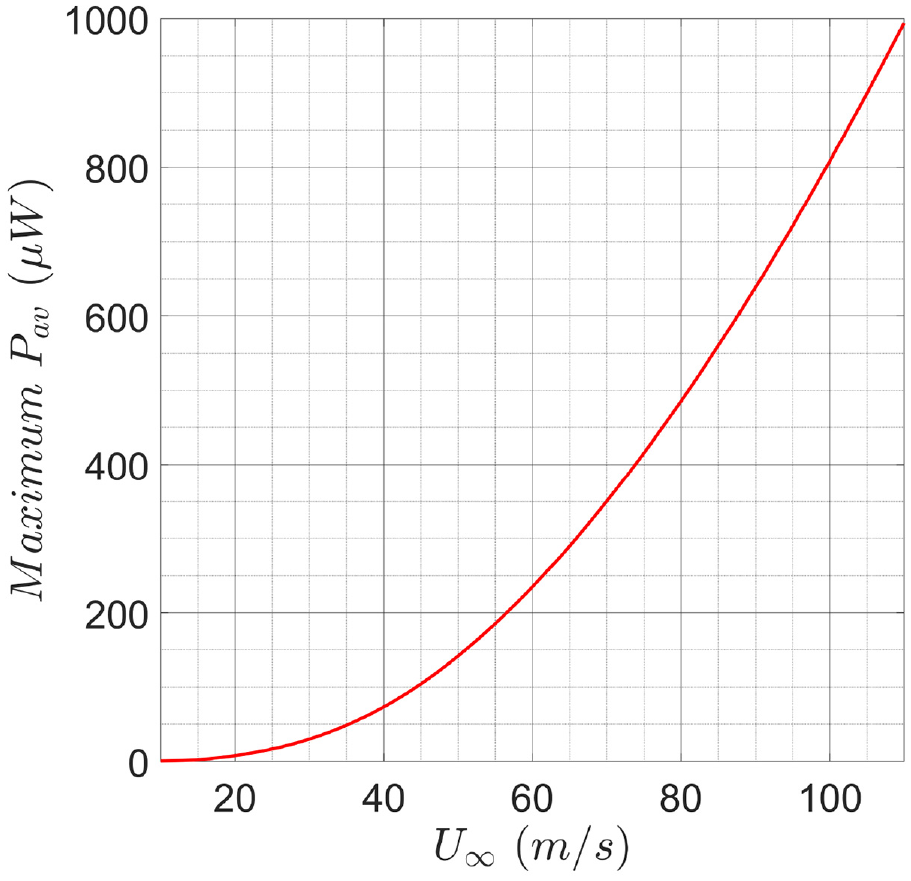
Variation of maximum average power with change in
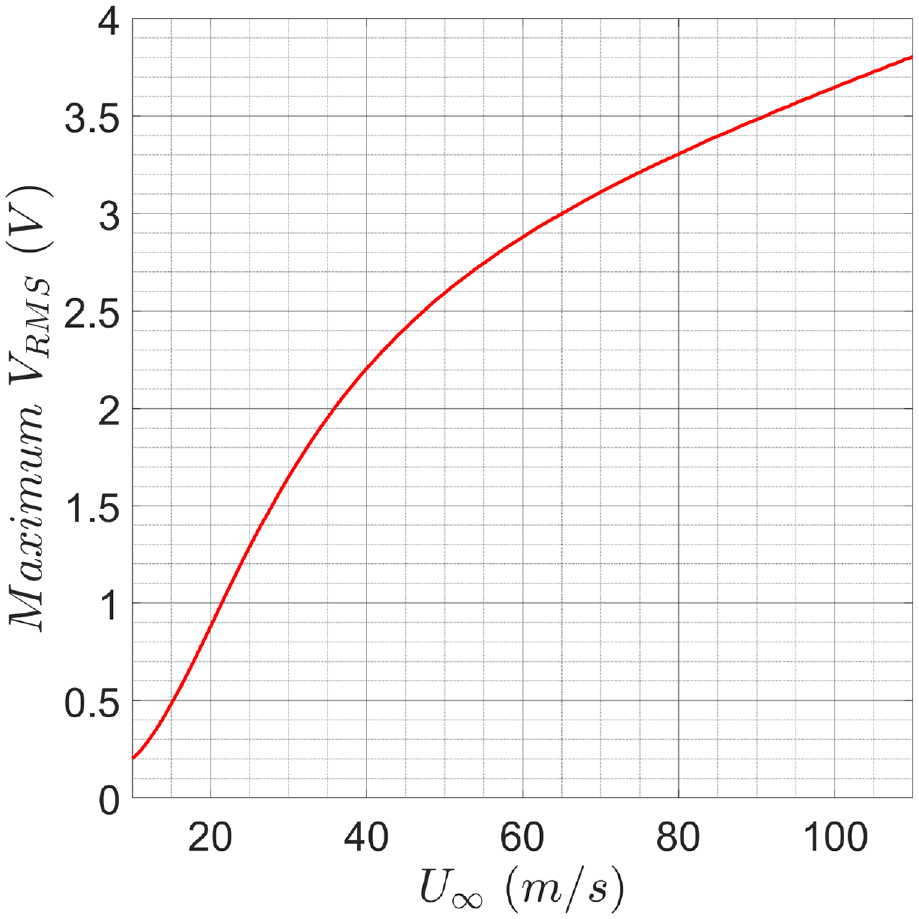
Variation of
Since the velocity of the beam tip
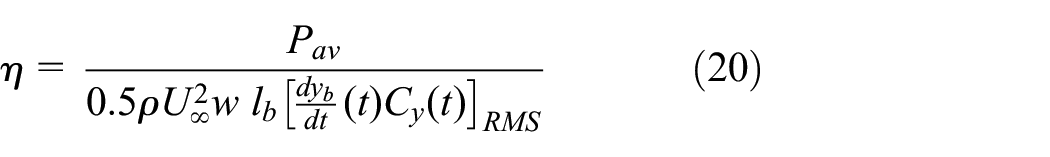
Using equation (20), the efficiency, at resonance conditions, for
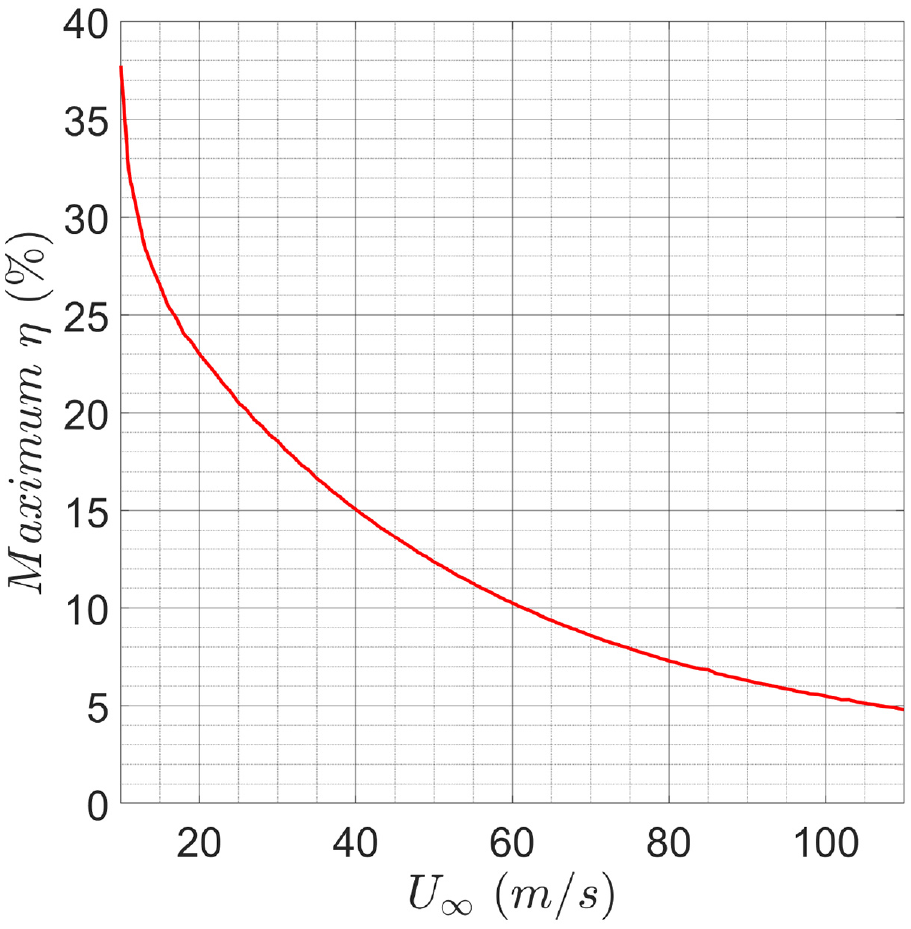
Variation of energy conversion efficiency (
3.9. Effect of cavity scale
The variation of maximum
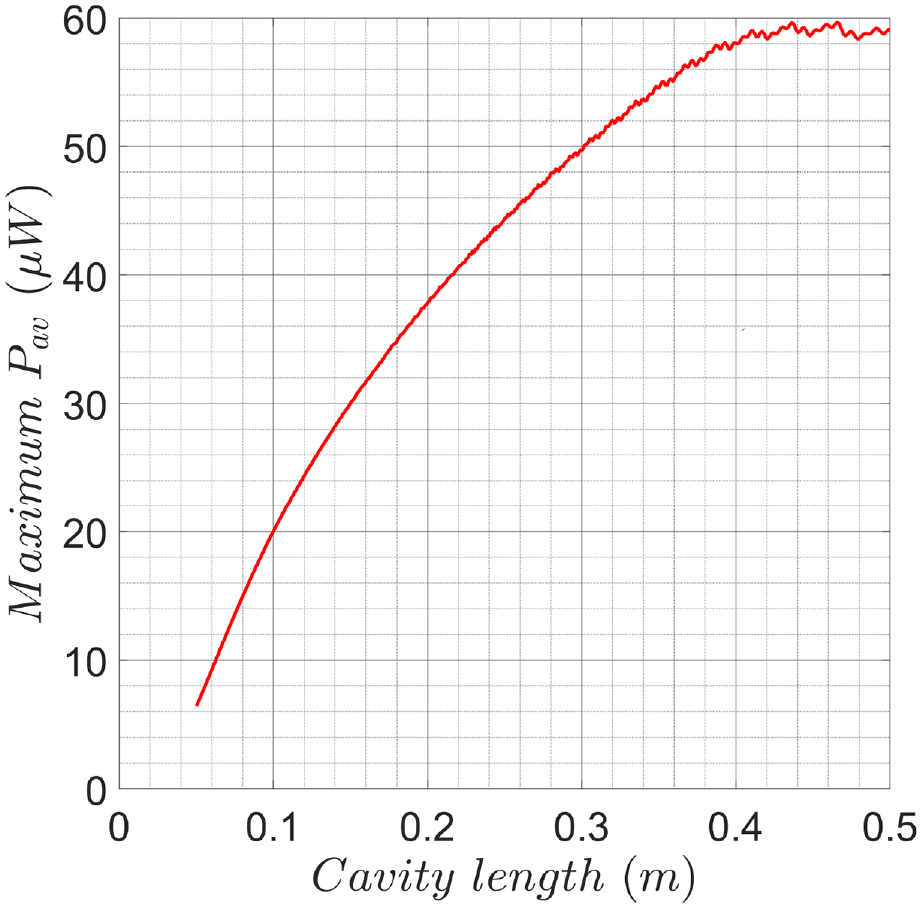
Variation of maximum average power with change in cavity size with
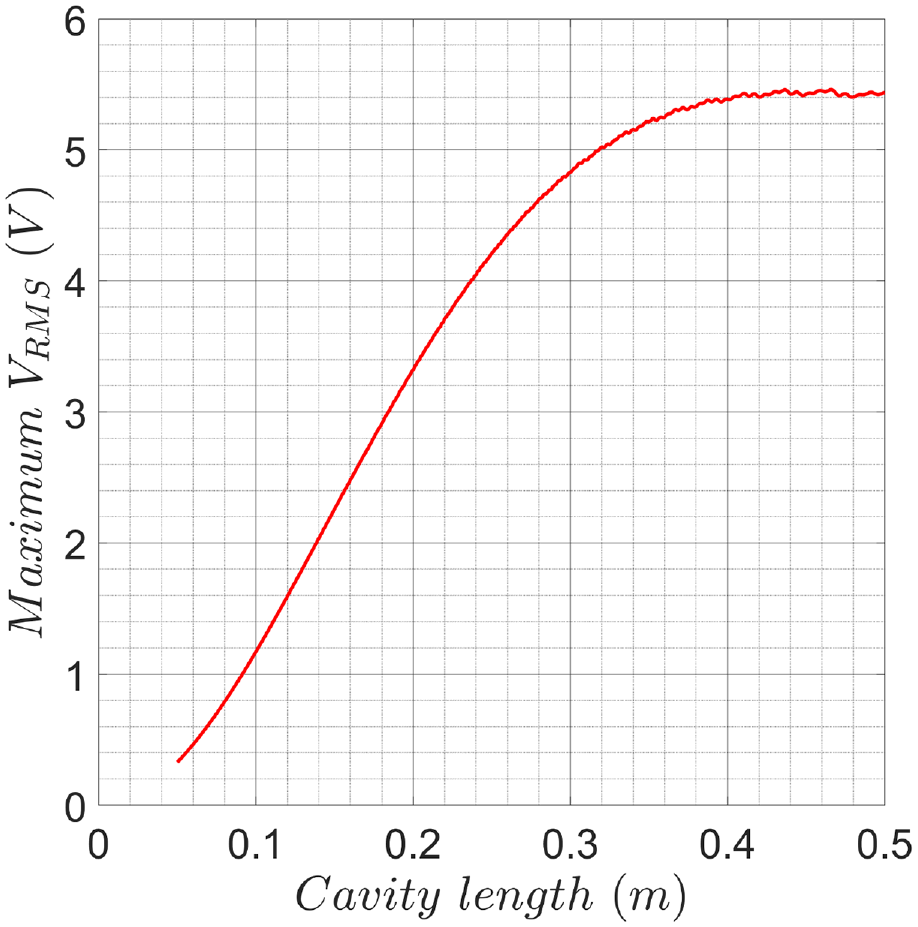
Variation of
The power generated from cavity flow oscillations can be increased by either increasing the velocity or by increasing the scale (cavity dimensions). If the incoming flow velocity is lower, the model’s scale can be increased to yield a higher power. As the wind tunnel used in the current studies restricted the usage of cavities larger than the present case, a higher velocity of 30 m/s was chosen to validate the SDOF model. A nominal wind velocity of 15 m/s should also be suitable for energy harvesting, provided the correct scale of cavity is used.
4. Conclusion
A single-degree-of-freedom model has been proposed to determine the average power harvested and RMS voltage generated by a piezoelectric beam placed in an unsteady cavity flow field that is generating self-sustaining flow oscillations. The model has been validated using experiments from a cavity of length-to-depth ratio of 2 and length 0.15 m, exposed to an incoming velocity of 30 m/s. The power spectral density plots of the transient pressure data from the cavity aft wall showed three peak frequencies corresponding to the first three modes of Rossiter oscillations. The value of the frequencies agreed well with Rossiter’s model for estimation of cavity flow frequencies. For the forcing term in the model, an empirical value was used for the different modes of oscillations. The model has been found to be reasonably accurate in determining the levels of power harvested and their trends with various flow and model parameters.
The results show a variation in average power harvested with load resistance with a maximum value corresponding to the achievement of matching between the electrical resonant frequency and mechanical oscillation frequency. The power generation trends varied slightly with the different modes of oscillations as a result of the varied temporal dominance of the different modes. The effect of resonance between the cavity flow frequency and the piezoelectric beam’s natural frequency was found to be significant. Having said this, it was found that the power generation was reasonably tolerant to the change in the tuned frequency of the oscillator with a 50% power retainment within a frequency bandwidth of 11 Hz for the dominant mode of oscillation. The effect of incoming flow velocity was also found to be significant wherein the harvested power increased quadratically with an increase in incoming flow velocity. However, the energy conversion efficiency of the piezoelectric beam showed an opposite trend with an increase in velocity. The cavity size was found to be not as influential over the power generated as the resonant frequency and flow velocity. While doubling the incoming flow velocity from 30 m/s caused an eight-fold increase in power, doubling the cavity size from 0.15 m increased the power by 1.5 times.
The results of the study indicate that a single-degree-of-freedom model can provide reasonable first estimates for a complex fluid-structure-electromechanical phenomenon like the energy harvesting from cavity flow oscillations. Limitations exist in describing the forcing term due to the absence of a reliable model for predicting amplitudes of pressure oscillations in a cavity flow and this gap has to be currently filled with empirical information. The resonant frequency of the piezoelectric oscillator, the incoming flow velocity and the cavity size are found to be key parameters that determine the power generated from the flow oscillations.
Footnotes
Appendix
Acknowledgements
We wish to gratefully acknowledge and thank the Government of Malaysia for supporting this work.
Declaration of conflicting interests
The author declared no potential conflicts of interest with respect to the research, authorship, and/or publication of this article.
Funding
The author disclosed receipt of the following financial support for the research, authorship, and/or publication of this article: This research was supported by the Ministry of Higher Education (MoHE), Malaysia, through the Fundamental Research Grant Scheme FRGS/1/2018/TK10/USMC/03/1.