
Abstract
We examine how machine learning (ML) predictions of high-growth enterprises (HGEs) help a budget-constrained venture capitalist source investments for a fixed size portfolio. Applying a design science approach, we predict HGEs 3 years ahead and focus on decision (not statistical) errors, using an accuracy measure relevant to the decision-making context. We find that when the ML procedure adheres to the budget constraint and maximizes the accuracy measure, nearly 40% of the HGE predictions are correct. Moreover, ML performs particularly well where it matters in practice—in the upper tail of the distribution of the predicted HGE probabilities.
Introduction
High-growth enterprises (HGEs) and their emergence have received considerable scholarly interest (see, e.g., Autio, 2007; Coad & Srhoj, 2020; Delmar et al., 2003; Hölzl, 2014; Kaiser & Kuhn, 2020; Megaravalli & Sampagnaro, 2019; Shane, 2009; Storey, 1994; van Witteloostuijn & Kolkman, 2019; Weinblat 2018). Venture capitalists (VCs), business angels, science and technology parks, and policymakers are particularly interested in the predictability of HGEs’ spells of rapid growth, because such predictions can serve as basis for future private and public investment decisions (e.g., Autio & Rannikko, 2016; Block et al., 2019) and as signals of the potential scalability of ventures (DeSantola & Gulati, 2017; Monaghan et al., 2020). While insightful studies have explored the statistical predictability of HGEs using machine learning (ML) methods (e.g., Coad & Srhoj, 2020; Kaiser & Kuhn, 2020; Weinblat, 2018), their analyses have not explicitly considered how ML algorithms can support decision-making in entrepreneurial contexts (for other contexts, see Athey et al., 2020; Glaeser et al., 2021; Kahneman et al., 2016). To advance the literature and to provide a more concrete analysis, we study how supervised ML methods can support VCs’ decision-making, with focus on what makes HGE predictions useful and relevant for their investment decisions. 1
Our main contribution is that we develop and tailor an ML procedure to consider how practitioners use predictions. First, we integrate a novel budget constraint into the ML prediction problem, focusing on the predictability of a small, prespecified number of HGEs. Such a focus has been overlooked in the prior entrepreneurship literature but is relevant in many contexts. Specifically, in our scenario, a VC is interested in identifying ex ante a relatively small number of the most likely HGEs or scale-ups, and not in how predictable HGEs are on average or on a larger scale. The same observation applies to a business angel and, with some modifications, to a science or technology park or, more generally, to an entrepreneurial support organization interested in attracting a limited number of firms to fill slots in its physical premises (see, e.g., Bergman & McMullen, 2022; Ng et al., 2019; Yin & Luo, 2018). Second, as is often done in modern data science applications (see, e.g., Ban & Rudin, 2019; Donti et al., 2017; Elmachtoub & Grigas, 2022) but less so in the entrepreneurship literature, we connect the ML predictions explicitly to decision-related errors (as opposed to statistical prediction errors, see, e.g., Bargagli et al., 2021). To this end, we advocate the use of positive predictive value (PPV; also known as precision) as the most appropriate accuracy metric for HGE predictions, because it measures the share of correctly predicted HGEs among all HGE predictions (i.e., the share of “hits”), thus bearing directly on the decision problems of VCs and business angels. This dependency of the accuracy measure on the context has not been considered in the prior HGE literature using ML methods (see, e.g., Coad & Srhoj, 2020; Kaiser & Kuhn, 2020; Weinblat, 2018), which tends to rely on other statistically motivated accuracy measures. Finally, we pursue a real-time, three-years-in-advance, HGE-forecasting task. Except for Weinblat (2018), the earlier papers focusing on out-of-sample HGE predictions split the datasets into training and testing samples in the same time window. By contrast, the split in our procedure is explicitly forward-looking and time-aware (Larsen & Becker, 2021), meaning that our HGE predictions only employ data that are available to a decision maker at the time predictions are generated. These three viewpoints are novel, especially so when considered jointly, because they shift attention away from the general statistical predictability of HGEs and bear directly on the practical relevance of HGE predictions and ML in entrepreneurship research (see Lévesque et al., 2022; Wiklund et al., 2011). 2
Our study builds upon scholarly work on (i) how and why certain firms survive and grow, whereas others shrink and exit (e.g., Abootorabi et al., 2021; Coad, 2009; Coad et al., 2016; Davidsson et al., 2010); (ii) whether firm growth is nearly random (e.g., Coad et al., 2013; Derbyshire & Garnsey, 2014; Schneck et al., 2021; Soto-Simeone et al., 2021); and (iii) the predictability of rapid growth and HGEs (e.g., Coad & Srhoj, 2020; Coad et al., 2014; Henrekson & Johansson, 2010; Weinblat, 2018). We also refer to studies using ML methods to explore ventures’ performance (e.g., Barboza et al., 2017; Blohm et al., 2022; Guzman & Stern, 2020; Kaiser & Kuhn, 2020; McKenzie & Sansone, 2019; Megaravalli & Sampagnaro, 2019; Miyakawa et al., 2017; Sharchilev et al., 2018; van Witteloostuijn & Kolkman, 2019; see also Bargagli-Stoffi et al., 2021). We add to the prior literature by addressing a new question, that is, how accurately can ML methods—tailored to deliver a small number of predictions—identify HGEs. This question is worth addressing because according to Coad and Srhoj (2020, p. 541), “prediction remains a challenging exercise” even when ML methods are used.
More generally, this paper advances two broader ongoing conversations in entrepreneurship literature. First, inspired by the recent proposals to adopt design as a novel mode for research in entrepreneurship (Berglund, 2021; Berglund et al., 2018, 2020; Dimov, 2016; Ding, 2019; Holloway et al., 2016; Hyytinen, 2021; Romme, 2016; Romme & Reymen, 2018; Sarasvathy, 2003, 2004; van Burg & Romme, 2014; Venkataraman et al., 2012), this study illustrates how adopting a design science perspective can be combined with ML to address and solve practical prediction problems. 3 When a practical problem contains an empirical element that is potentially solvable using quantitative methods, ML is a possible tool that can be used to solve it. Indeed, our empirical approach was initially inspired by a discussion with a Nordic venture capital firm on the use of supervised ML in deal sourcing. We recognized after this discussion that aside from a few isolated exceptions (e.g., Blohm et al., 2022; Hunter et al., 2017; Krishna et al., 2016), we could not rely on prior entrepreneurship research to address the practitioner’s needs. 4
Second, our analysis is a response to the recent calls to leverage ML methods in entrepreneurship (e.g., Lévesque et al., 2022; Maula & Stam, 2020; Obschonka & Audretsch, 2020; Schwab & Zhang, 2019; Wennberg & Anderson, 2020). The available entrepreneurship literature has not explicitly considered situations in which ML algorithms are supposed to generate predictions that a decision maker can use in real time. We adopt this viewpoint because it connects our analysis to recent studies on how algorithms can support human decision-making (e.g., Agrawal et al., 2018, 2019; Athey et al., 2020; Choudhury et al., 2020; Cowgill & Tucker, 2019; Elmachtoub & Grigas 2021; Glaeser et al., 2021) and to debates on whether ML complements or substitutes human expertise (e.g., Acemoglu & Autor 2011; Agrawal et al., 2019; Autor and Handel 2013; Autor et al., 2003; Dushnitsky & Matusik, 2019; Raisch & Krakowski, 2021). Human–machine collaboration can mean augmentation (as in Raisch & Krakowski, 2021) and result in hybrid intelligence (as discussed in, e.g., Antretter et al., 2020; Blohm et al., 2022; Dellermann et al., 2019).
Literature Review
This study uses ML methods to predict a small number of HGEs 3 years in advance, which is viewed as a design science problem aimed at providing decision-context-specific inputs. Taking this as the starting point, we summarize the available literature on firm growth and HGEs.
Predictability of Firm Growth and the Emergence of HGEs
The topic of—how and why certain firms survive and grow while others shrink and exit—has been extensively studied in the fields of management (e.g., Gilbert et al., 2006; Lewis and Churchill, 1983), economics (e.g., Arkolakis, 2016; Evans, 1987a, 1987b; Luttmer, 2011), and entrepreneurship (e.g., Coad, 2009; Coad et al., 2016; Davidsson et al., 2010). According to the extant literature, firms that grow fast without first securing a level of profitability may be less successful (Davidsson et al., 2009), the paths to high growth are greatly heterogenous (Delmar, et al. 2003; McKelvie & Wiklund, 2010), skewed and non-normal distributions characterize the growth of both small and young firms (Crawford et al., 2015), and high growth reverts back to the mean (i.e., a spell of rapid growth is not followed by another period of rapid growth, see Hölzl, 2014). 5
Several studies have also explored the predictability of (rapid) firm growth. Earlier studies have documented that the available predictors of firm growth have low within-sample explanatory power (R2) in conventional regressions (see, e.g., McKelvie & Wiklund, 2010) and that episodes of rapid growth are difficult to predict (Delmar et al., 2003; Grover Goswami et al. 2019; Henrekson & Johansson, 2010; Mason & Brown, 2013; McKenzie, 2017). Some empirical findings support the theoretical accounts suggesting that firm growth almost follows a random process (see Derbyshire & Garnsey, 2014; Coad et al., 2015, for a debate). While the reasoning and arguments differ, some go as far as claiming that “. . . growth paths occur in approximately random fashion” from a statistical viewpoint (Coad et al., 2013, p. 623) and that “prediction [is] impossible” (Derbyshire & Garnsey, 2014, p. 11). At the very least, growth paths are “erratic” (Schneck et al., 2021), and a major part of growth is due to chance events beyond a firm’s control. However, the literature also suggests that firms have resources and skills at their disposal that allow them to influence market outcomes and pursue growth systematically (e.g., Soto-Simeone et al., 2021; Zupic & Drnovsek, 2014).
A few papers in entrepreneurship have studied the out-of-sample predictability of HGEs. The conclusion of Coad et al. (2013, p. 616, our underlining) that there is “. . . an absence of papers prepared to even attempt to forecast the
More broadly, our work relates to studies that use ML methods to model the emergence, survival, and performance of firms. Such studies include those of Barboza et al. (2017), which predicts bankruptcy 1 year prior to the event; Guzman and Stern (2020), which studies quantity and quality entrepreneurship across U.S. states; Kaiser and Kuhn (2020), which investigates the value of publicly available textual and non-textual information in predicting startup performance; McKenzie and Sansone (2019), which considers the performances of scores given by business plan competition judges vis-à-vis statistical approaches; Megaravalli and Sampagnaro (2019), which explores the predictability of family firms’ rapid growth; Miyakawa et al. (2017), which contrasts the predictive performances of a credit rating agency and ML; Sharchilev et al. (2018), which looks at seed- or angel-funded startups’ ability to secure further funding in the next year; and van Witteloostuijn and Kolkman (2019), which uses the random forest approach to predict the year-to-year growth rate of total assets. The degree of predictability seems to vary greatly depending on what is being predicted, with rapid growth and becoming HGEs among the least predictable outcomes. Bargagli-Stoffi et al. (2021) provide further details of this literature, confirming that none of the earlier ML papers studying HGEs is a design science study that links HGE predictability to a specific decision-related context (in the way our paper does).
Design as a Mode of Research
The design mode of research is forward-looking and studies objects and systems that do not yet exist, to create solutions and artifacts with practical applications in mind (Dimov, 2016; Niiniluoto, 1993; Romme, 2003; Simon, 1996). 6 A design task identifies a goal or a problem (A), characterizes the context (B), and finds a tool or solution (X), as captured in the following quote: “If you wish to achieve A, and you believe you are in a situation B, then you should do X” (Niiniluoto, 1993, p. 1). Knowledge of A, B, and X helps in bridging the gap between scholarship and practice in entrepreneurship, because it shows us “how to do it” (Dimov et al., 2021; Kapasi & Rosli, 2020), at least in principle (for practical challenges, see Duflo, 2017, 2020).
The extent to which design-oriented research involves engaged scholarship varies. In one extreme, there is no direct practical involvement. For example, in their design-motivated study, Sagath et al. (2019) recognize a lack of understanding of how business incubators work (problem, A) in a sector (context, B), and then identify a set of actionable incubator design principles (solution, X). The study by Lopez et al. (2019) differs in that the authors describe how a research-based biotech venture adopted a design-oriented approach to formulate and frame the opportunity that the venture faced (problem, A), to understand the socio-technical nature of the opportunity and the associated data privacy concerns (context, B) and search for a viable business model (solution, X). Other design-focused studies in entrepreneurship involve more engaged scholarship. For example, the design study of Muñoz and Cohen (2018) is based on a long-term research project that involved substantial interaction with practitioners. At the beginning, the authors uncovered a challenge in how entrepreneurs create business models (problem, A) in a sharing economy (context, B) and then developed, in collaboration with practitioners and firms, a tool (solution, X) that allows delineating the key ingredients of such a business model. The study by Camuffo et al. (2020) is yet another example of engaged scholarship, investigating how entrepreneurs collect and use information when making decisions (problem, A) at the start-up phase (context, B) and developing a science-based framework that early-stage entrepreneurs can use to predict and evaluate the performance of a business idea (solution, X).
To our knowledge, no earlier study on the predictability of HGEs has been framed as a design science problem. As we explain next, we study how accurately we can identify a small number of HGEs ex ante (problem, A) from the perspective of a VC that has a predetermined investment budget (context, B), by proposing a tailored ML procedure that respects the VC’s budget constraint and relies on an accuracy measure that matches the investment goal (solution, X). In this design science context, ML techniques enable generating “X”, that is, finding the solution.
Decision Context and Empirical Approach
Decision Context
We consider the viewpoint of a VC with a fixed amount of capital available for investment facing a deal-sourcing problem. We interpret predictable rapid growth as a signal of the potential scalability of a venture’s business model (e.g., DeSantola & Gulati, 2017), which is an important investment criterion for venture capital investors (e.g., Block et al., 2019; Ewens et al., 2018; Gompers et al., 2020; MacMillan et al., 1985). One reason for this is that sales growth is a driver of discounted cash flows and thus, represents a venture’s long-term valuation. Research suggests that identifying “hits” or “scale-ups” in real time is difficult and time-consuming, even for experienced VCs (e.g., Gompers et al., 2020; Kerr et al., 2014). The idea that ML algorithms can support human expertise and decision-making fits well with VC investing because deal sourcing is essentially a prediction task—it is about being able to identify ex ante the most promising investee firms using currently available information.
The decision context calls for incorporating three elements into our ML approach. First, to include the VC’s budget constraint, we consider the predictability of a prespecified (small) number of HGEs. For example, a typical VC firm in the United States has two funds, with each fund investing in approximately 20 ventures (NVCA, 2022). The corresponding figures for Finland are comparable. 7 As we explain below, we factor in the budget constraint by tailoring our ML procedure to respect the decision-making context and the nature of the data. Second, we use PPV as the accuracy metric to be maximized because it directly measures the share of correctly predicted HGEs among all HGE predictions, fitting the VC’s investment goal(s). The underlying rationale is that the expected return on VC investments depends on the likelihood of the investee firms becoming HGEs. Finally, we predict HGEs 3 years in advance. To produce forecasts that are time-aware (i.e., usable in real time), the empirical procedure cannot peek into the future or use data that are not yet available when the decision is made. Our interest is in the predictive accuracy as measured by PPV, which is calculated and evaluated using out-of-sample data. Figure 1 summarizes these elements of the decision context.

A forward-looking design science problem.
Next, we explain how we combine the budget constraint with our accuracy measure. Thereafter, we explain our data and why and how our ML procedure is time-aware and forward-looking.
Measuring Predictive Accuracy: The Budget–PPV Curve
Judging how good predictions are is a matter of degree, that is, whether they are accurate enough to be useful in a particular decision-making context. Unlike prior studies predicting HGEs, we emphasize that the quality of a prediction should be measured using a decision-related error (as opposed to a statistical error such as the mean squared error or pseudo R2), meaning that the metric mirrors the decision context (e.g., Elliott & Timmermann, 2016; Granger & Machina, 2006; Lahiri & Yang, 2013).
HGE predictions are binary, implying that the predictive performance of a model can be fully captured by the confusion matrix (see Table 1). The table columns correspond to realizations (HGE = 1 or HGE = 0) and the rows to predictions (HGE* = 1 or HGE* = 0). For true positives (TP), the prediction matches the realization (HGE* = HGE = 1), and likewise for true negatives (TN; HGE* = HGE = 0). For false positives (FP), rapid growth is predicted but does not materialize (HGE* = 1, HGE = 0), and vice versa for false negatives (HGE* = 0, HGE = 1). In the table, P and N (P* and N*) refer to the actual (predicted) numbers of HGEs and non-HGEs, respectively, in the relevant data.
Confusion Matrix Fully Capturing the Possible Outcomes of a Binary Prediction Problem.
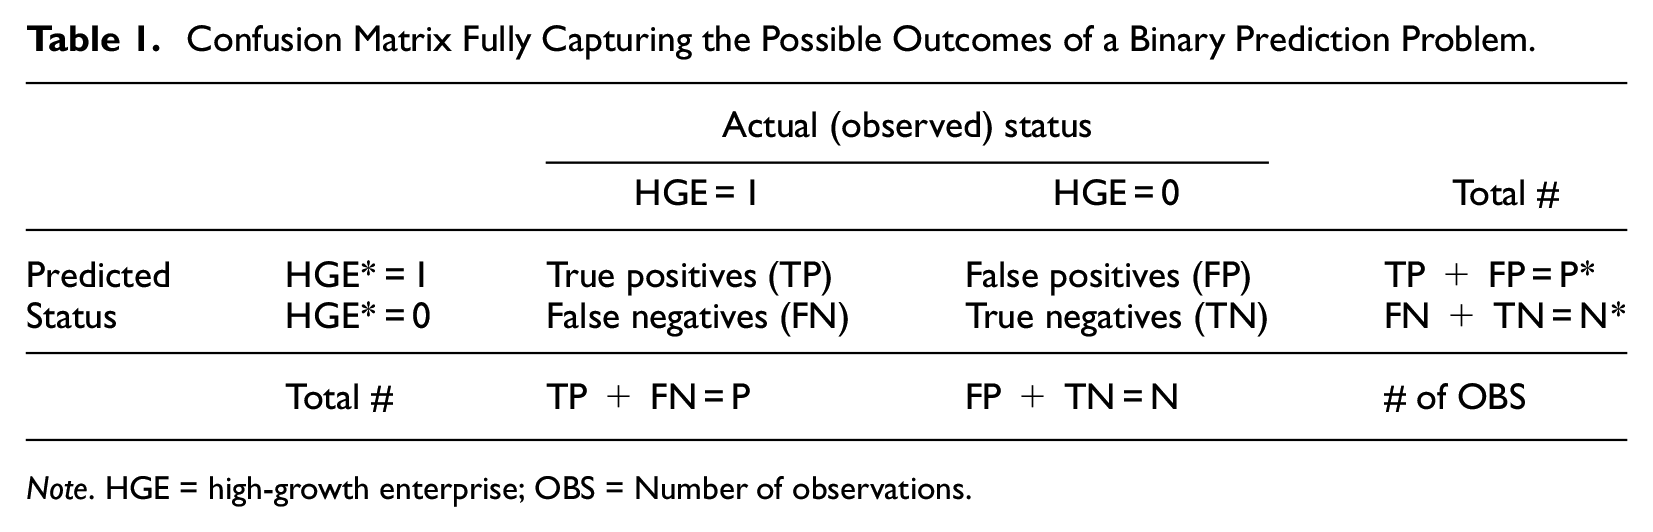
Note. HGE = high-growth enterprise; OBS = Number of observations.
We can use Table 1 for a precise definition of PPV because it is equal to the share of HGEs (HGE = 1) among the firms for which a high-growth prediction (HGE* = 1) is issued. Mathematically, PPV = TP/P*; thus, the higher the share of correctly predicted HGEs (TP) among all positive predictions (P*), the better the predictive performance, implying greater precision. For a VC, PPV refers to the likelihood of hits among the set of investee companies. Because a VC is interested in having a high share of true HGEs (HGE = 1) among the firms predicted to be HGEs (HGE* = 1) and because the VC’s investment decisions must respect a budget constraint, we propose using a novel budget–PPV curve. The curve plots PPV on the vertical axis against the fraction of ranked predicted probabilities of each firm becoming a HGE (i.e., the screening budget) on the horizontal axis, with PPV calculated recursively, starting from the firm with the highest predicted probability.
Here the budget refers to the fraction of the firms considered eligible and relevant for deal sourcing. The budget available in each decision context determines the fraction of the highest-ranked firms that are picked by the procedure (“how many of the most likely HGEs obtain VC financing”). For example, if the budget allows financing 3% of the relevant firm pool, then the procedure picks all the firms whose predicted probability is higher than the 97th percentile of the distribution of the predicted probabilities. As we will show, the procedure focuses on the subset of “the most likely HGEs” in which practitioners facing budget constraints are typically most interested. Because a budget is an economic constraint (and not a statistical concept), we can think of it as being an extra-statistical feature that is incorporated into the accuracy measure. 8
Future growth prospects are something that capacity-constrained VCs constantly think about when sourcing deals into their portfolios (e.g., Gompers et al., 2020): The budget–PPV procedure allows approximating this relevant feature of the VCs’ decision framework. Moreover, selecting a small set of firms that are likely to grow rapidly (as the budget–PPV procedure allows) can be seen as the first screening phase, after which they can be screened further by, for example, a human expert. 9 Notably, the constraint can be more complex. For example, it can include additional criteria such as size, industry, location, human capital, or investment size (such extensions are beyond the scope of this study, but we discuss them briefly later).
Data
Our data combines the official Business Register of Statistics Finland, the financial statements database of Suomen Asiakastieto Oy, and the Finnish Venture Capital Association’s (FVCA) records on companies receiving private equity investments. The merged data result in a panel of privately-owned limited liability companies covering years 2005–2018. After excluding firms with fewer than 10 employees, forming appropriate lagged predictors, and data cleaning and splitting, our sample includes two prediction windows for training (first years = 2009 and 2010), one for validation (first year = 2011), and one for testing (first year = 2015). Together, these windows include 12,590 unique firms and 29,839 firm-year observations. Our baseline sample covers 62% of the relevant firm population in Statistics Finland’s official business registry (see Online Appendix A).
When identifying HGEs, we measure growth using turnover (“turnover HGE”). Our baseline analysis employs the standard Eurostat-OECD definition for HGEs (OECD, 2007, p. 61): Provided that a firm has at least 10 employees in the initial period, HGE = 1 if a firm’s average annualized growth is greater than 20% p.a. over a 3-year period, and HGE = 0 otherwise. The proportion of (ex-post) turnover HGEs in our total sample is approximately 9.3%. The previous literature has also considered growth in employment, but the relevant outcome variable depends on the decision context. While turnover may be more volatile (Davidsson et al., 2009), it is a more direct measure of business model scalability and thus, of particular interest to VCs. Changes in employment may be more informative of more permanent changes in firm organization (Garnsey et al., 2006). As we report later, we re-run all our analyses using alternative HGE indicators from Weinblat (2018) and Coad and Srhoj (2020) to illustrate the robustness and comparability of our findings.
In addition to 20 industry and 16 region indicators, we use the following predictors (see, e.g., Coad & Srhoj, 2020; Davidsson et al., 2010; Megaravalli & Sampagnaro, 2019; Storey, 1994): age, employment, past employment growth, productivity, past productivity growth, foreign ownership, number of places of business, group membership, profitability of industry (top decile gross margin, median gross margin), number of European Patent Office patents, foreign subsidiaries, export status, CEO age, CEO gender, operating result (earnings before interest and taxes), equity/assets, tangible assets/revenue, and rating (credit score). We also use indicators for whether the firm has received VC financing. See Online Appendix A for exact definitions and Online Appendix E for the descriptive statistics.
Time-Aware ML Modeling
Supervised ML methods are data-driven techniques for generating accurate predictions in unseen samples. After an extensive literature search and empirical experiments, we decided to use a small but diverse set of commonly used ML models—summarized in Table 2 (see Online Appendix B for details and Online Appendix C for implementation issues; see also ; Choudhury et al., 2020; Efron & Hastie, 2016; Hastie et al., 2009)—from which we choose the best performing model.
ML Methods for Choosing the Best Performing Model.
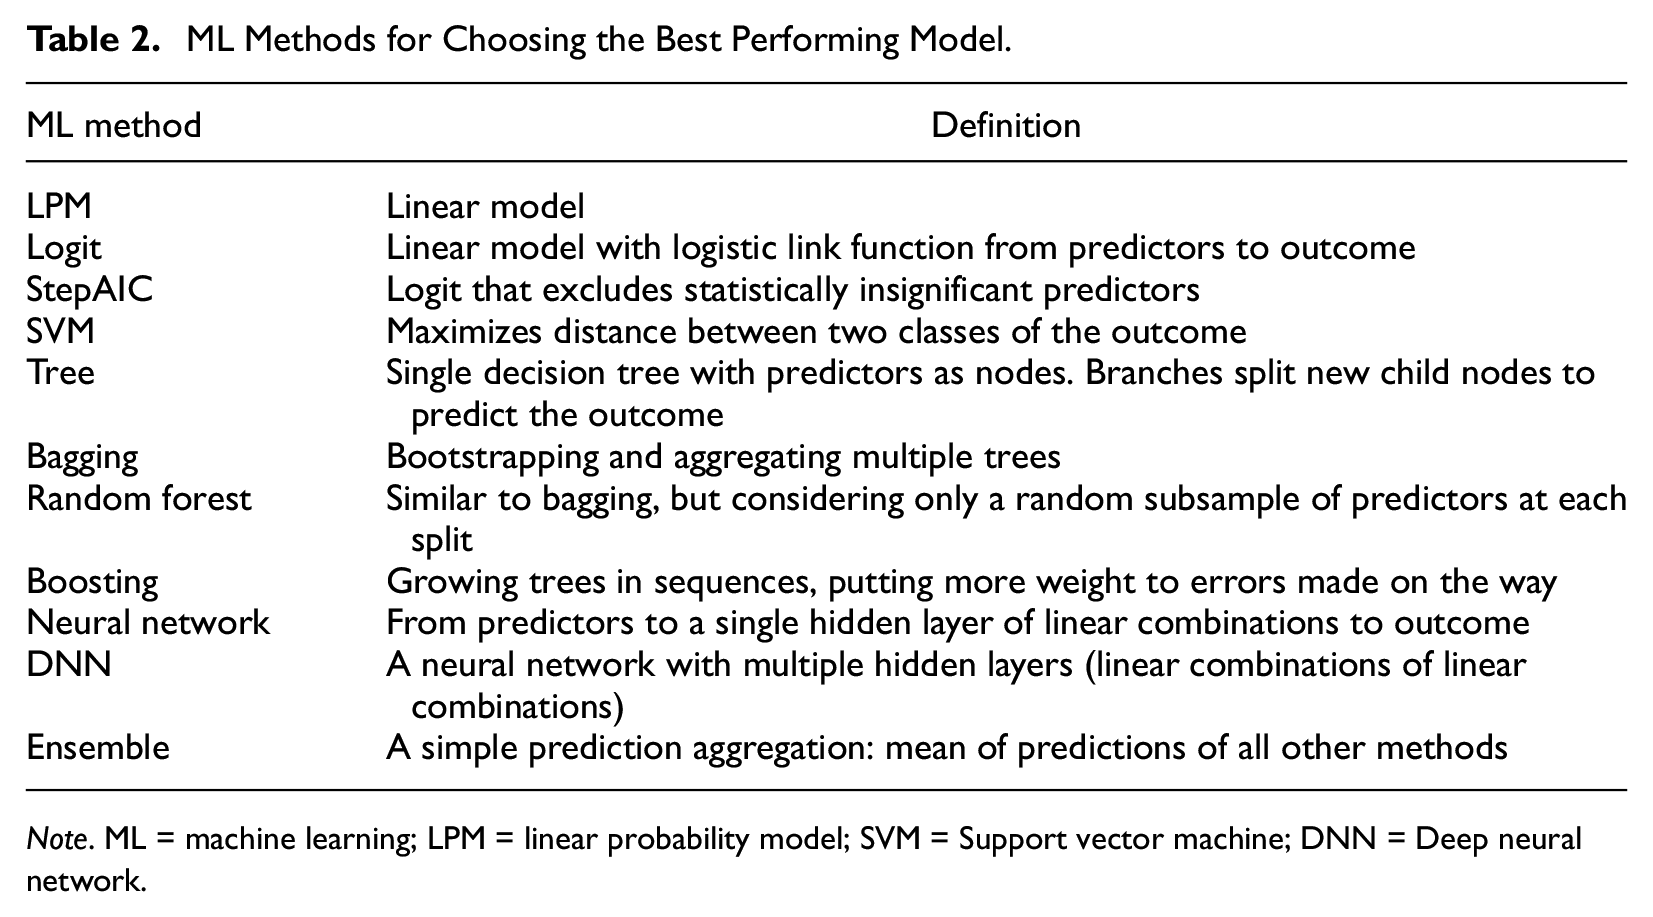
Note. ML = machine learning; LPM = linear probability model; SVM = Support vector machine; DNN = Deep neural network.
To reduce researcher degrees of freedom (Anderson et al., 2019), we use a transparent procedure to select and evaluate the best performing ML algorithm. We divide our data into training (13,488 firm-year observations), validation (7,454 firm-year observations), and testing (8,897 firm-year observations) samples and implement a standard validation set approach (e.g., James et al., 2013). The training sample is first used to tune and train each of our ML models. Then, the validation sample is used to choose the best performing ML model by comparing the areas under the budget–PPV curves. Based on this procedure, random forest performs the best. The best model is then retrained using a sample that combines the training and validation samples. Finally, the true ex ante predictive accuracy (i.e., PPV) of the selected method is evaluated for each level of the budget in the held-out test sample. To account for sampling uncertainty, we bootstrap this final stage using 20,000 draws from the test sample and report the means. This ensures that our findings are not based on just a single draw from the test sample (see Efron & Tibshirani, 1993).
Figure 2 illustrates the time awareness of our procedure. The best performing ML model is trained and chosen based on data up to 2014. In the test sample, we predict the HGE outcomes in 2015–2018, using suitably lagged predictors in 2011–2014. This procedure corresponds to a real-time forecasting scenario that a decision maker could have faced at the end of 2015 (with data up to 2014). Our procedure neither peeks into the future when choosing the best ML model nor uses data not yet available when generating the out-of-sample forecasts.
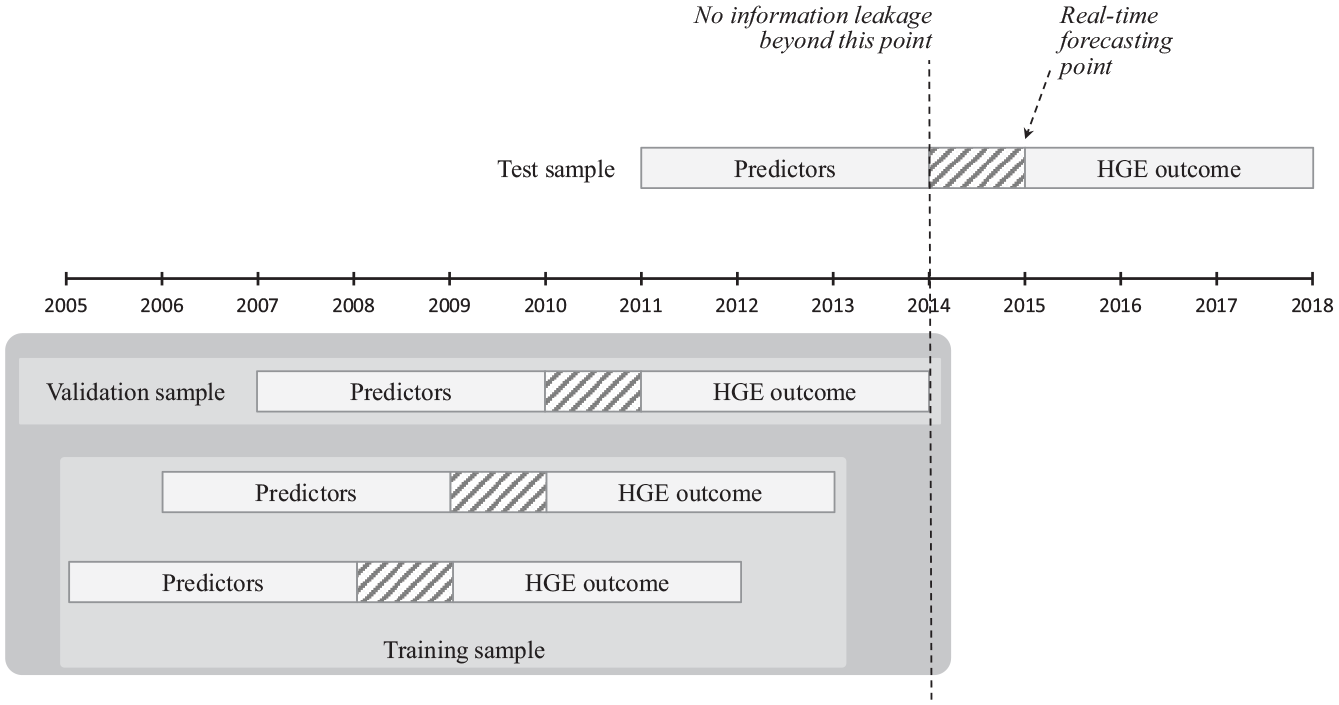
Timing of the training, validation, and testing of samples (a time-aware data split).
Results
We report three sets of findings. First, we report our main results, viewing human expertise and ML as substitutes, and document how well our ML procedure predicts HGEs ex ante (“without human involvement in deal sourcing”). Second, applying a calibration approach to the main results, we report auxiliary results that allow viewing human expertise and ML as complements. Finally, we present a set of robustness analyses and highlight how our findings compared with those reported in the literature.
Main Results: Viewing Human Expertise and ML as Substitutes
Our design science problem is as follows: How accurately can we predict HGEs 3 years in advance (problem, A) from the perspective of a VC whose predetermined budget allows 1–4% financing of the potential investee firms (context, B) and who uses the budget–PPV curve with ML to determine which firms to pick (solution, X). In other words, our main analysis explores how well ML technology can substitute for human expertise in VC deal sourcing.
Table 3 reports the main results, obtained using the budget–PPV curve and the random forest method (chosen as the best method in validation). We report three benchmark PPVs for comparison, based on (i) a linear probability model (i.e., a linear regression with the same covariates and estimated by ordinary least squares), (ii) the share of HGEs among firms that received VC investments in our test sample (proxying how accurately VCs identify HGEs ex ante), and (iii) a naive classifier (using a Bernoulli distribution with a probability parameter value that results in the desired number of firms). We display the results for a prespecified VC budget of 1, 2, 3, and 4% (out of the 8,897 firms in the test sample).
Main Results (Viewing ML and Human Expertise as Substitutes).
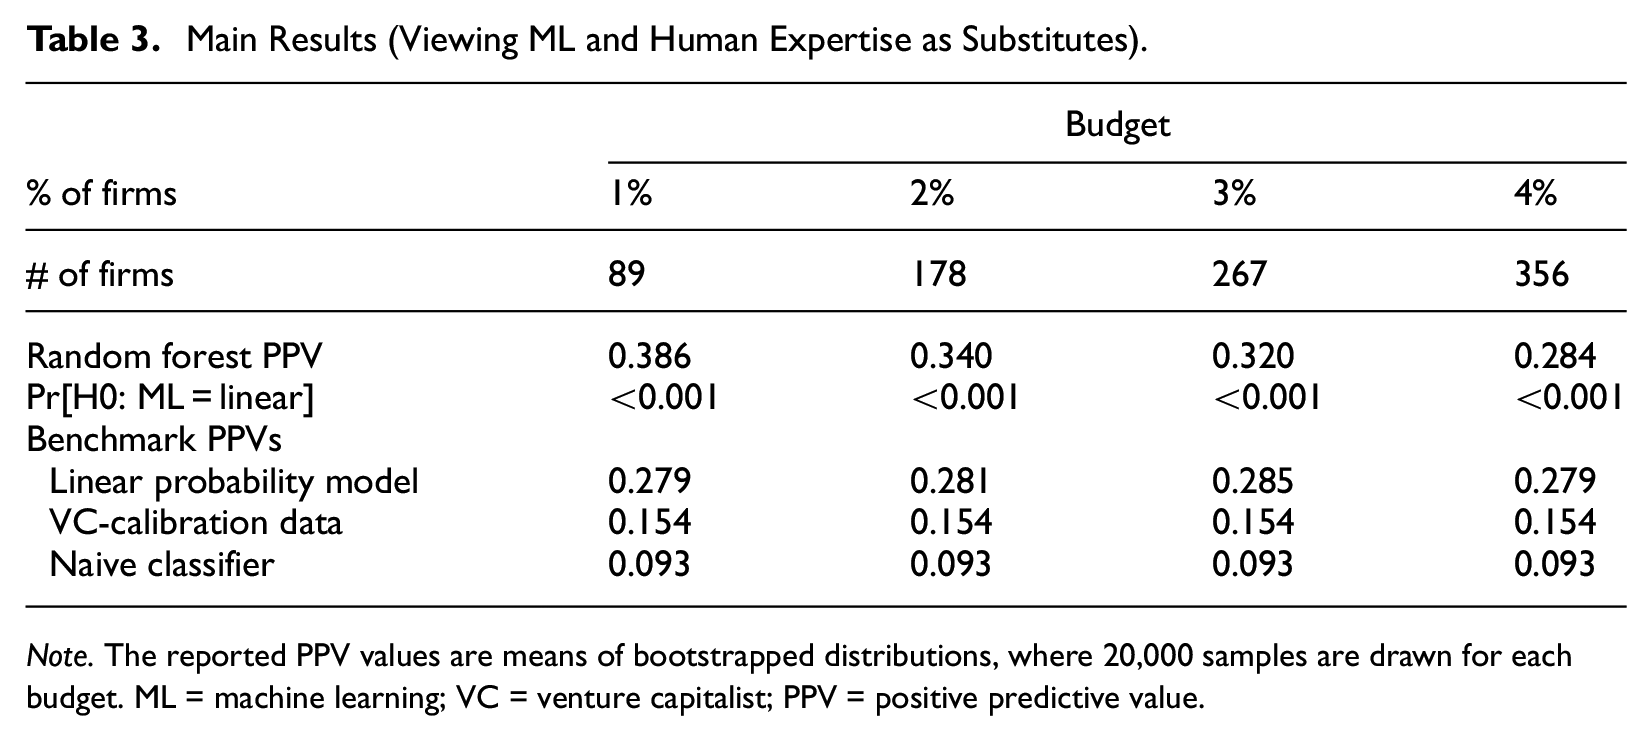
Note. The reported PPV values are means of bootstrapped distributions, where 20,000 samples are drawn for each budget. ML = machine learning; VC = venture capitalist; PPV = positive predictive value.
The results reported in Table 3 reveal that first, our ML approach outperforms the three benchmarks by a clear margin in terms of PPV. 10 Second, despite the procedure never peeking into the future and genuinely predicting HGEs 3 years in advance, the tightest budget of 1% results in a relatively high PPV of 38.6%. The larger budgets of 2, 3, and 4% achieve slightly lower PPVs of 34.0, 32, and 28.4%, respectively. Whereas the decrease in PPV for larger budgets is worth noting and possibly of interest to practitioners, these PPV values are—as far as we know—the highest reported in the HGE literature; we report below a direct comparison to Weinblat (2018) and Coad and Srhoj (2020) using the alternative HGE outcome variables they use.
Figure 3 illustrates the results graphically, displaying the out-of-sample budget–PPV curves. Because the curve ranks the firms in terms of their predicted HGE probabilities, those with higher predicted probabilities are on the left of the horizontal axis. The associated PPV values on the vertical axis are calculated cumulatively, starting from the firm with the greatest predicted probability. Figure 3 shows that the budget–PPV curve for the random forest lies above that of the three benchmarks, especially on the left of the figure, mirroring the superior ability of ML to capture non-linearities in the upper tail of the distribution of the predicted probabilities. This is an important finding because it means better predictive ability for the subset of firms in which practitioners with budget constraints are typically most interested. Our budget–PPV curve zooms into this subset of firms by design.
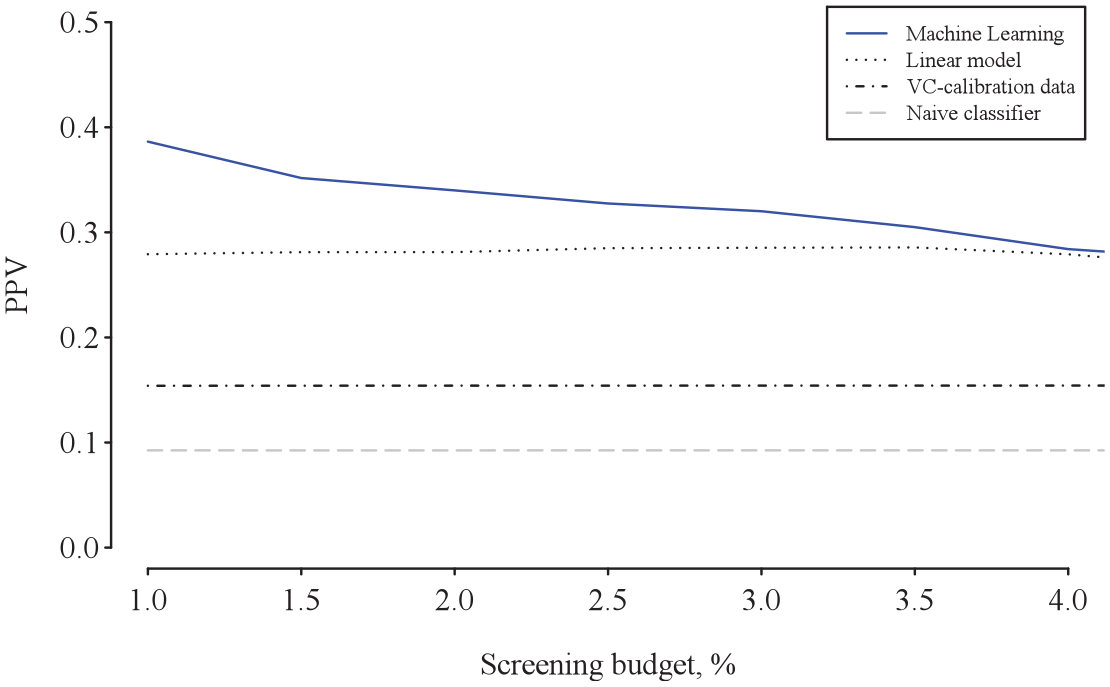
Out-of-sample budget–PPV curves indicating precision. PPV = positive predictive value.
These findings augment the growing literature on how algorithms can support human decision-making and bear on how tasks that so far have required nonroutine cognitive human skills can be automated (e.g., Athey et al., 2020; Cowgill & Tucker, 2019; Elmachtoub & Grigas, 2022; Glaeser et al. 2021). The results are novel, considering that ML technologies’ ability to substitute for human expertise in entrepreneurial contexts has been scarcely explored. Notable exceptions are Blohm et al. (2022), who explore how business angels’ investments perform relative to an ML-based method, and Chalmers et al. (2021), who consider how advances in artificial intelligence (AI) may change venture creation, in part because advanced technology tends to substitute for human input in routine tasks. 11 Our results add to this literature stream by revealing that because of its added flexibility, ML performs particularly well where it matters in practice, that is, in the upper tail of the distribution of the predicted HGE probabilities, enabling substitution for human effort in deal sourcing.
Auxiliary Results: Viewing Human Expertise and ML as Complements
Building on the main results, we now use calibration to quantify how much the predictability of HGEs can be improved if a VC additionally screens the potential investments. 12 In this double-screening scenario, ML enables prescreening in the first step, and in the second step, the VC screens only the firms that ML has predicted to be the most likely HGEs. ML technology complements human expertise when the predictions both improve the quality and reduce the size of the pool of potential investee firms that call for human attention. Both are relevant for VCs, because they must invest time and effort to prescreen each firm in the flow of potential deals but have limited resources to do so (e.g., Gompers et al., 2020). Echoing this point, Maxwell et al. (2011) find that angel investors optimize on the cost of their time by using a decision-making heuristic to reduce the number of investment opportunities to a manageable set. In essence, we replace the heuristic with ML predictions in this auxiliary analysis.
For concreteness, we consider the following two-step deal sourcing process: In Step (i), the pool of firms is prescreened using ML (=our baseline results), and in Step (ii), another screening is performed by a human expert. We cannot involve a real-life VC because such a task would be impractical and too time-consuming for the VC to undertake (see Gompers et al., 2020, for the actual effort and time required). We therefore calibrate our models to approximate a VC’s screening behavior. This calibration allows us to go beyond a thought experiment. It is a standard way to obtain plausible parameter values in quantitative analyses (used extensively in, e.g., economics and climate research; see Cooley, 1997), and thus enables a plausible simulation of the outcome if a human expert were to perform another screening.
We use three alternative calibrations, labeled “absolute,”“relative,” and “simulation-based,” to show that our conclusions are not sensitive to specific assumptions needed for a calibration. The key parameters of each calibration model are the likelihood that a human’s screening signal is positive (q*), indicating an HGE, and the likelihood that the signal is negative (b*), indicating a non-HGE. 13 These parameters capture the VC’s assumed screening accuracy in the second step. Importantly, when combined with a few behavioral assumptions, they can be set at values implied by the actual venture capital decisions that we observe in the data, which is why the calibration allows approximating a VC’s screening behavior. Each of the three alternative calibrations results in different values for q* and b*. We explain the details of the calibration calculations in Online Appendix D. Briefly, the absolute calibration assumes that in the second step, the (hypothetical) human screening is able to improve upon the PPV in the ML prescreened sample as much as the VC outperforms the naive classifier in the data in absolute percentage terms (implying q* = 65.1% and b* = 49.4% for a 1% screening budget). The relative calibration assumes that the human screening can improve upon the PPV in the ML prescreened sample as much as the VC outperforms the naive classifier in the data in relative terms (resulting in q* = 93.5% and b* = 68.0%), whereas the simulation-based calibration draws simulated portfolios based on real data on VC investments (suggesting that q* = 41.2% and b* = 67.3%). The final PPV for the double-screened firm portfolio is then calculated using these parameters for each calibration.
Table 4 summarizes the results, assuming that the VC’s final target portfolio size is 50 firms. All the three calibrations are in line with each other, indicating that double-screening a VC portfolio improves accuracy. For example, the absolute and simulation-based calibrations suggest that PPV is approximately 45% when the 1% budget is used as a starting point for human deal sourcing. This implies a non-negligible improvement in prediction accuracy over what ML achieves alone. The complementarity emerges because of the ability of a trained ML model to foretell systematically—albeit imperfectly—the outcome of a currently unknown event (future rapid growth). Because the initial ML predictions are partially informative about the subsequent scalability of ventures, they resolve part of the uncertainty about the investee firms’ growth potential (in which the investors are interested—see Block et al., 2019; Ewens et al., 2018). They thereby create a smaller and advantageously selected pool from which the VC sources the deals (see Kerr et al., 2014; Ewens et al., 2018, for similar considerations in the context of VC experimentation).
Auxiliary Results (Viewing Human Expertise and ML as Complements).
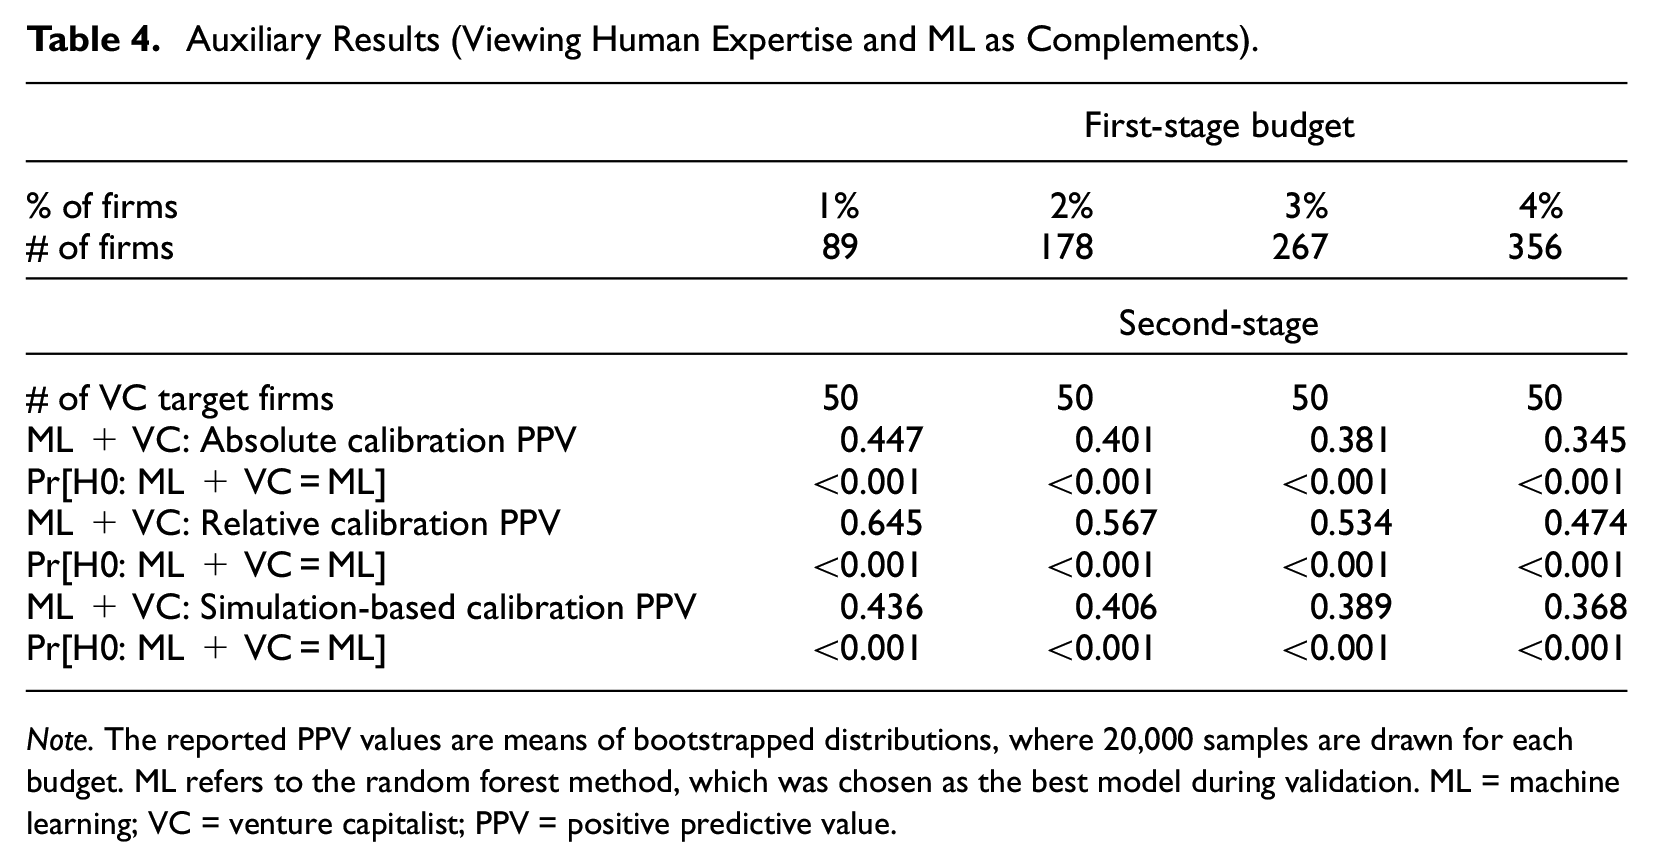
Note. The reported PPV values are means of bootstrapped distributions, where 20,000 samples are drawn for each budget. ML refers to the random forest method, which was chosen as the best model during validation. ML = machine learning; VC = venture capitalist; PPV = positive predictive value.
An interpretation of these findings is that ML predictions and the human capital of VCs complement each other (see Choudhury et al., 2020) resulting in a type of hybrid intelligence (Antretter et al., 2020; Blohm et al., 2022). Given that “. . . the initial screening phase is aimed to filter out ‘non-starters’ . . .” (Wiltbank et al., 2009, p. 3), our auxiliary findings suggest a role for ML-enabled prescreening and provide an alternative view on how a relatively small number of (real-time) ML predictions can be useful in practice.
Robustness Checks: Comparisons to the Previous Literature
A direct comparison of our findings with prior empirical studies is not straightforward because of differences in (i) the definition of outcome variables, (ii) the time awareness of data splitting, (iii) the use of different accuracy measures and particularly, and (iv) the questions asked. The most similar studies to ours are those of Weinblat (2018) and Coad and Srhoj (2020), both of which employ ML methods to predict HGEs (as opposed to firm growth in general) and evaluate predictive accuracy using hold-out samples (as opposed to in-sample fit). Despite being the two closest, they differ from ours in the following ways. Coad and Srhoj (2020) use a modified OECD HGE definition in many of their models and Weinblat (2018) uses a Birch–Schreyer HGE indicator. Moreover, the data split in Coad and Srhoj (2020) is not time-aware, unlike the split in our and Weinblat’s (2018) analyses. Finally, and perhaps most importantly, neither Coad and Srhoj (2020) nor Weinblat (2018) take the decision maker’s budget constraint into account. They also focus on statistical predictability measures other than PPV (which, as we have argued, fits many entrepreneurial decision contexts well).
To enable a more direct comparison, we turn to Table 5, where Panel A reproduces results from Coad and Srhoj (2020); Panel B reports the results from Weinblat (2018), and Panel C reproduces our main results using the standard OECD-HGE definition for turnover and employment HGEs. For completeness, Panel D repeats Panel C but uses the modified OECD HGE definition of Coad and Srhoj (2020), and Panel E repeats Panel C but uses the Birch–Schreyer indicator from Weinblat (2018). For each panel, we report the mean of the outcome variable (=share of HGEs), sensitivity (=TP/P = “true positive rate”), specificity (=TN/N = “true negative rate”), PPV, and the share of firms that are predicted by ML to be HGEs (“ex ante HGEs”).
Comparisons of Our Results With Those of Coad and Srhoj’s (2020) Study and Weinblat’s (2018) Study, Using the Data for Finland.
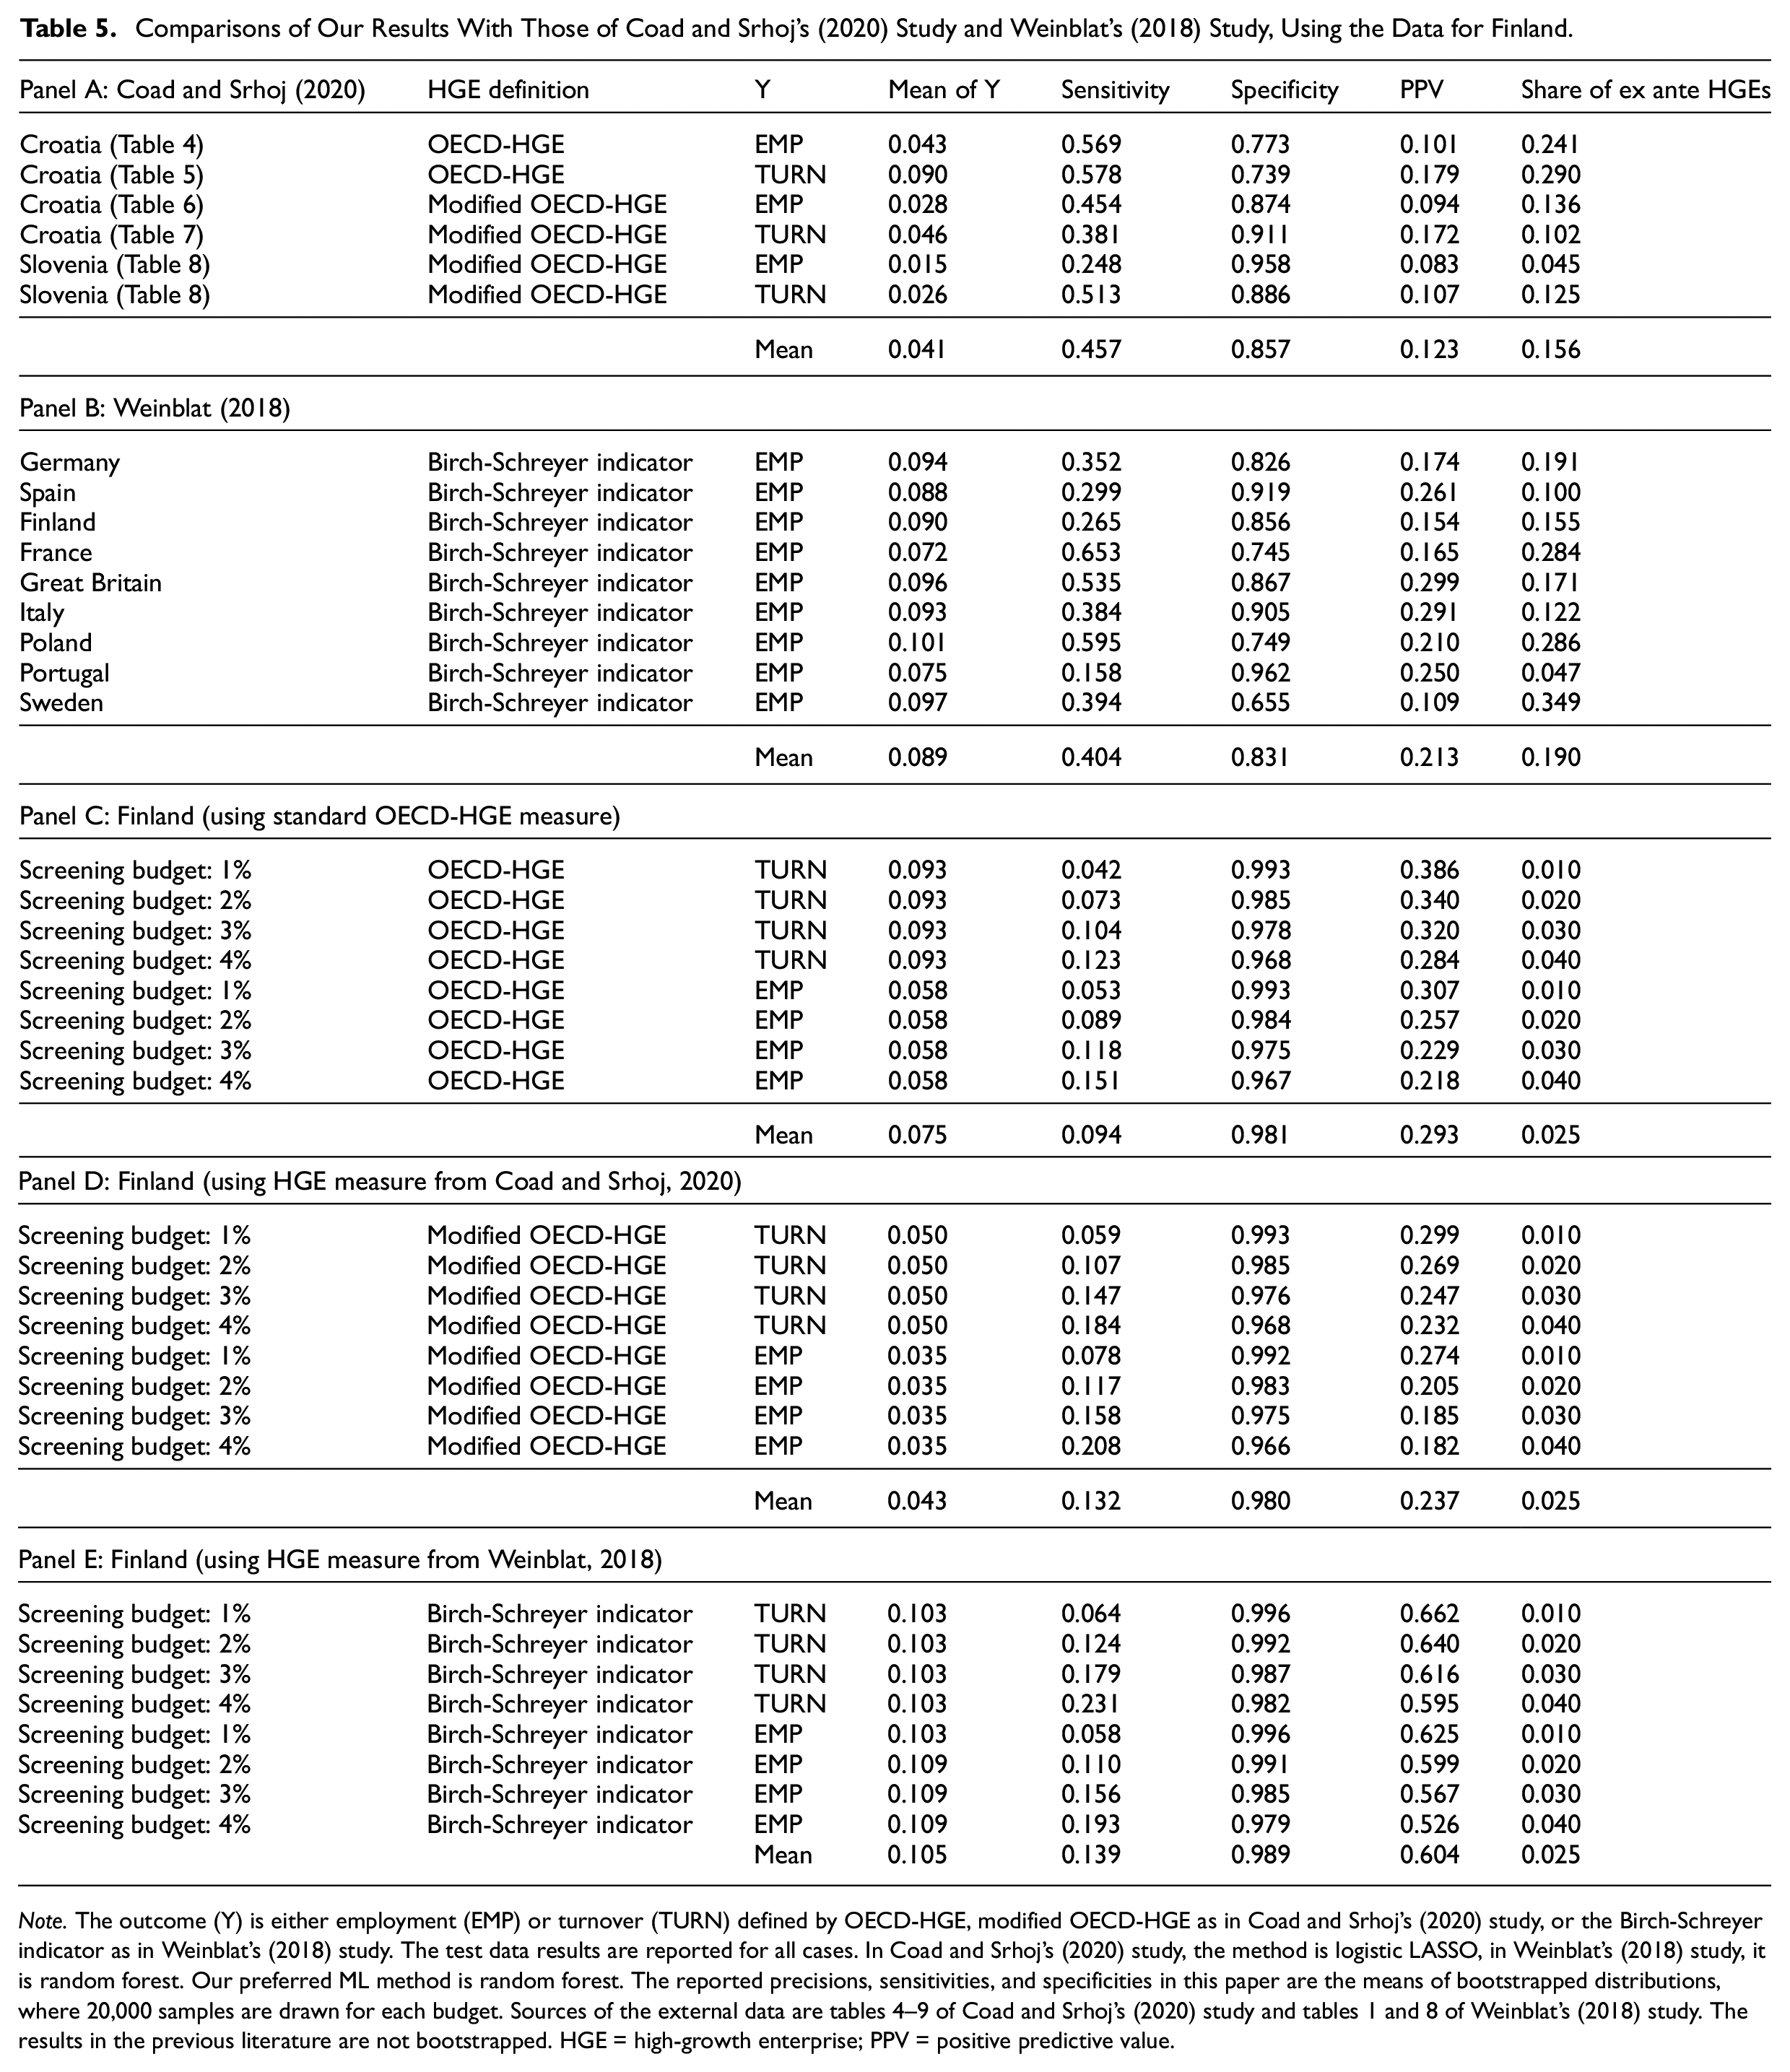
Note. The outcome (Y) is either employment (EMP) or turnover (TURN) defined by OECD-HGE, modified OECD-HGE as in Coad and Srhoj’s (2020) study, or the Birch-Schreyer indicator as in Weinblat’s (2018) study. The test data results are reported for all cases. In Coad and Srhoj’s (2020) study, the method is logistic LASSO, in Weinblat’s (2018) study, it is random forest. Our preferred ML method is random forest. The reported precisions, sensitivities, and specificities in this paper are the means of bootstrapped distributions, where 20,000 samples are drawn for each budget. Sources of the external data are tables 4–9 of Coad and Srhoj’s (2020) study and tables 1 and 8 of Weinblat’s (2018) study. The results in the previous literature are not bootstrapped. HGE = high-growth enterprise; PPV = positive predictive value.
The main observations that emerge from Table 5 are the following: (i) comparing the first column to the last one in Panels A and B, we can see that the earlier applications of ML predict many more HGEs than there actually are in the data. Roughly speaking, the number of predicted HGEs is, on average, twice or thrice as large as the actual number of HGEs. This clearly does not apply to our budget–PPV procedure, because it directs attention to a smaller subset of a predetermined size (see Panel C, D, and E); (ii) our results are robust to using the alternative HGE definitions, as can be seen by comparing Panel C to Panels D and E; and (iii) our ML models outperform those of Coad and Srhoj (2020) and Weinblat (2018) in terms of predictive accuracy. For example, when we use the same outcome variables, the budget–PPV method produces PPV values that are more than 2 times higher than those reported in Coad and Srhoj (2020) and Weinblat (2018). A key reason for this is that our procedure allows focusing on a small number of the most likely HGEs, which is what practitioners are often interested in.
Figure 4 illustrates graphically our key findings by displaying the budget–PPV curves up to 40% of the screening budget. Several observations are noteworthy. First, our ML models outperform the earlier results in terms of predictive accuracy (with one minor exception, where the results are at par). Second, the earlier analyses have implicitly focused on relatively “large budgets” (i.e., have predicted numerous HGEs) and are thus, relatively far in the right tail of the graphs. Such predictions are less relevant in practical decision-making contexts. Third, the earlier studies have focused on a single implied budget value (“point estimates”), whereas we consider a distribution of various budgets. Finally, Figure 4 is notably based on numerous draws from the test sample through bootstrapping (see, e.g., Efron & Tibshirani, 1993), meaning that our findings are robust against sampling uncertainty and allow for hypothesis testing (in contrast to the earlier studies).
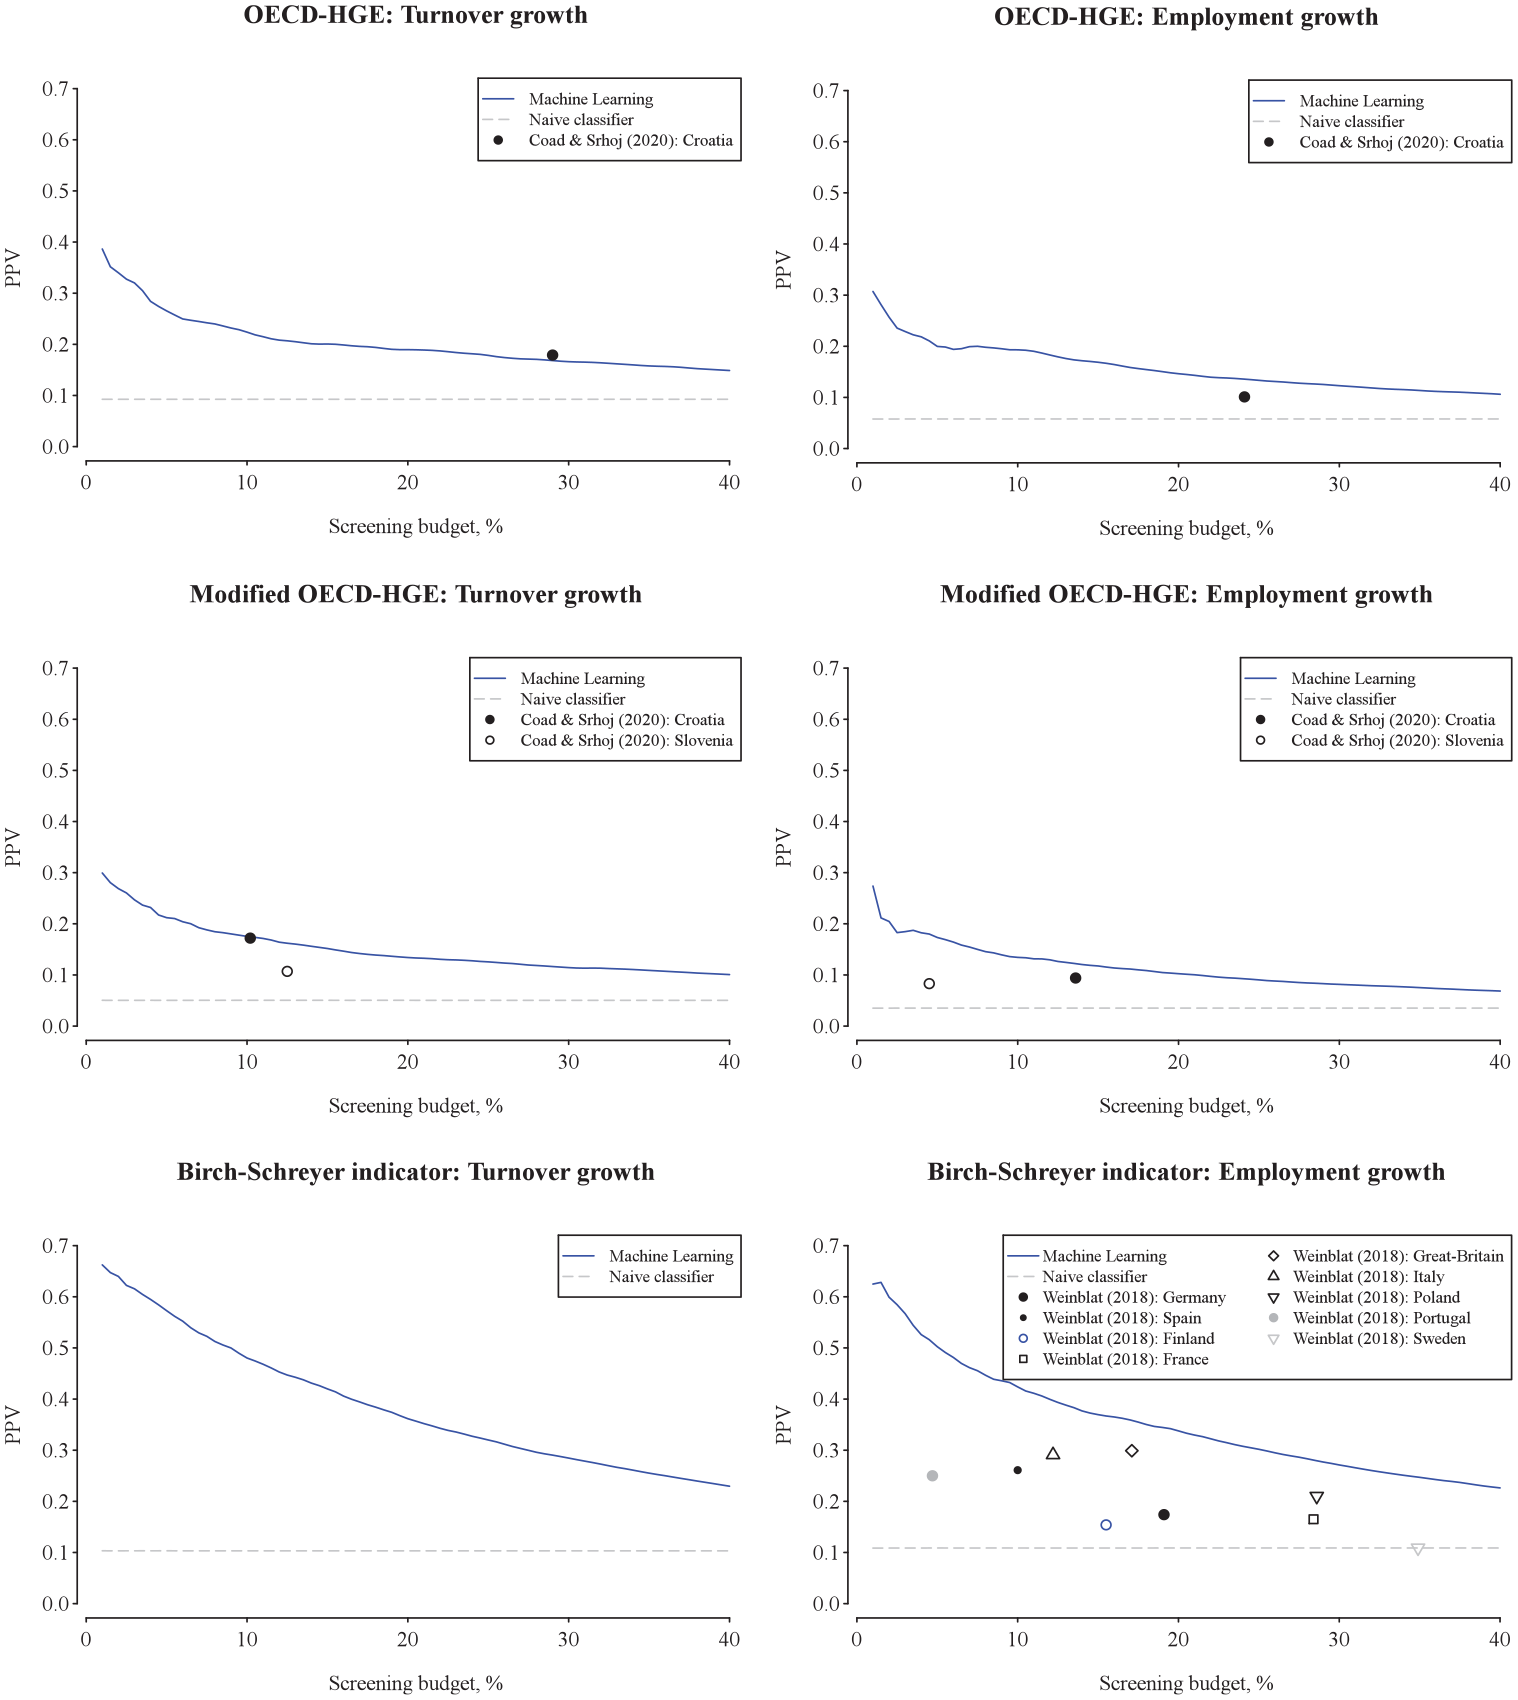
Budget–PPV curves (indicating precision) compared with the prior literature. PPV = positive predictive value.
Discussion
Implications for Research
Our findings’ implications for research are discussed below.
#1: Understanding what makes rapid growth more versus less predictable: We have shown that a subset of firms can be identified ex ante to be HGEs with a high degree of accuracy even 3 years ahead. Theoretical and empirical work is needed to understand better why some firms have such “ex ante identifiable growth profiles.” For example, do the better ex ante HGE predictions mirror the scalability of the firms’ business models, their technological or spatial affordances (Autio et al., 2018), their reliance on digitalization (e.g., Chalmers et al., 2021; Goldfarb & Tucker, 2019; Monaghan et al., 2020; Nambisan, 2017; Nambisan et al., 2019; von Briel et al., 2018), their greater productivity (Syverson, 2011), or something else? We are not aware of any theoretical or empirical analyses that focused on understanding the upper tail of the HGE predictability distribution. This kind of tail predictability is different from standard statistical predictability (based on, e.g., the mean square of the forecast error) and is arguably of key interest to many practitioners. As we see it, the other side of the predictability is of equal scholarly interest. To what extent is the poorer HGE predictability of some firms driven by unpredictable ex-post shocks (see, e.g., Sedláček & Sterk, 2017; Sterk et al., 2021) such as lucky subsequent increases in demand (see Guzman & Stern, 2015)? What makes a firm grow fast when it does not have observable features that predict fast growth?
#2: Predictability and new modes of external finance: Predictability of firm performance is a key component of the theoretical and empirical research on the (equity) financing of high-impact and innovative ventures (Bertoni et al., 2022; Drover et al., 2017). Therefore, further analyses of what is and is not predictable would bear on theory-driven research that focuses on how the existing equity financing evolves and how new modes of finance emerge and work (Bertoni et al., 2022; Drover et al., 2017). Better predictability means, for example, that inapproachable uncertainty can be turned into more manageable risk, along the “spectrum of unknowingness” (Townsend et al., 2018, p. 670).
For instance, the Financial Times (Kruppa, 2021) notes that “General Catalyst, one of the largest US venture capital firms, has started a fund to purchase sales contracts from tech start-ups, adding to a growing roster of companies [e.g., Capchase and Pipe] hoping to profit from the strategy.” These kinds of novel financing strategies depend on how predictable the outcomes are. The ML-enabled changes in the financing industry also raise many kinds of new research questions such as how new technologies (e.g., ML methods) change the investment criteria of different types of investors (Bertoni et al., 2022; Mason & Stark, 2004) and whether potential biases exist in the algorithmic identification of investments and scalable ventures (see, e.g., Choudhury et al., 2020; Cowgill & Tucker, 2019).
Viewing growth predictions as signals of investment opportunities raises additional research questions such as whether ML predictions can effectively substitute for VCs’experimentation: Forward-looking ML predictions are a way to generate novel information about the success likelihood of potential investee firms in a highly uncertain environment (Agrawal et al., 2018). In the same way that a small initial investment is a means to resolve early-stage uncertainty about a venture’s subsequent potential (Kerr et al., 2014; Pillai et al., 2020), ML predictions can be used to “reveal” whether a potential investee firm has a certain chance to scale. More research is needed on what this kind of technological advance means for VCs’ experimentation-based “spray and pray” investment strategy, “. . . in which they focus on learning about the
#3: Predictions as inputs into entrepreneurs’ and their stakeholders’ decision-making: A key insight from our analysis is that better precision is related to a decision maker’s need to pick a relatively small number of HGEs. This is a novel viewpoint both empirically and conceptually, calling for further scrutiny from a behavioral perspective. As suggested by the work of Foss and Klein (2012) on entrepreneurial judgment, of Hyytinen et al. (2014) on prediction errors by start-up founder-managers, and of Kuechle et al. (2016) on prediction- and control-based entrepreneurial strategies, various kinds of beliefs, expectations, and forecasts are ubiquitous in entrepreneurial contexts. Subsequent research could therefore explore both theoretically and empirically in greater detail why and in which contexts algorithmic predictions might be helpful to entrepreneurs, allowing, for example, the reduction of prediction biases (e.g., Collewaert et al., 2021; Schirrmeister et al., 2020). Upon discussing how applications of AI can enhance entrepreneurial success, Shepherd and Majchrzak (2022, p. 1) “. . . propose that AI can be combined with entrepreneurship to represent a super tool.” Our results point to a human–machine complementarity and augmentation (Raisch & Krakowski, 2021) in one critical entrepreneurial interface—venture finance—indicating virtues of hybrid intelligence (Dellermann et al., 2019). How ML algorithms can support humans in entrepreneurial contexts can be further investigated. As Brynjolfsson (2022, p. 272) notes, “. . . augmentation creates new capabilities and new products and services, ultimately generating far more value than merely human-like (and human-replacing) AI.”
#4: More detailed integration of and alternative decision contexts. While we have considered a relatively simple budget–PPV constraint scenario, the procedure can in subsequent research be extended to include additional details from actual decision contexts and be combined with more complex portfolio optimization procedures. For example, after ranking firms according to their ex ante HGE probability, the budget–PPV procedure can account for investment size in addition to portfolio size (using, e.g., combinatorial optimization tools or a staged portfolio selection). Finding a combination of firms that fits within the total budget and firm size constraint may be important, for example, for science parks.
Practical Implications
We have considered how accurately HGEs can be predicted (problem, A) from the perspective of a VC whose predetermined budget allows financing of only a few potential investee firms (context, B), and showed how ML and our budget–PPV curve allow determining which firms to pick, subject to the budget constraint (solution, X). This ML-enabled procedure can either directly substitute for or, alternatively, complement human expertise. Moreover, it is generally applicable in the sense that selecting a small number of the most likely growers is important in many other decision situations. It can, for example, be applied to investment decisions that business angels face (Maxwell et al., 2011). It also applies to technology and science parks that have a limited number of slots open for growth-oriented firms in their physical premises (see, e.g., Bergman & McMullen, 2022; Ng et al., 2019; Yin & Luo, 2018). While the exact objectives and admission procedures of these organizations are not easily characterized (Bergman & McMullen, 2022; Ng et al., 2019), a common objective seems to be to have as many HGEs as possible as tenants or residents (because of, e.g., reputational concerns). These other decision contexts may have special features (e.g., some HGEs may be too large for a business park) that should be considered prior to a real-life implementation.
Our budget–PPV analysis also bears on retention policies, which have been proposed to avoid “picking winners” (Amezcua et al., 2013; Autio & Rannikko, 2016; Bradley et al., 2021; Mason & Brown, 2013; Shane, 2009). Retention means that relatively loose support criteria are deployed at the initial stage and then support grows more substantially at subsequent stages, provided the ventures meet “growth milestones” (Autio & Rannikko, 2016). As our findings show, the budget–PPV approach is a tool for identifying a desired, fixed number of potential growth firms that are eligible for initial support. The goal of such an initial support allocation can then be to learn (i) which firms are the most likely to react positively to later support (indicating subsequent policy effectiveness) and (ii) which firms are the most likely sources of positive externalities (indicating them as being legitimate policy targets).
Limitations
We have not focused on the question of variable (predictor) importance, emphasized in the explainable ML literature (e.g., Roscher et al., 2020). While a more detailed understanding of variable importance in ML models is at times of interest to scholars, it is less obvious whether the same applies to practitioners such as VCs. Like a passenger in a modern driverless car, a VC is likely to be more interested in how accurate the ML predictions are (and how reliable the system enabled by them is), as opposed to the details of the ML algorithm and why it works. However, we have not entirely ignored the question of variable importance, as we have also briefly analyzed it and compared the important predictors of our study with those of Coad and Srhoj (2020) and Weinblat (2018). The main findings are (see Online Appendix F) that (i) our data allow us to include in our (best performing) ML model most of the predictors identified to be important in the previous literature, and that (ii) in our ML model, the most important predictors are lagged growth variables. It also seems that optimizing the choice of the ML method, as we do, is to an extent a substitute for having numerous predictors.
Our study also has other limitations. Predicting correctly that a venture is an HGE is not necessarily the same thing as identifying a profitable investment opportunity. Our findings are not informative of how good a signal of private investment returns a venture’s ex ante HGE status is (Kerr et al., 2014). Moreover, we have not considered in detail a scenario in which a practitioner would like to pick a specific combination of certain kinds of HGEs. In such a case, merely sorting the firms according to their probability to be HGEs is not sufficient.
Conclusions
We have examined how ML allows addressing a specific decision problem faced by a VC attempting to pick HGEs ex ante. Our novel budget–PPV procedure allows a VC to focus on a few of the most likely ventures to become HGEs. Our findings indicate that ML methods perform particularly well where it matters in practice, that is, in the upper tail of the distribution of the predicted HGE probabilities. From a broader perspective, our procedure for generating HGE predictions shows how the design science approach (see, e.g., Berglund et al., 2018; Hyytinen, 2021) can inform debate on how ML methods can be applied fruitfully in entrepreneurship research (see, e.g., Lévesque et al., 2022). By doing so, we hope to have advanced the view that it should be the problems that are of both scholarly and practitioner interest (Hyytinen, 2021), and not the advance of techniques per se, that should drive how ML methods are applied in entrepreneurship research (see also Berglund et al., 2018; Frank & Landström, 2016; Wiklund et al., 2019).
Supplemental Material
sj-docx-1-etp-10.1177_10422587221128268 – Supplemental material for Ex Ante Predictability of Rapid Growth: A Design Science Approach
Supplemental material, sj-docx-1-etp-10.1177_10422587221128268 for Ex Ante Predictability of Rapid Growth: A Design Science Approach by Ari Hyytinen, Petri Rouvinen, Mika Pajarinen and Joosua Virtanen in Entrepreneurship Theory and Practice
Footnotes
Acknowledgements
We thank Moren Lévesque (the editor) and two anonymous referees for their excellent comments and suggestions. We also thank Markku Maula and Jonne Kuittinen for useful discussions.
Declaration of Conflicting Interests
The author(s) declared no potential conflicts of interest with respect to the research, authorship, and/or publication of this article.
Funding
The author(s) received no financial support for the research, authorship, and/or publication of this article.
Supplemental Material
Supplemental material for this article is available online.
Notes
Author Biographies
References
Supplementary Material
Please find the following supplemental material available below.
For Open Access articles published under a Creative Commons License, all supplemental material carries the same license as the article it is associated with.
For non-Open Access articles published, all supplemental material carries a non-exclusive license, and permission requests for re-use of supplemental material or any part of supplemental material shall be sent directly to the copyright owner as specified in the copyright notice associated with the article.