
Abstract
The intracellular bacterium, Coxiella burnetii, causes Q fever in humans and coxiellosis in animals. Cell-mediated immunity (CMI) has been shown to be important in Q fever; however, few studies have investigated the role of CMI in coxiellosis in cattle. Therefore, we aimed to optimize a whole-blood cytokine recall assay (CRA) and to evaluate C. burnetii–specific interferon-gamma (IFNγ) and interleukin 10 (IL10) responses in naturally infected cattle. Duplicate blood samples were collected from cows in an endemically infected dairy herd (as determined by serologic and molecular testing as well as through microbiologic culture) and subsequently transported at ambient temperature or on ice before stimulation with phase 1 and 2 C. burnetii antigen at various concentrations for 24 or 48 h; IFNγ and IL10 were measured in supernatant by ELISA. Using the optimized assay, the cytokine response was measured at calving and ~8 wk post-calving. The effect was assessed using generalized linear models and Spearman correlation coefficient (ρ). The greatest mean cytokine responses were elicited when blood samples were transported at ambient temperature and stimulated for 48 h with the highest C. burnetii antigen concentration. There was a significantly greater mean IFNγ (2.04 times) and IL10 (1.86 times) response at 8 wk post-calving compared to calving. At 8 wk post-calving, the correlation between cytokine response to phase 1 and 2 C. burnetii was ρ = 0.84 for IFNγ and ρ = 0.91 for IL10. Ultimately, our optimization study will guide informed use of the CRA in cattle research, allowing effective investigation of CMI in coxiellosis.
Coxiella burnetii is the gram-negative, intracellular bacterial pathogen responsible for the zoonotic disease Q fever in humans and coxiellosis in animals. In humans, infection typically is an acute flu-like illness but can also appear as a persistently focal infection, such as endocarditis, which may result in death in a small percentage of patients. 21 Domestic ruminants (cattle, sheep, goats) are the most important reservoir for human infection, with the bacterium shed primarily in the products of parturition (placenta, fetal fluids); however, C. burnetii can also be shed in feces and sporadically in milk throughout lactation.17,24 For the most part, animal infections with C. burnetii are considered subclinical. If clinical disease does manifest in animals, it is usually in the form of reproductive failure, with C. burnetii being a well-accepted cause of abortions in goats and, to a lesser extent, in sheep.3,26,33 However, the disease manifestations in cattle are less clearly defined, and further research is required to understand C. burnetii pathogenesis and impacts in cattle to enable the development of informed and effective control measures such as vaccination.
Being an intracellular pathogen, cell-mediated immunity (
Cytokine recall assays (
Most C. burnetii research in cattle has historically focused on measuring the humoral response, and, although this is valuable for determining herd-level exposure, information regarding CMI is vital to understanding the pathogenesis of this intracellular pathogen.12,14,15 In cattle studies, CRAs have been used to gain insights into pathogenesis and diagnosis of other intracellular bacterial species such as Mycobacterium avium subsp. paratuberculosis (MAP), which suggests that this assay may also be useful in investigations of C. burnetii; its use has been described in a small number of studies employing methodology similar to that used in human studies.5,35 However, the CRA has likely been underutilized to date, in part due to logistical constraints, such as the requirement to stimulate samples within 18 h of collection and a paucity of information regarding its optimal use with cattle samples.
We therefore aimed to optimize the whole-blood CRA specifically for use with C. burnetii antigens for the detection of the cytokines IFNγ and IL10 in cattle. Technical variables were adjusted, including medium-preparation technique, storage temperature of samples during transportation, and the duration of sample incubation with C. burnetii antigens at various concentrations to optimize production of IFNγ and IL10 in a whole-blood cell assay. The assay was further optimized for informed use within the context of dairy management systems by assessing the impact of sampling time relative to calving on cytokine responses.
Materials and methods
Animals and sample collection
Our study was approved by the University of Sydney Animal Ethics Committee (Ethics approval 2021/2014). Samples for our study were derived from dairy cows on a farm located in New South Wales, Australia. C. burnetii infection was verified as endemic in the herd through detection of antibody against C. burnetii in both serum samples from individual cows and bulk tank milk samples; PCR assays positive for C. burnetii DNA in milk, placenta, feces, and vaginal swabs; and growth of C. burnetii in Vero cell cultures of milk, serum, placenta, and vaginal swabs as part of another study (unpublished data). Optimization of the CRA for use with cattle samples was conducted according to the study design ( Table 1 ). Specific details for each variable that was assessed are provided with the corresponding results.
Study design for optimization of the cytokine recall assay for use with cattle.
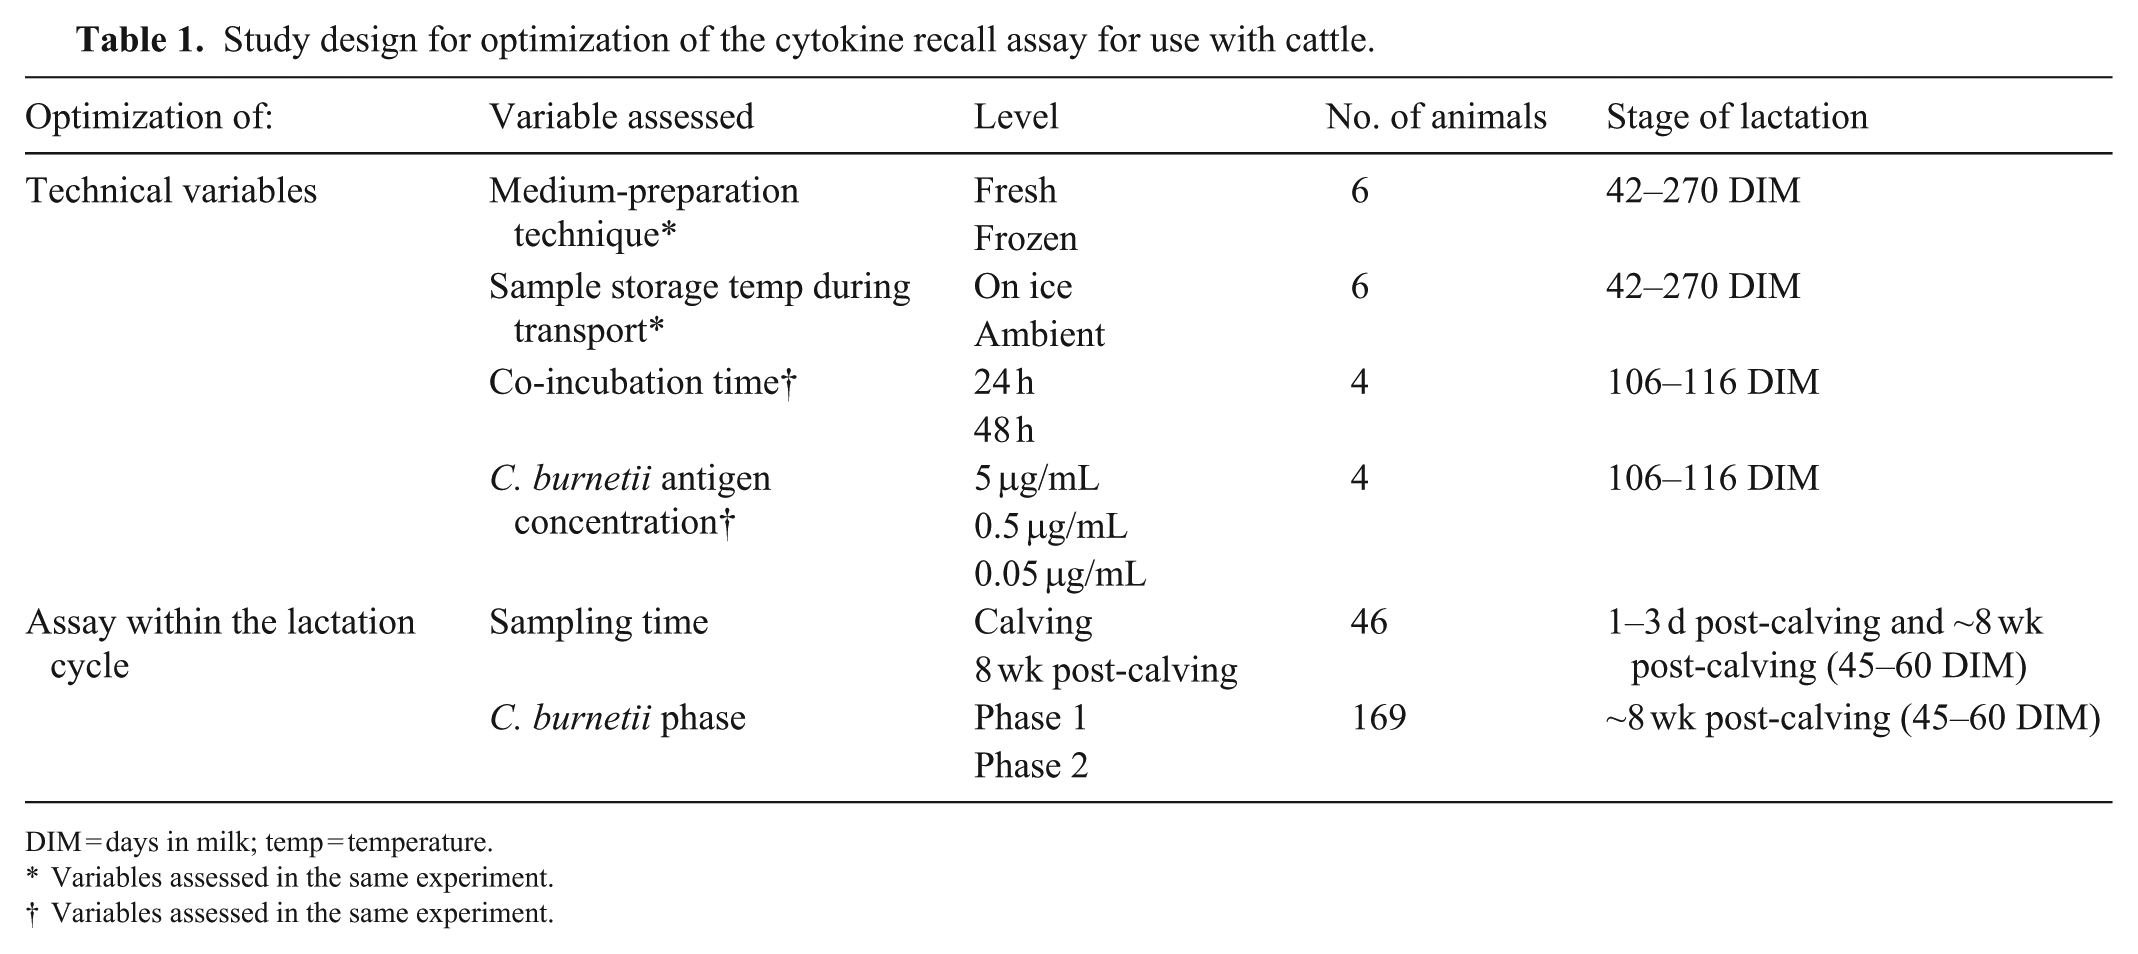
DIM = days in milk; temp = temperature.
Variables assessed in the same experiment.
Variables assessed in the same experiment.
Blood (10 mL) was collected from the coccygeal vein of cattle into commercially available vacuum-sealed polyethylene terephthalate (PET) blood-collection tubes containing 158 USP units of spray-dried lithium heparin (Vacutainer; Becton Dickinson). Care was taken to ensure that the method of blood collection did not result in the formation of microclots within the sample, with the lithium heparin tube filled first if other tubes (e.g., for serum) were collected concurrently. Following collection, blood tubes were gently inverted to incorporate the anticoagulant and transported to the laboratory at ambient temperature or on ice until processing.
Whole-blood stimulation assay
The whole-blood stimulation assay was adapted from previously published methodology utilized in human 28 and ruminant 5 C. burnetii IFNγ studies and from an IFNγ recall assay using MAP antigen.4,6,19
Culture plates and medium
All experiments were conducted in tissue culture–treated 48-well polystyrene plates (Costar; Corning). Complete culture medium used for all experiments was RPMI medium 1640 (Sigma-Aldrich), containing 10% fetal bovine serum (FBS; Invitrogen), 2 mM L-glutamine (Sigma), and 100 μg/mL penicillin–streptomycin (Invitrogen). All plates were pre-loaded with 300 μL of medium only, or medium to which mitogens or antigens were added, and frozen at −45°C until use, except for the experiments that compared outcomes with frozen and fresh medium. For the latter, complete medium was made up immediately prior to loading the whole blood onto the plates.
Antigens
Commercial formaldehyde-inactivated whole-cell Nine Mile strain C. burnetii phase 1 and 2 antigens (B1CF1, B1CF2; Dolfinin) were used in all experiments in our study. According to the manufacturer, the product is supplied at an antigen concentration of 1 mg/mL (data on genomic equivalents was not available). In the optimization experiments of technical assay variables (Table 1), 3 final concentrations were tested: 5, 0.5, and 0.05 μg/mL. For the optimization experiments through the lactation cycle (Table 1), a final concentration of 5 μg/mL was used. Working solutions at each concentration were prepared (diluted in medium) and aliquoted into duplicate wells for each blood sample for the initial technical optimization and into single wells for each blood sample for the subsequent optimizations with larger animal numbers. Antigen responses were assessed for each blood sample.
Controls—mitogen and lipopolysaccharide
Pokeweed mitogen (
Stimulation assay
Pre-loaded plates (see section Culture plates and medium) stored at −45°C were thawed in an incubator set at 37°C (HERAcell 150; Kendro). Plates loaded with freshly prepared medium (300 μL) were also brought to 37°C in an incubator before loading blood into the wells. Blood samples were loaded onto both freshly prepared and pre-prepared thawed plates within 18 h of collection. Blood tubes were gently mixed on a rotating homogenizer, and 300 μL was added to each well of the 48-well plate such that the ratio of medium (±additives) to blood was 1:1. Each plate was then placed into the incubator set at 37°C with 5% CO2 for 24 or 48 h for the initial optimization experiments or 48 h for the subsequent optimization experiments. Following this incubation, 300 μL of assay supernatant was transferred from each well to individual polypropylene tubes, capped, and placed in a 96-tube racked storage system (SSIbio), and stored at −45°C until use in an ELISA.
Interferon-γ ELISA
Cytokine detection was performed on assay supernatant samples from the whole-blood stimulation assay using a sandwich ELISA. Microplates (96-well Nunc MaxiSorb; Thermo) were coated with monoclonal mouse anti-bovine IFNγ (clone IFN 6.19, a generous gift from Dr. G. Jungersen, Technical University of Denmark) at a concentration of 1.5 μg/mL diluted in PBS and incubated at 4°C overnight. The plates were washed 3 times in wash buffer (0.05% Tween 20 in reverse osmosis [
Interleukin 10 ELISA
IL10 detection was performed on assay supernatant samples from the whole-blood stimulation assay using a sandwich ELISA. Microplates (96-well Nunc MaxiSorb) were coated with mouse anti-bovine IL10 antibody (clone CC318; Bio-Rad) at a concentration of 2.5 μg/mL diluted in wash buffer (0.05% Tween 20 in RO water) and incubated at 4°C overnight. Plates were washed 3 times with wash buffer before the addition of 50 μL of undiluted assay supernatant sample or undiluted IL10 standards (standard curve of 0–25 ng/mL; bovine IL10 yeast-derived Recombinant Protein; Kingfisher Biotech). Following incubation for 1 h at RT, each plate was washed 3 times with wash buffer before adding 50 μL per well of a biotin-conjugated secondary antibody (mouse anti-bovine IL10 clone CC320-Biotin; Bio-Rad) at a concentration of 0.5 μg/mL in wash solution. The plates were then incubated for 1 h at RT and then washed 3 times with wash buffer before the addition of 50 μL per well of HRP–streptavidin (0.333 μg/mL; KRL) to each well. Following incubation at RT for 30 min, each plate was washed 5 times with wash buffer before the addition of 100 μL per well of TMB substrate set (OptEIA; BD Biosciences), followed by incubation in the dark. The development of the plates was monitored at 620 nm on an absorbance plate reader until the 25 ng/mL standard reached OD 0.45–0.5 or the negative control exceeded OD 0.05, at which point the reaction was stopped by adding 100 μL per well of 2 M sulfuric acid. All samples and standards were assayed in duplicate, and ODs were measured on an ELISA plate reader (Multiskan Ascent; Thermo Electron) at 450 nm. ODs were converted to ng/mL based on the standard curve. The cytokine response is reported with the unstimulated control (medium background) subtracted, unless otherwise stated. As a comparison, S:P ratios were also calculated: ([OD C. burnetii stimulation – OD medium background control]/[OD stimulation positive control (PWM) – OD medium background]) × 100%.
Statistical analyses
The effects of medium-preparation technique, sample storage temperature, co-incubation time, antigen concentration, sampling time, and C. burnetii phase on IFNγ and IL10 response were determined using generalized linear models with a Gaussian distribution, a log link to account for right-skewed data, and cow fitted as a fixed effect. Exponentiated coefficients from these models estimate ratios of arithmetic means for the variable category of interest relative to the comparison category (i.e., the reference category) of that variable. Interactions were explored for experiments with multiple variables, with inclusion of any interaction terms in the models specified in the results section. Inclusions of interaction terms were decided based on a combination of scientific knowledge, sample size, data visualization, and p-values for interaction terms. If there was no reasonable basis for assuming interaction, only the main effects of covariates were fitted. Assessment of the effect of sampling time on cytokine response for the positive control PWM was conducted using a tobit model to account for right-censored data, as 20 ng/mL was the highest possible result. With this model, SEs were adjusted for clustering by cow. Only descriptive statistics were used to assess the effect of cytokine response from the control mitogens in the initial technical variable optimization due to restricted sample sizes. Correlation between cytokine response to C. burnetii phases 1 and 2 and presenting cytokine data as S:P% and in ng/mL were determined using the Spearman correlation coefficient (ρ). Statistical analyses were performed using Stata (v.18; StataCorp), and figures were created in RStudio (R Core Team, 2018).
Results
Effect of medium-preparation method and sample storage temperature during transportation on cytokine responses
The effect on IFNγ and IL10 responses of varying the temperature at which the whole blood was kept throughout the time from collection until being placed in the stimulation assay was determined using blood collected from 6 cows. A greater mean cytokine response to the positive control, PWM, and to C. burnetii antigen was obtained from blood transported and stored at ambient temperature versus from blood that was chilled on ice (
Figs. 1
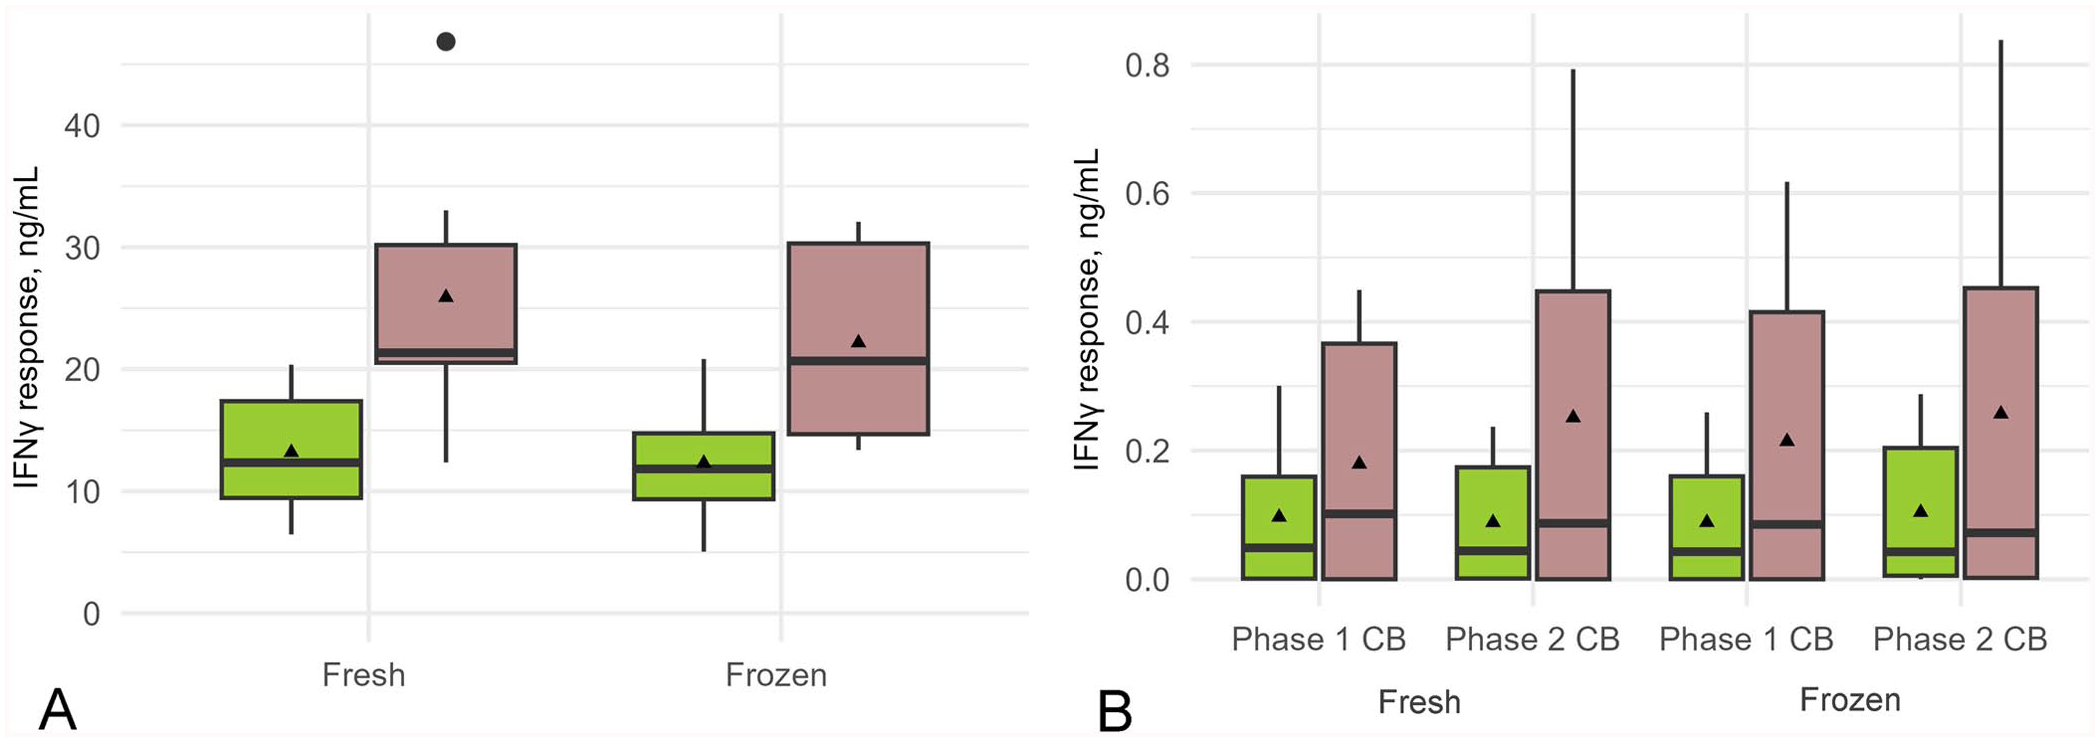
Box-and-whisker plot of the effect of the medium-preparation method and sample storage temperature during transportation on the interferon-gamma (IFNγ) response to positive control pokeweed mitogen (PWM) and Coxiella burnetii (CB) antigen stimulation. Whole blood from 6 cows was transported either on ice (green) or at ambient temperature (brown) then stimulated in vitro for 48 h with
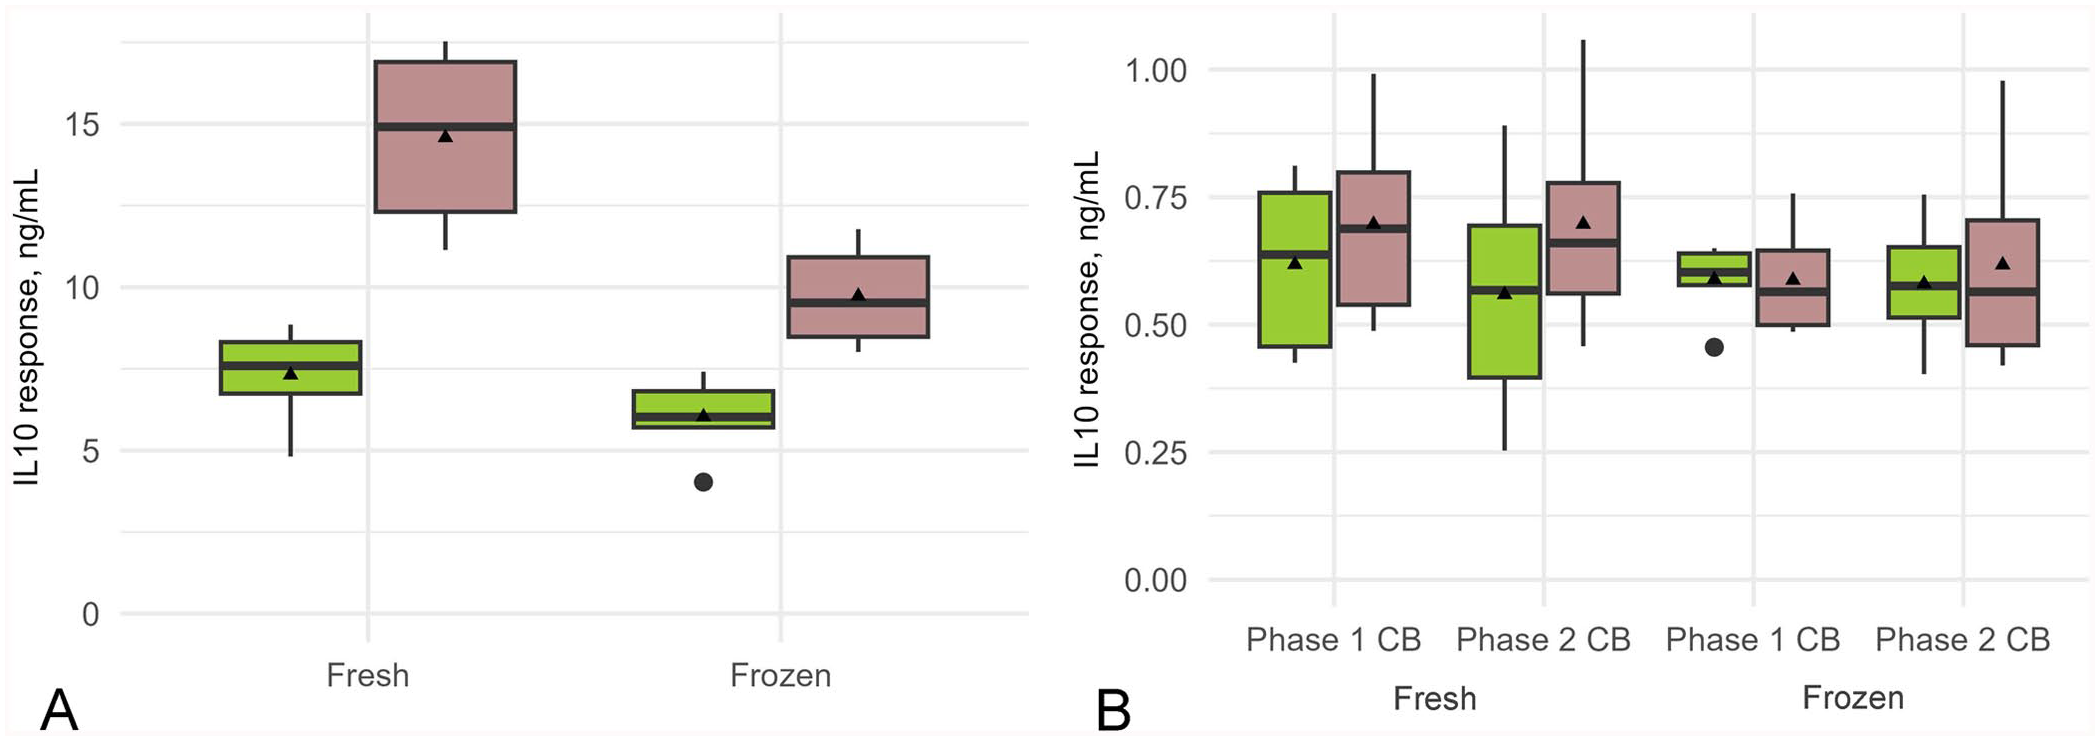
Box-and-whisker plot of the effect of the medium-preparation method and sample storage temperature during transportation on the interleukin 10 (IL10) response to positive control pokeweed mitogen (PWM) and Coxiella burnetii (CB) antigen stimulation. Whole blood from 6 cows was transported either on ice (green) or at ambient temperature (brown) then stimulated in vitro for 48 h with
Effect of medium-preparation method and sample storage temperature during transportation on IFNγ and IL10 responses to positive control pokeweed mitogen (PWM) and Coxiella burnetii antigen stimulation. Whole blood from 6 cows was stimulated in vitro with PWM or C. burnetii antigen for 48 h. Cytokine response was determined using an ELISA. Results from stimulation with Coxiella burnetii phases 1 and 2 are pooled.
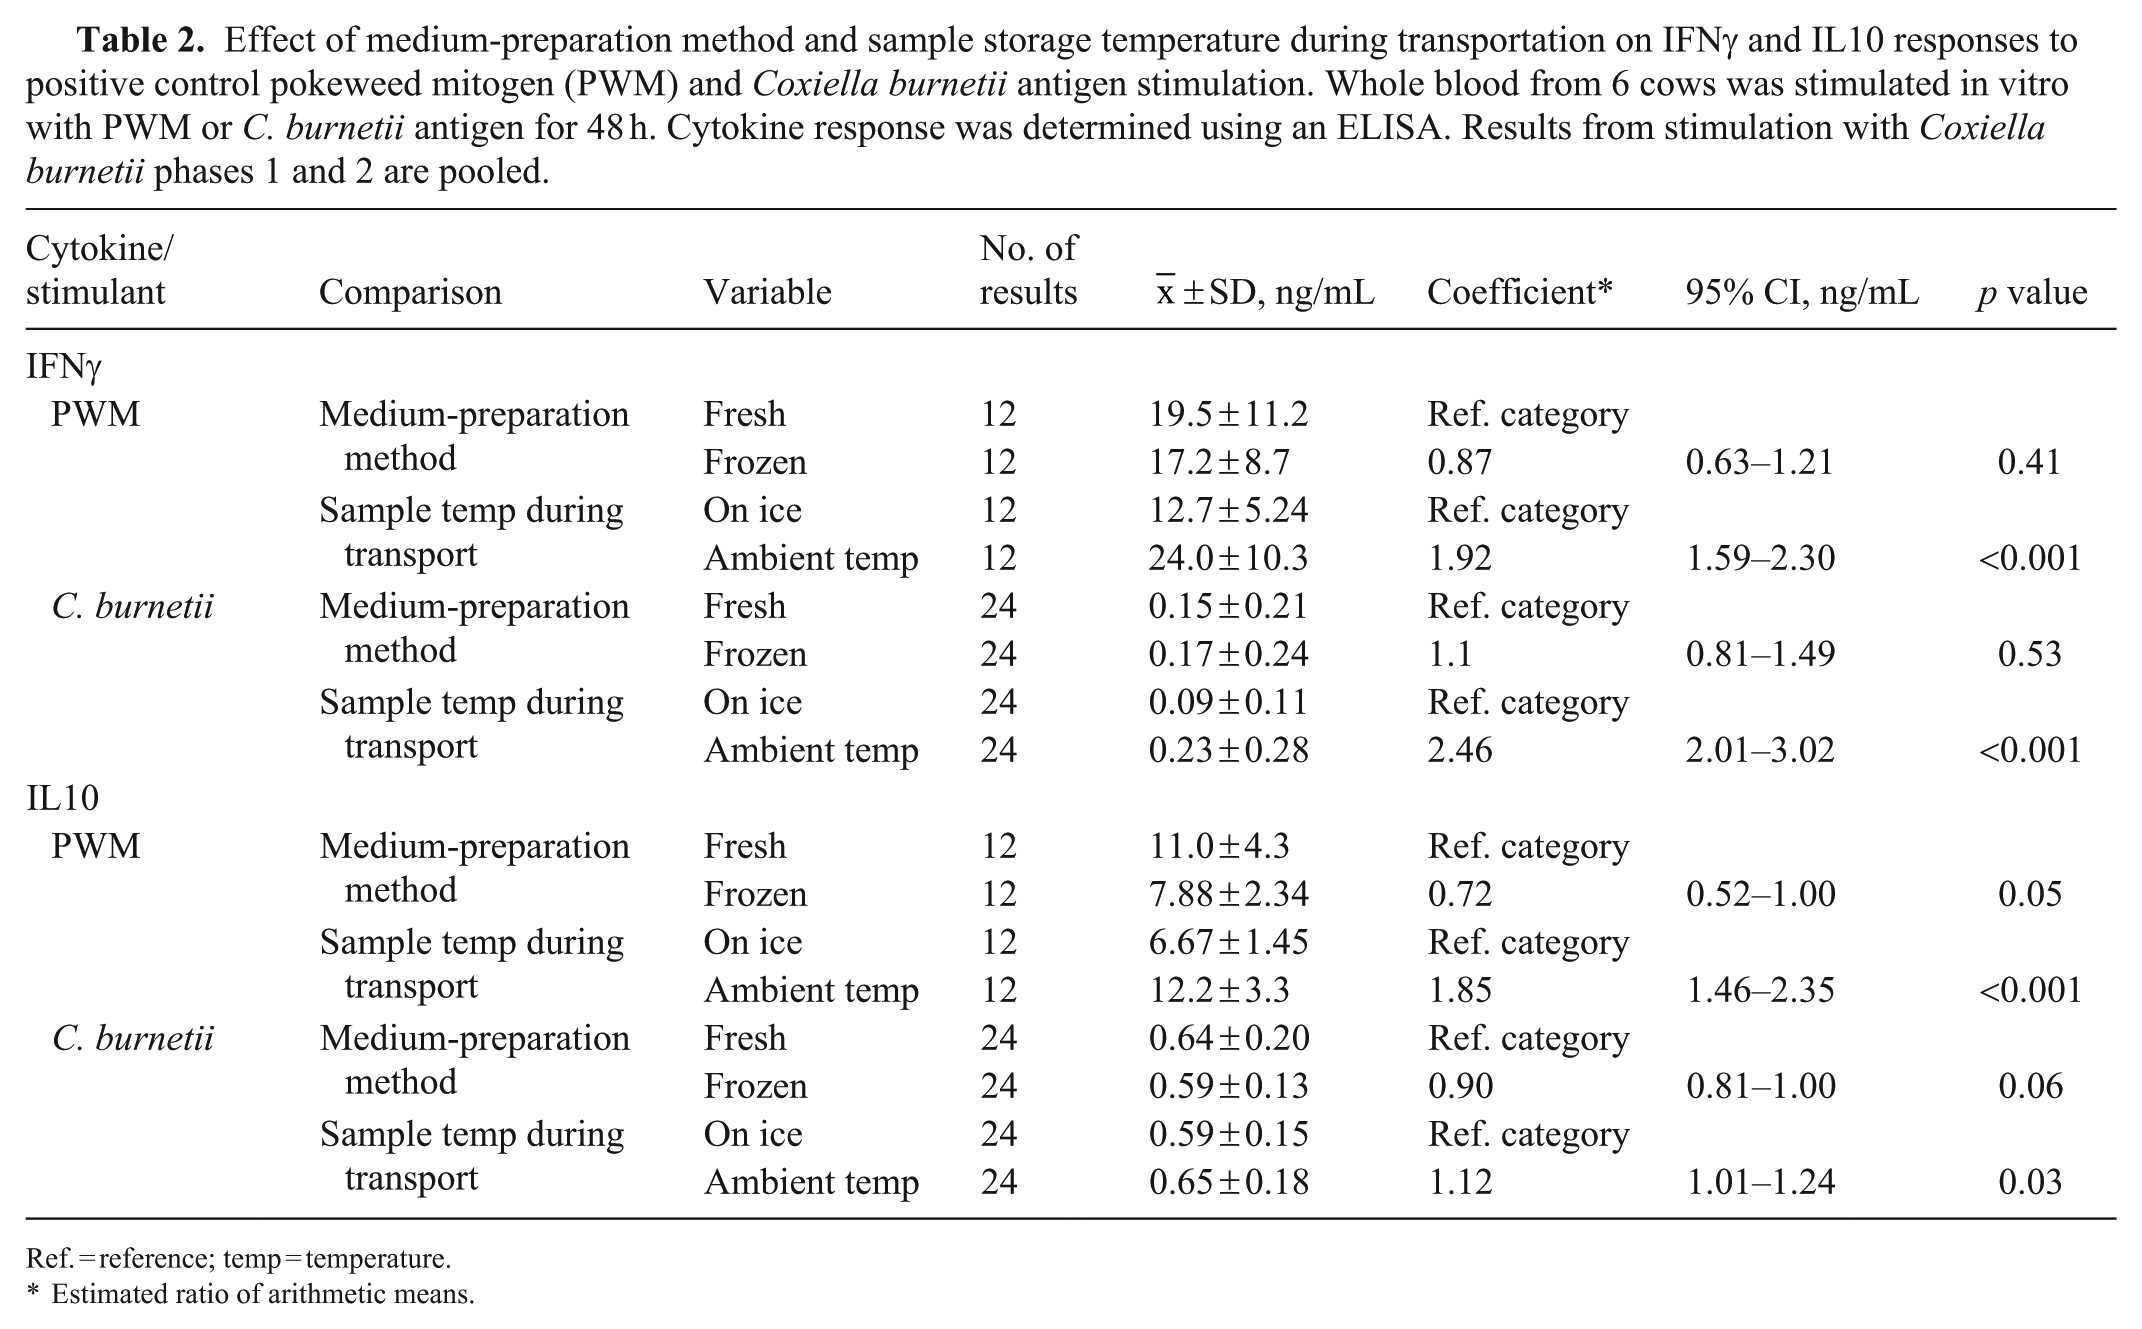
Ref. = reference; temp = temperature.
Estimated ratio of arithmetic means.
The effect of pre-preparing medium and storing at −45°C before use in the stimulation assay versus using freshly prepared medium (that had not been frozen before use) on IFNγ and IL10 responses in whole blood obtained from 6 cows was examined. There was no significant difference in the mean IFNγ response to the positive control, PWM, or to C. burnetii antigen when using the 2 medium-preparation methods (Fig. 1; Table 2). There was also no significant difference in the mean IL10 response to C. burnetii antigen between the medium-preparation methods; however, the IL10 response to PWM was significantly higher when using the freshly prepared medium (Fig. 2; Table 2).
Effect of C. burnetii antigen concentration and incubation time on IFNγ and IL10 responses
The effect of C. burnetii antigen concentration and incubation time on IFNγ response was measured in whole-blood samples from 4 cows. The greatest median IFNγ response to C. burnetii stimulation was elicited with the highest antigen concentration (5 μg/mL) for both C. burnetii phases 1 and 2 and after the longer (48 h) incubation period ( Fig. 3 ). There was a statistically significant interaction between the variables, co-incubation time and antigen concentration, and therefore we estimated the effect of time within concentration ( Table 3 ), and the effect of concentration within time ( Table 4 ). There was a significant increase in IFNγ response with the longer co-incubation time, when the highest antigen concentration was used (Table 3). There was also a significant increase in IFNγ response with increasing antigen concentrations at both co-incubation times (Table 4).
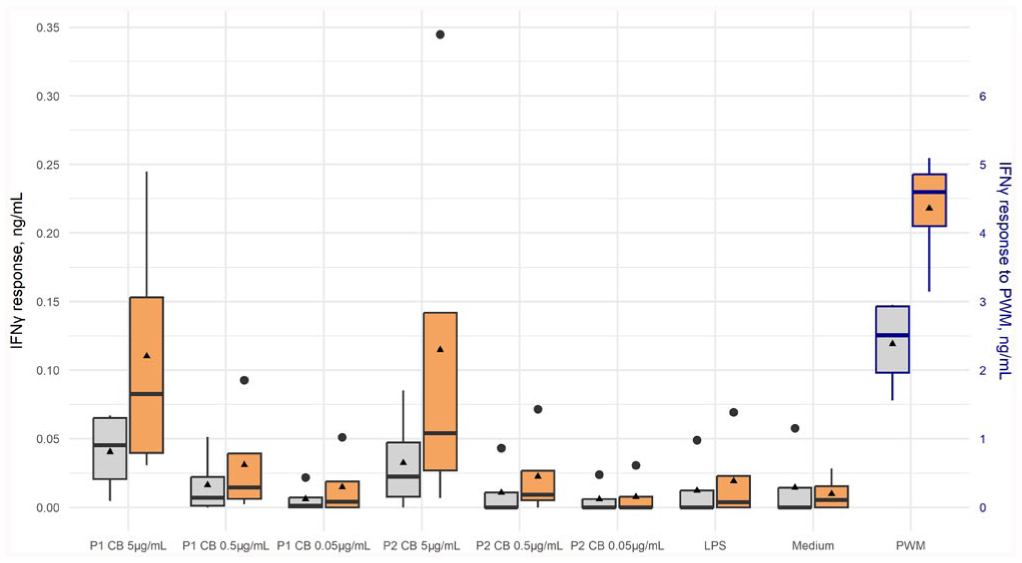
Box-and-whisker plot of the interferon-gamma (IFNγ) response to Coxiella burnetii antigen at various dilutions and incubation times in cattle whole blood from 4 cows. Whole blood was stimulated in vitro with C. burnetii phases 1 (P1 CB) and 2 (P2 CB) at concentrations of 5 μg/mL, 0.5 μg/mL, or 0.05 μg/mL and incubated for 24 h (gray) or 48 h (orange). Other stimulants included lipopolysaccharide from rough-form Escherichia coli (LPS), medium (unstimulated control), and pokeweed mitogen (PWM; positive control). Cytokine response was determined using an ELISA. Bold black lines are medians; triangles are means; large dots are outliers. IFNγ response to PWM is presented on the secondary y-axis.
Effect of incubation time on IFNγ and IL10 responses. Whole blood from 4 cows was stimulated in vitro with Coxiella burnetii phases 1 and 2 at concentrations of 5 μg/mL, 0.5 μg/mL, or 0.05 μg/mL, incubated for 24 or 48 h, then cytokine response was measured by ELISA. Results from stimulation with C. burnetii phases 1 and 2 are pooled.
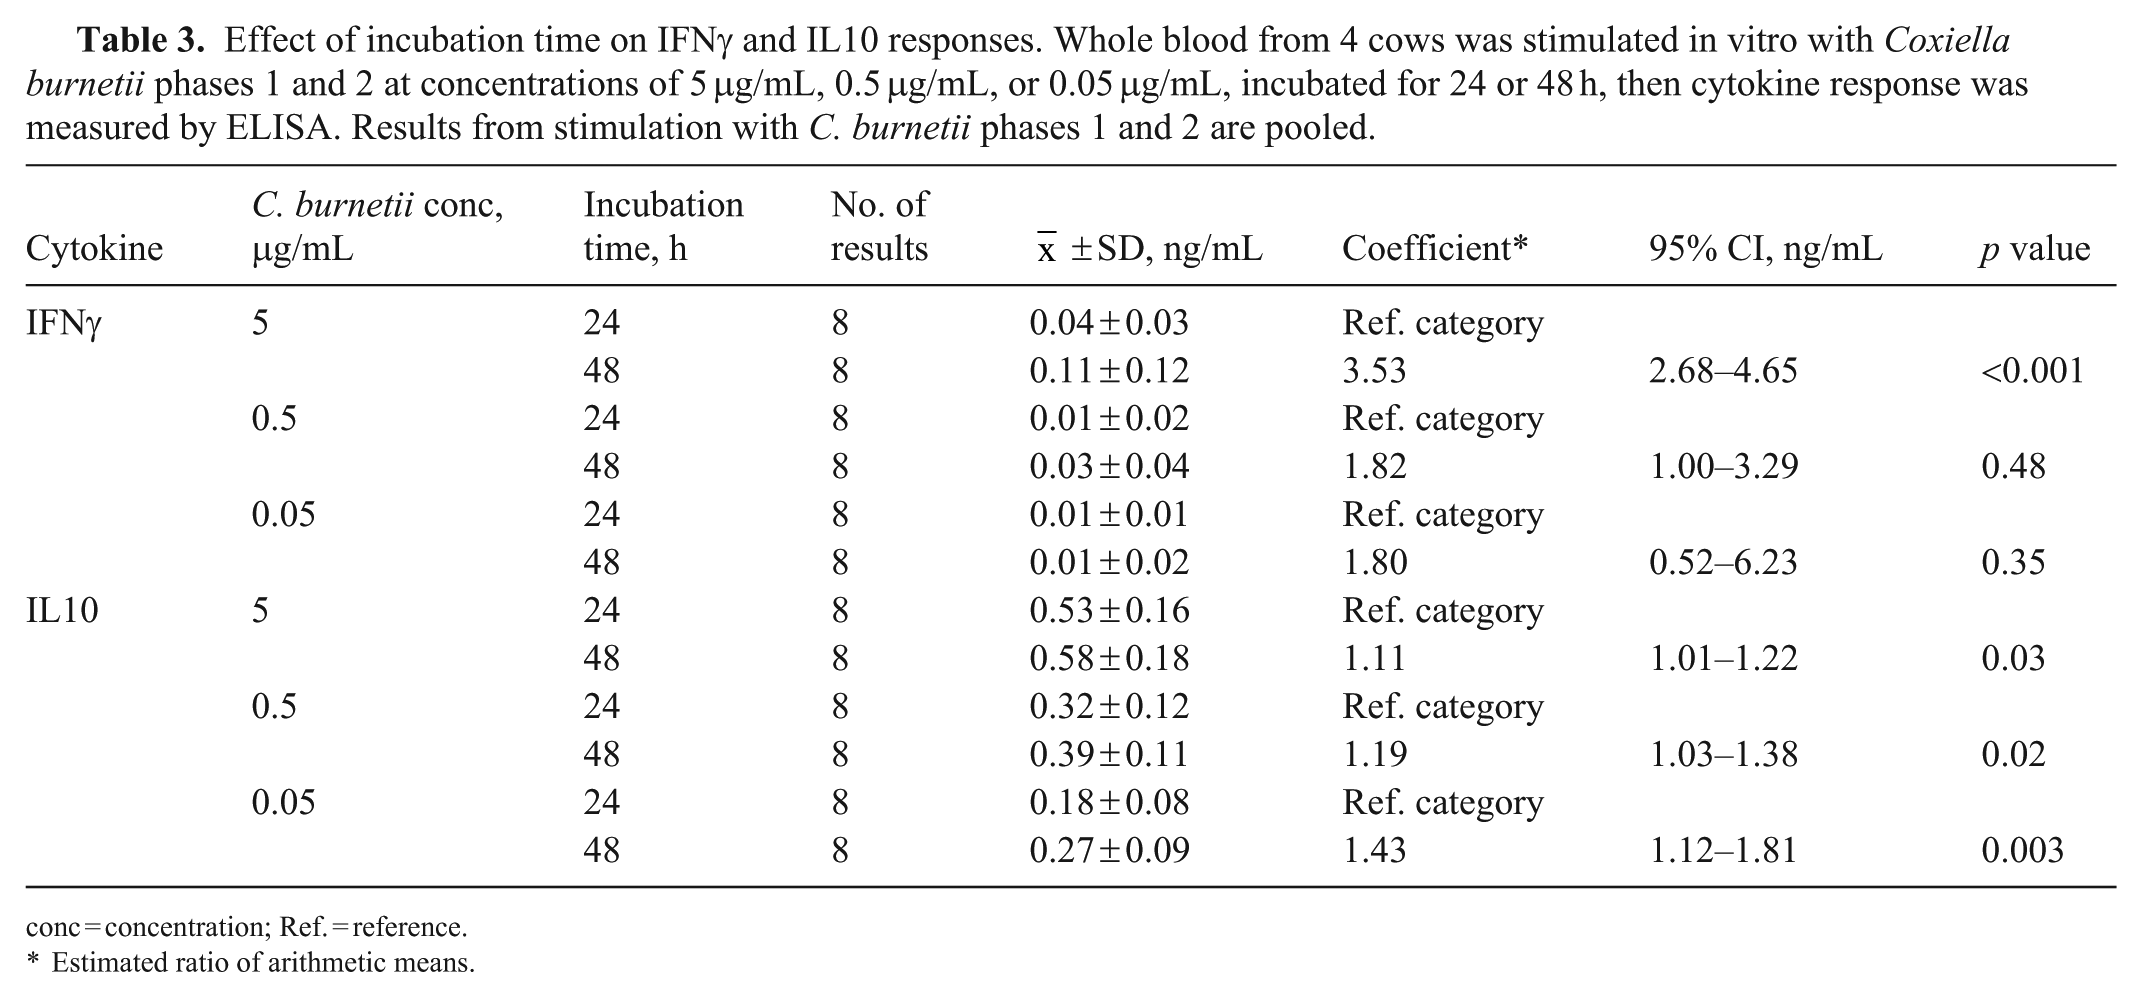
conc = concentration; Ref. = reference.
Estimated ratio of arithmetic means.
Effect of antigen concentration on IFNγ and IL10 responses. Whole blood from 4 cows was stimulated in vitro with Coxiella burnetii phases 1 and 2 at concentrations of 5 μg/mL, 0.5 μg/mL, or 0.05 μg/mL, and incubated for 24 h or 48 h, then cytokine response was measured by ELISA. Results from stimulation with C. burnetii phases 1 and 2 are pooled.
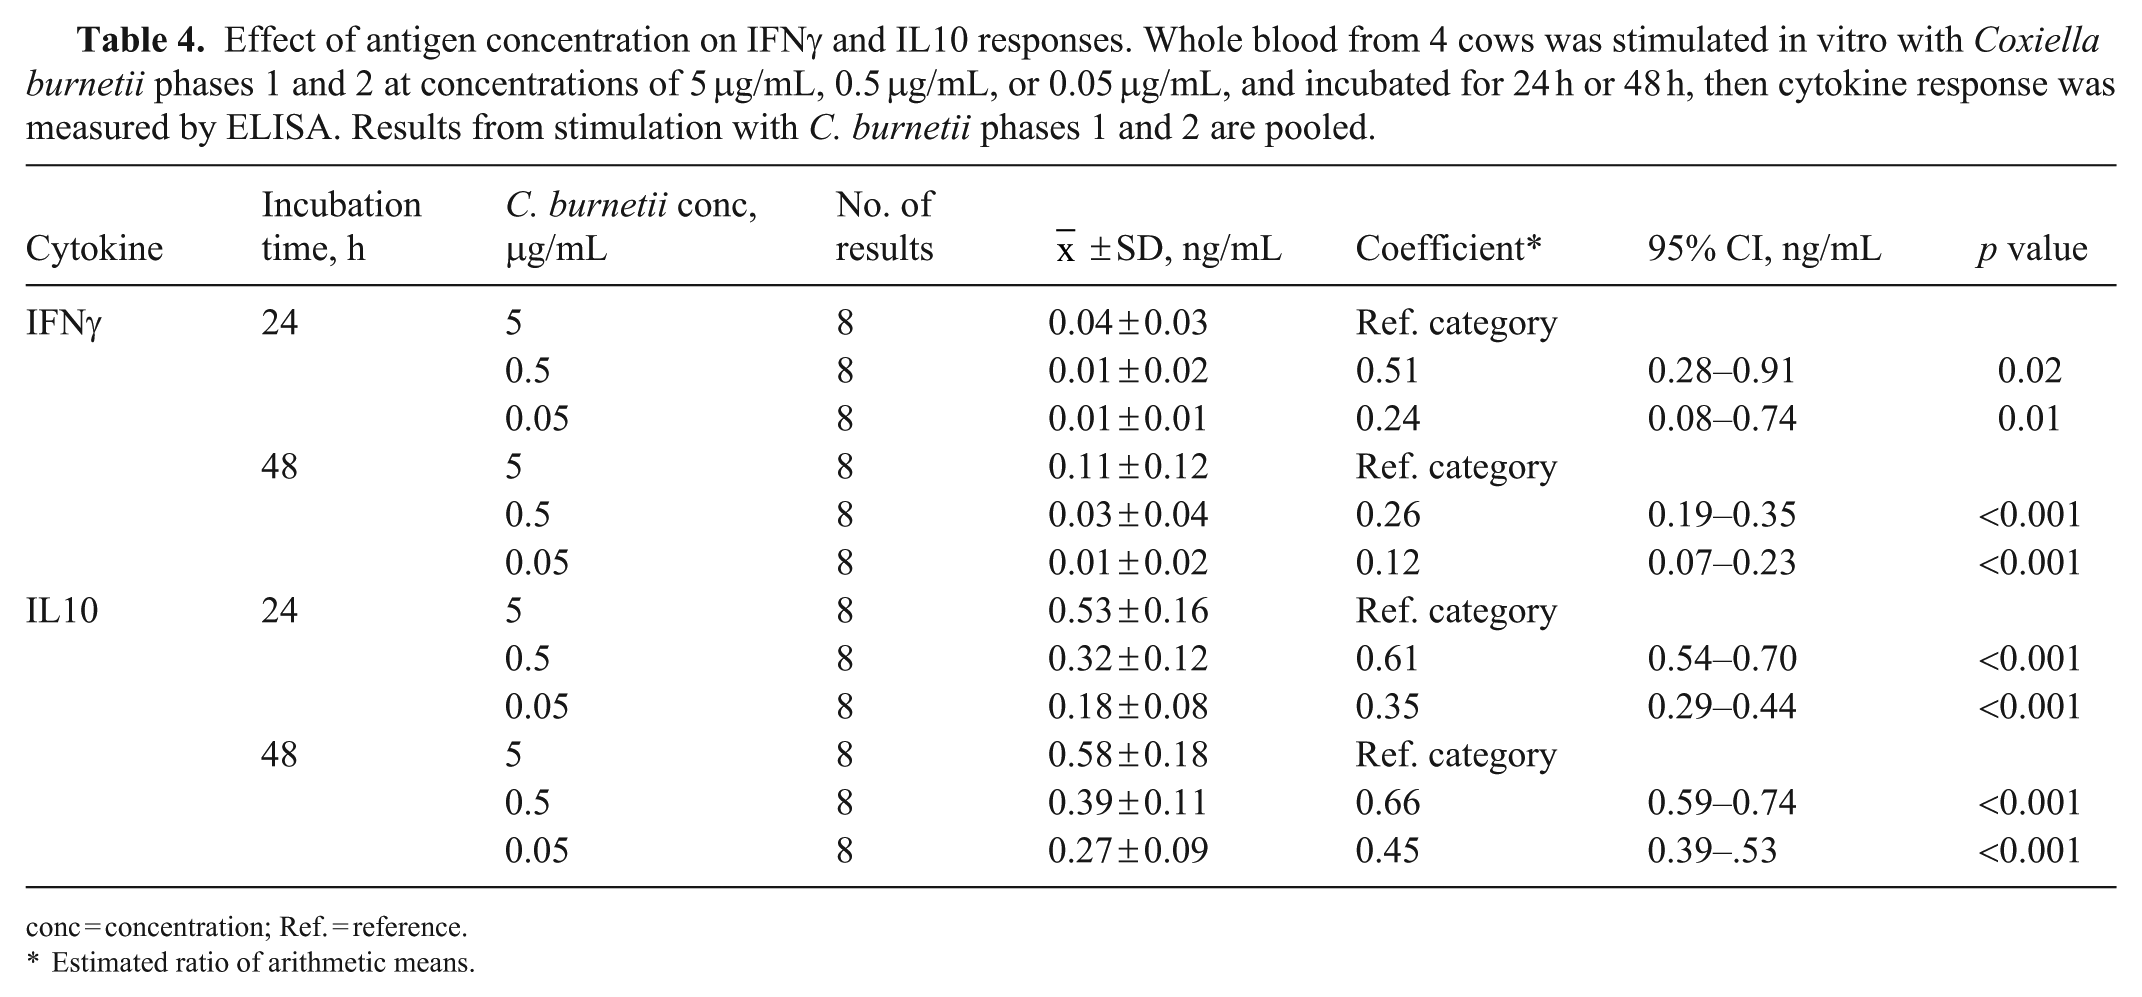
conc = concentration; Ref. = reference.
Estimated ratio of arithmetic means.
The effect of C. burnetii concentration and incubation time on IL10 response was measured in whole-blood cells collected from 4 cows. The greatest mean IL10 response to C. burnetii was elicited with the highest antigen concentration (5 μg/mL) for both C. burnetii phases 1 and 2 after stimulation for 48 h before harvesting the supernatant ( Fig. 4 ). We found a statistical interaction between the variables, co-incubation time and antigen concentration, and therefore we estimated the effect of time within concentration (Table 3), and the effect of concentration within time (Table 4). The effect of co-incubation time was significant at all concentrations (Table 3). There was a significant increase in IL10 response with increasing antigen concentrations at both co-incubation times (Table 4).
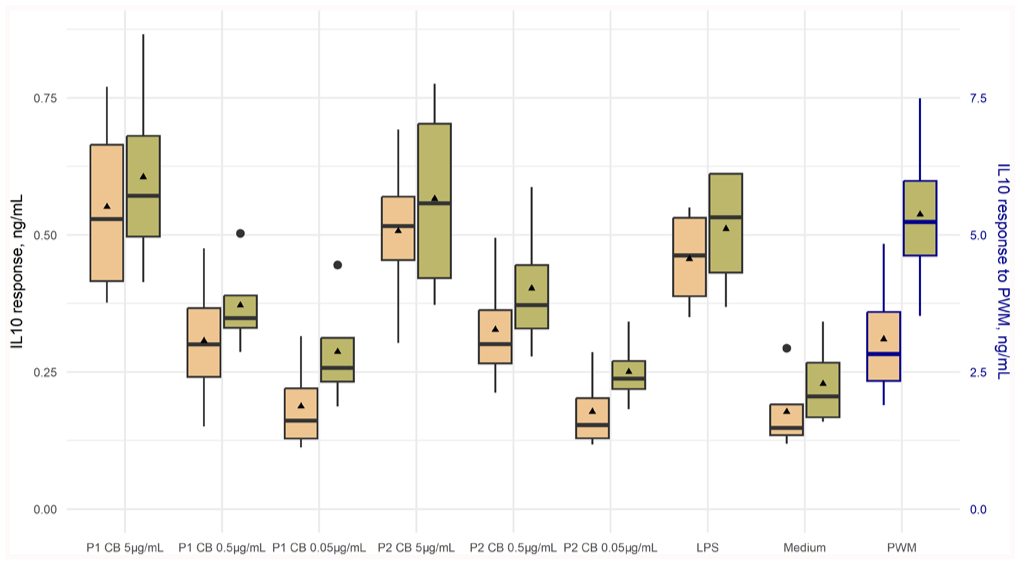
Box-and-whisker plot of the distribution of the interleukin 10 (IL10) response to Coxiella burnetii at various dilutions and incubation times in whole blood from 4 cows. Whole blood was stimulated in vitro with C. burnetii phases 1 (P1 CB) and 2 (P2 CB) at concentrations of 5 μg/mL, 0.5 μg/mL, or 0.05 μg/mL and incubated for 24 h (yellow) or 48 h (green). Other stimulants included lipopolysaccharide from rough-form Escherichia coli (LPS), medium (unstimulated control), and pokeweed mitogen (PWM; positive control). Cytokine response was determined using an ELISA. Bold black bars are medians; triangles are means; large dots are outliers. Cytokine response to PWM is presented on the secondary y-axis.
INFγ and IL10 response to phase 1 C. burnetii in dairy cattle through lactation from calving to ~8 wk post-calving
The IFNγ and IL10 response was compared in whole blood collected from 46 cows at 2 times during their lactation (i.e., 1–3 d post-calving and at ~8 wk post-calving [or 45–60 d in milk];
Figs. 5
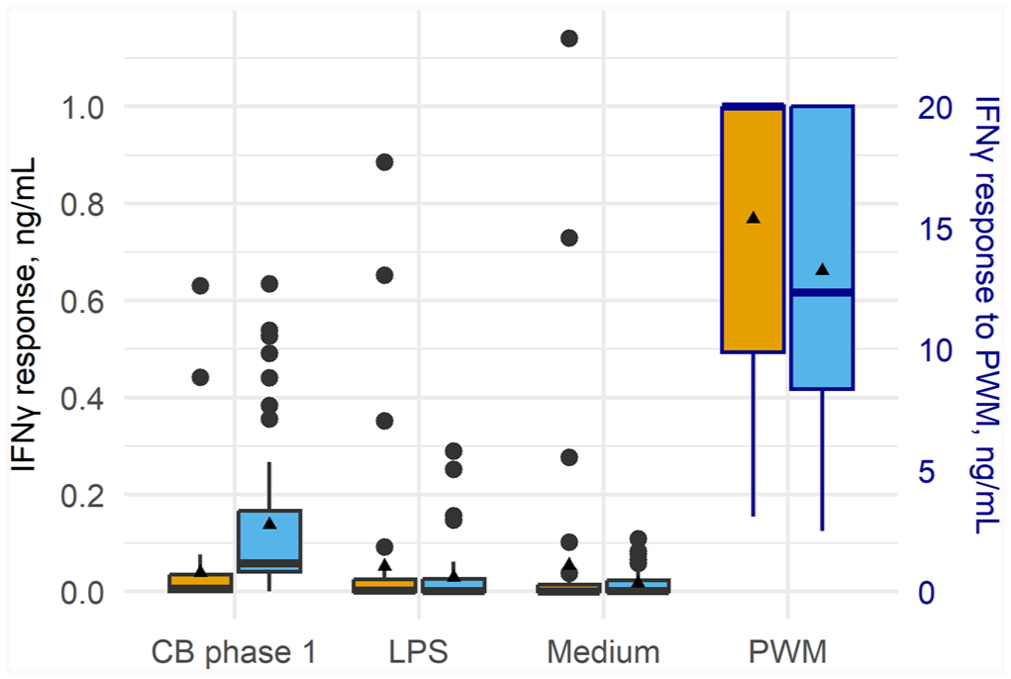
Box-and-whisker plot of the distribution of the interferon-gamma (IFNγ) response (ng/mL) of whole blood collected from 46 Australian dairy cows sampled at calving (yellow) and ~8 wk post-calving (blue). Whole blood was stimulated in vitro with Coxiella burnetii (CB) phase 1, lipopolysaccharide from rough-form Escherichia coli (LPS), pokeweed mitogen (PWM; positive control), or medium (unstimulated control). Cytokine response was determined using ELISA. Thick bars are medians; triangles are means; large dots are outliers. Cytokine response to PWM is presented on the secondary y-axis.
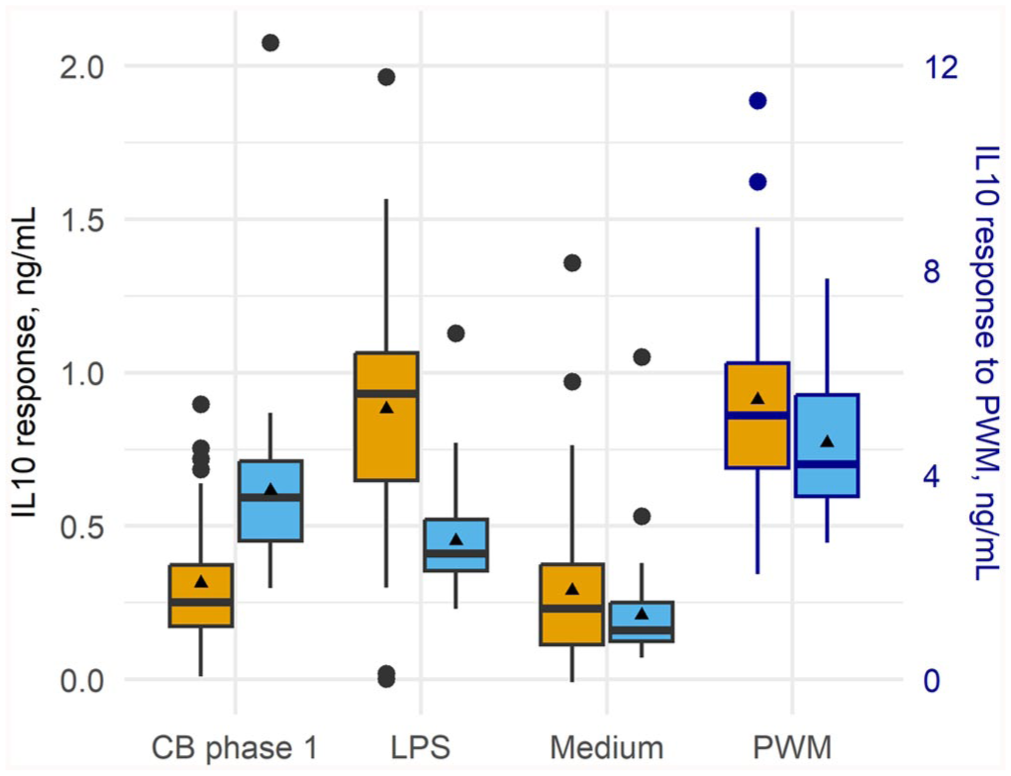
Box-and-whisker plot of the distribution of the interleukin 10 (IL10) response (ng/mL) of whole blood collected from 46 Australian dairy cows sampled at calving (yellow) and ~8 wk post-calving (blue). Whole blood was stimulated in vitro with Coxiella burnetii (CB) phase 1, lipopolysaccharide from rough-form Escherichia coli (LPS), pokeweed mitogen (PWM; positive control), or medium (unstimulated control). Cytokine response was determined using ELISA. Thick bars are medians; triangles are means; large dots are outliers. Cytokine response to PWM is presented on the secondary y-axis.
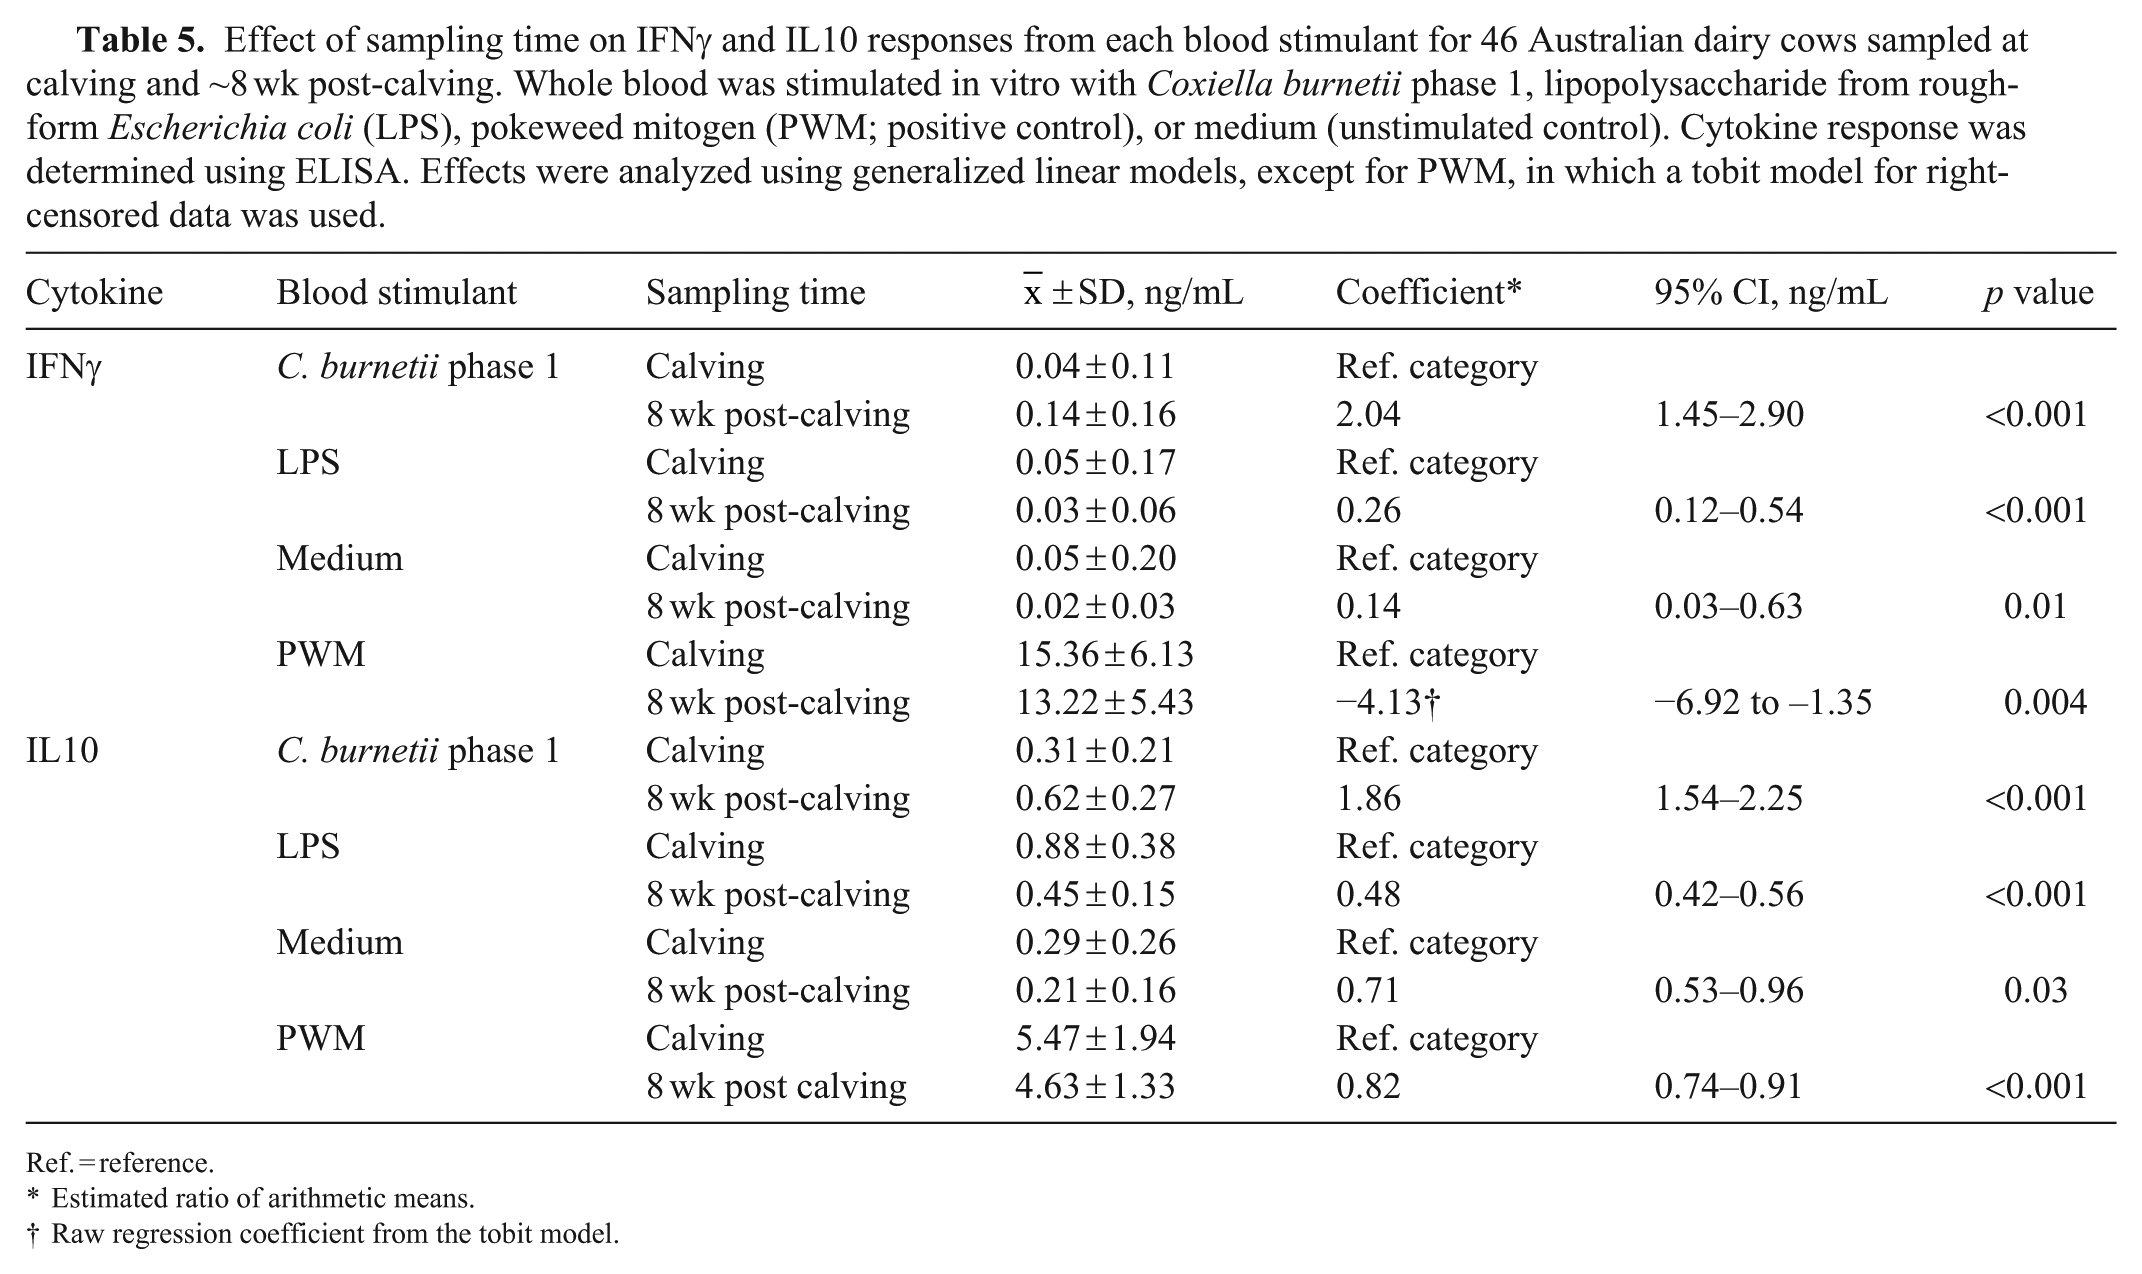
Effect of sampling time on IFNγ and IL10 responses from each blood stimulant for 46 Australian dairy cows sampled at calving and ~8 wk post-calving. Whole blood was stimulated in vitro with Coxiella burnetii phase 1, lipopolysaccharide from rough-form Escherichia coli (LPS), pokeweed mitogen (PWM; positive control), or medium (unstimulated control). Cytokine response was determined using ELISA. Effects were analyzed using generalized linear models, except for PWM, in which a tobit model for right-censored data was used.
Ref. = reference.
Estimated ratio of arithmetic means.
Raw regression coefficient from the tobit model.
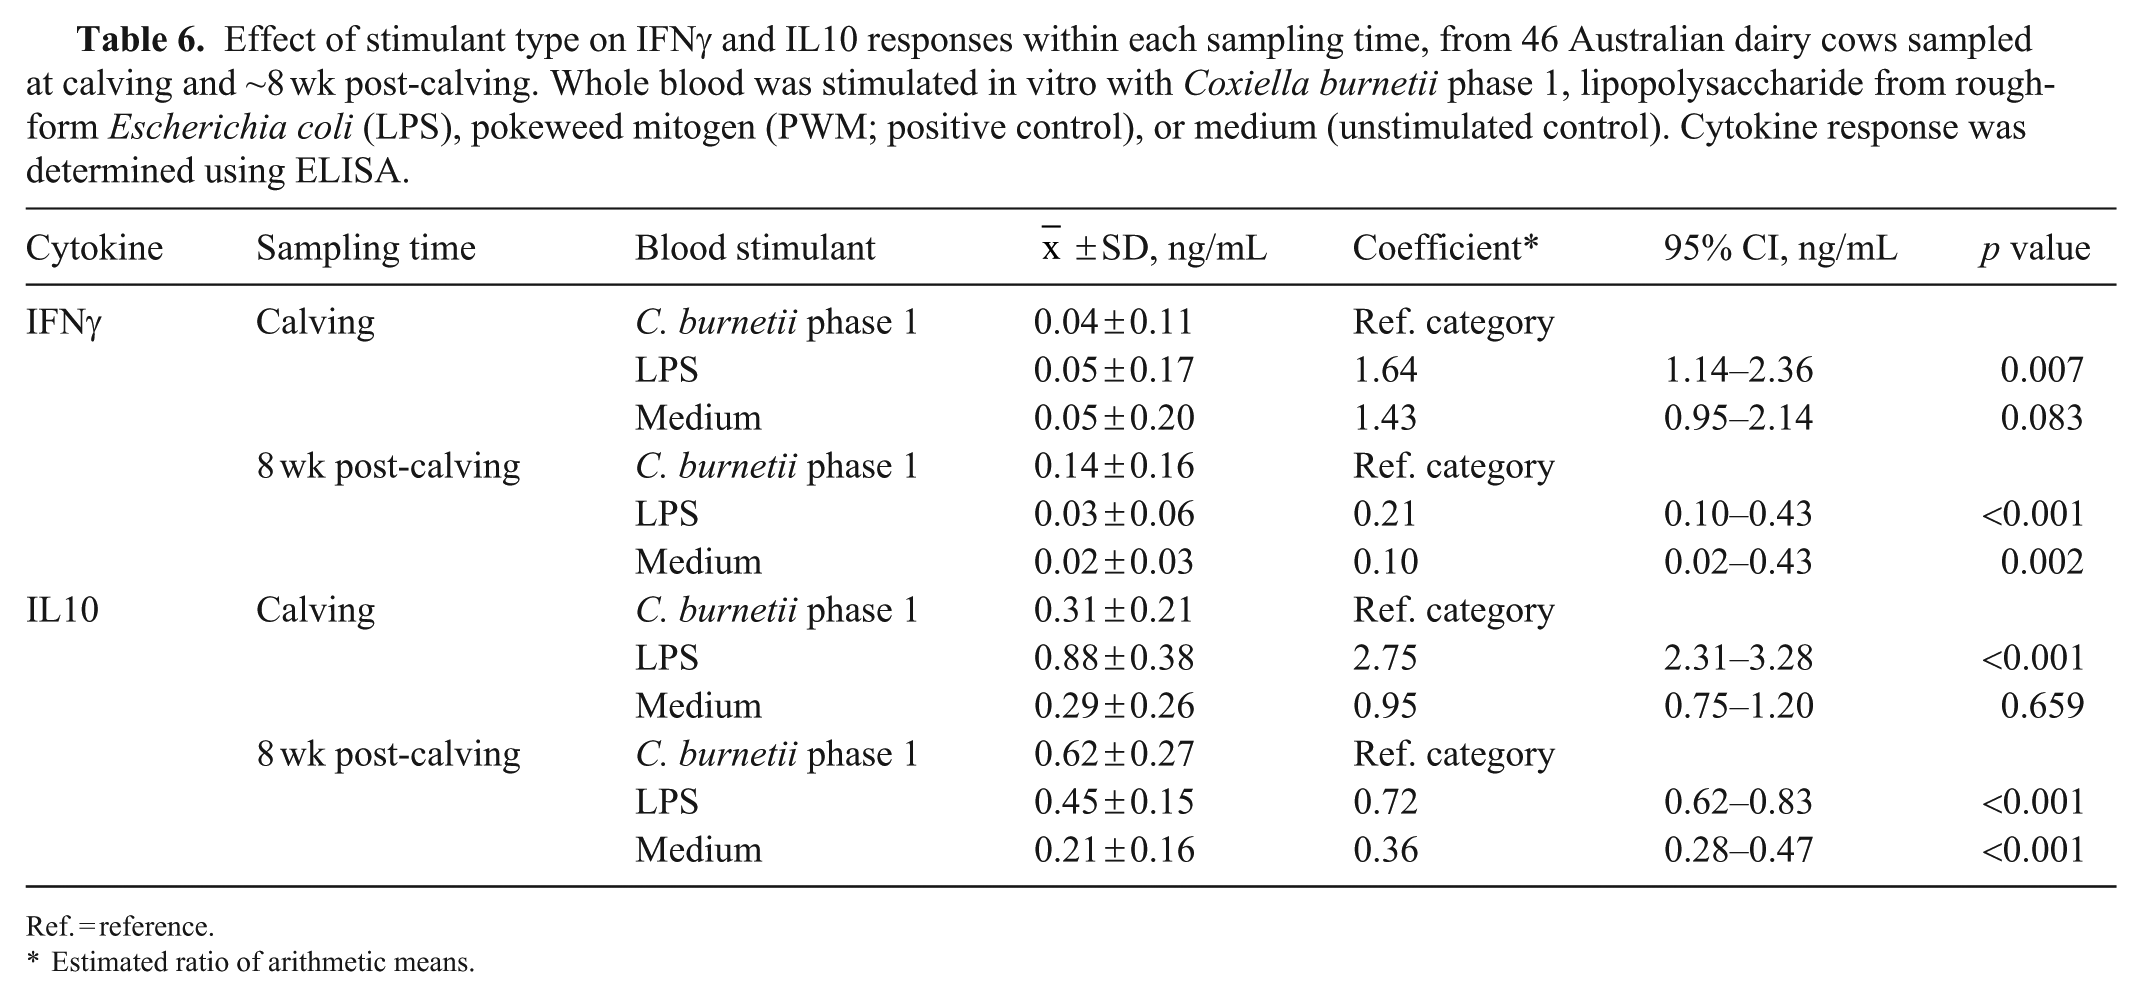
Effect of stimulant type on IFNγ and IL10 responses within each sampling time, from 46 Australian dairy cows sampled at calving and ~8 wk post-calving. Whole blood was stimulated in vitro with Coxiella burnetii phase 1, lipopolysaccharide from rough-form Escherichia coli (LPS), pokeweed mitogen (PWM; positive control), or medium (unstimulated control). Cytokine response was determined using ELISA.
Ref. = reference.
Estimated ratio of arithmetic means.
The mean IFNγ response to C. burnetii phase 1 antigen stimulation significantly increased by 2.04 times between calving and 8 wk post-calving (Table 5). The median IFNγ response to LPS and medium at calving and 8 wk post-calving were similar (Fig. 5), although there were stronger outlier values for both LPS and medium at calving and a significant decrease in mean response between the 2 times (Table 5). For PWM, there was a significant reduction in mean IFNγ response between calving and 8 wk post-calving (Table 5).
When examining the effect of stimulant type within each time, at calving, there was no significant difference between the IFNγ response to C. burnetii phase 1 and the medium (Table 6). The median response to C. burnetii and LPS was also similar at calving (Fig. 5), although there were stronger outlier values for LPS, and a significantly higher mean response to this stimulant compared to C. burnetii (Table 6). In contrast, by 8 wk post-calving, the response to C. burnetii was significantly higher compared to medium and LPS (Table 6).
For IL10, the mean response to C. burnetii phase 1 antigen stimulation significantly increased by 1.86 times between calving and 8 wk post-calving (Table 5). The mean IL10 response to medium, LPS, and PWM significantly decreased between calving and 8 wk post-calving (Table 5).
At calving, there was no significant difference between the IL10 response to C. burnetii and medium; the mean response to LPS was 2.75 times higher compared to C. burnetii (Table 6). In contrast, by 8 wk post-calving, the response to C. burnetii was significantly higher compared to medium and LPS (Table 6).
Correlation between cytokine response to C. burnetii phase 1 and phase 2 stimulation
The correlation between the cytokine response for 169 cows in the whole-blood assay following stimulation with C. burnetii phases 1 and 2 was examined at the ~8 wk post-calving sampling time (or 45–60 d in milk; Fig. 7A , 7B). There was a positive correlation between IFNγ responses to C. burnetii phases 1 and 2 (ρ = 0.84, 95% CI [0.79–0.89]; p < 0.001; Fig. 7A). There was a close positive linear correlation between IL10 response to C. burnetii phase 1 and phase 2 stimulation (ρ = 0.91, 95% CI [0.89–0.94]; p < 0.001; Fig. 7B).
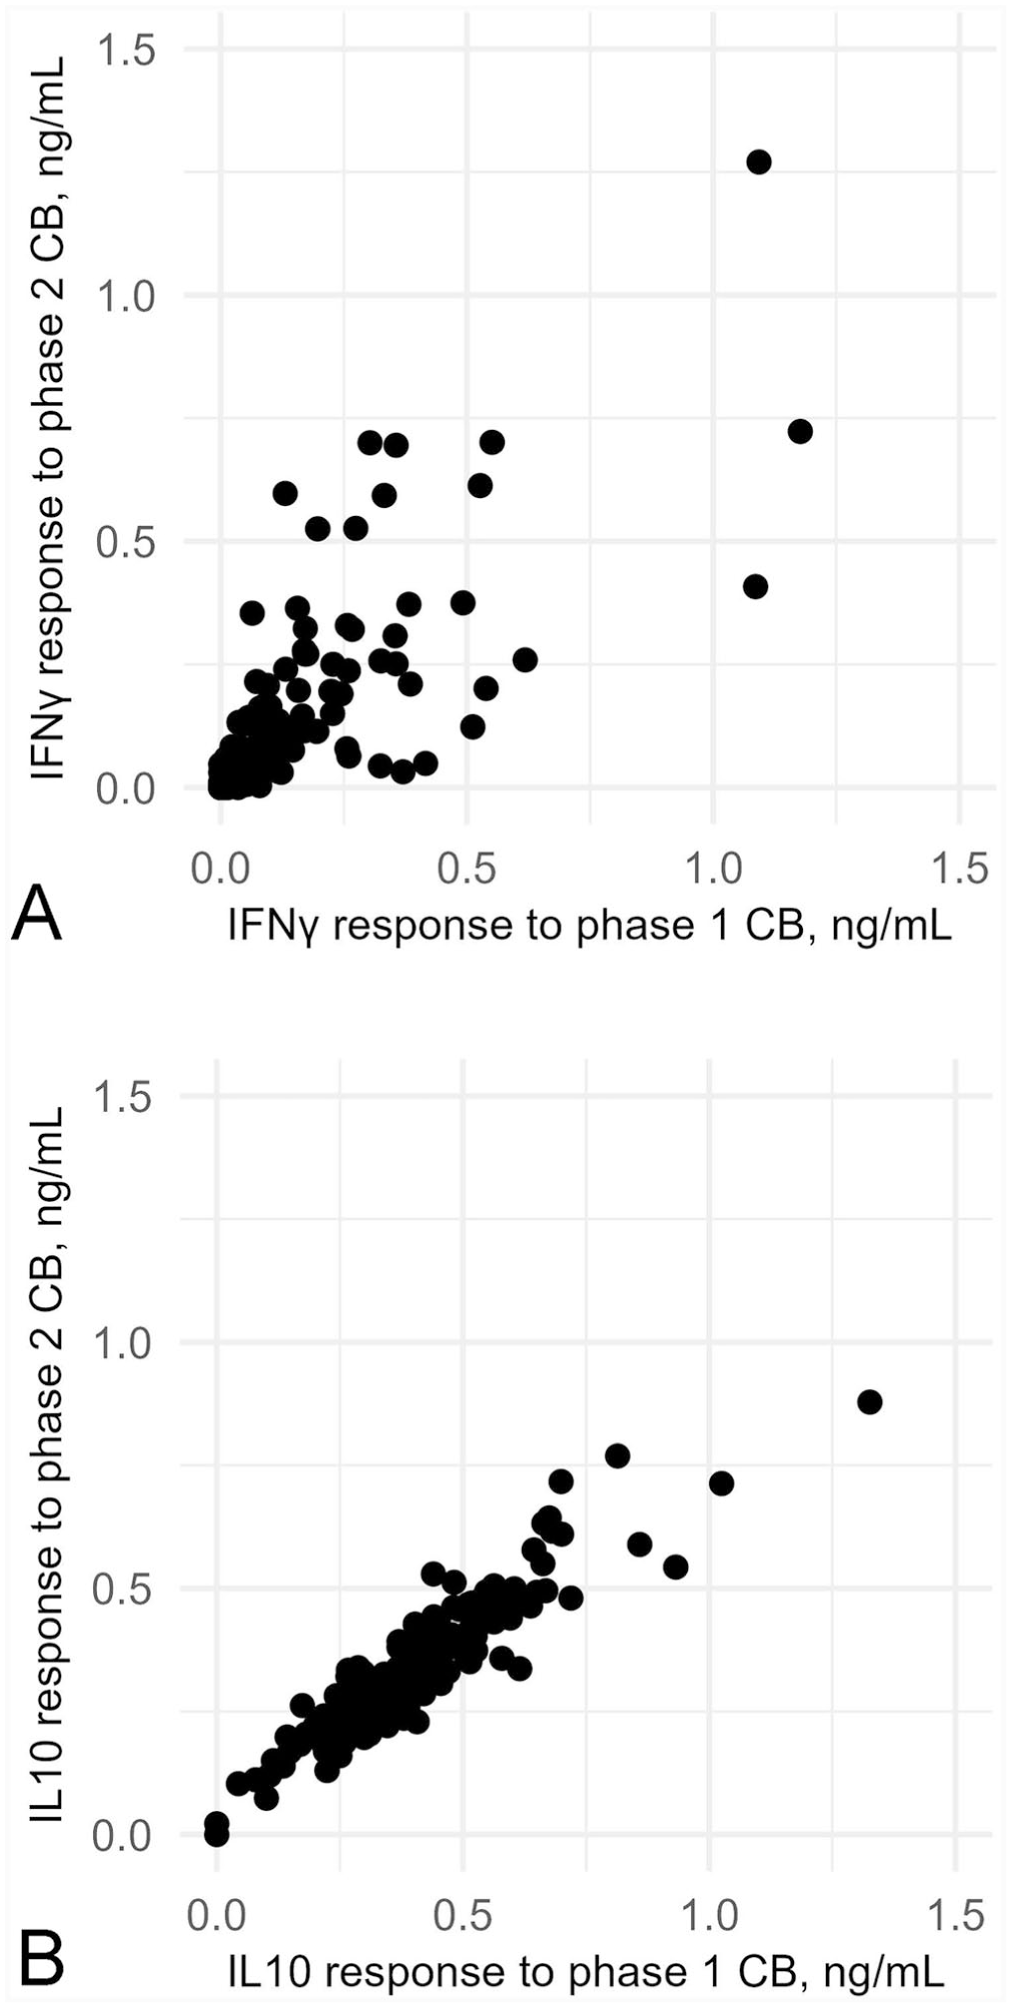
Scatter plots of associations between cytokine response (ng/mL) from cattle whole blood stimulated in vitro with Coxiella burnetii (CB) phase 1 or phase 2 for 169 Australian dairy cows measured at ~8 wk post-calving:
Correlations between cytokine response to C. burnetii when described as S:P ratio and as ng/mL
There were close positive linear relationships between IFNγ responses when described as an S:P ratio (%) and as ng/mL to C. burnetii phase 1 (ρ = 0.97, 95% CI [0.95–0.98]; p < 0.001) and phase 2 (ρ = 0.97, 95% CI [0.95–0.98]; p < 0.001;
Fig. 8A
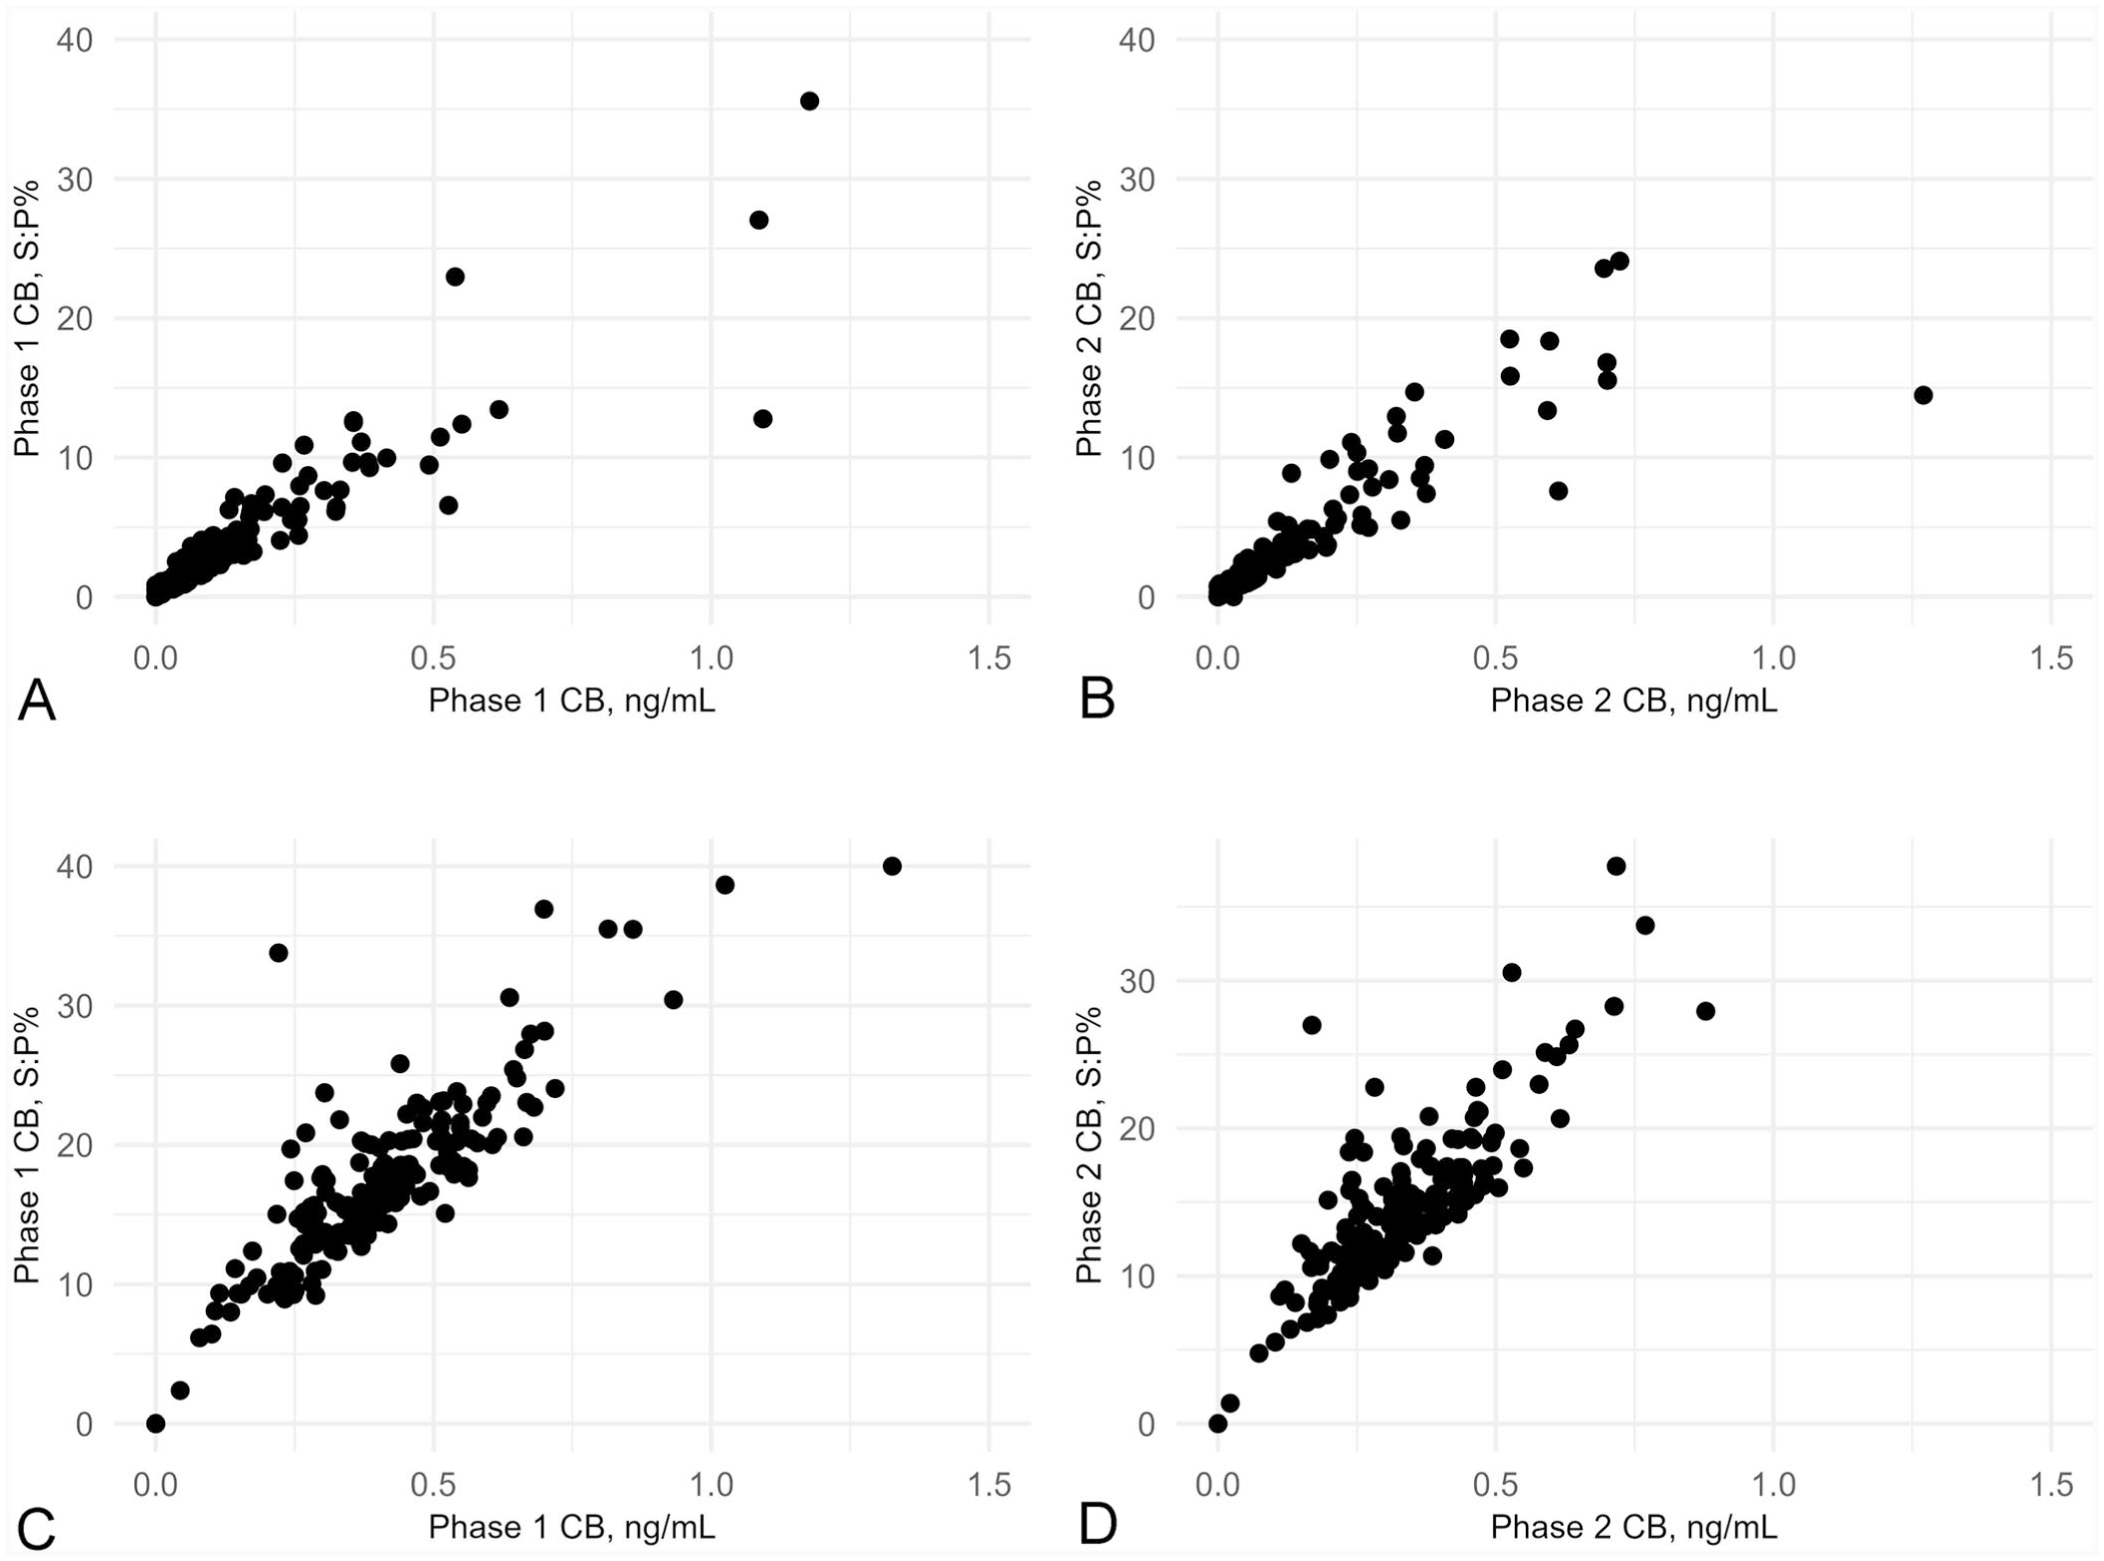
Scatter plots of associations between cytokine response to Coxiella burnetii (CB) phases 1 and 2 when presented as a sample:positive ratio (S:P ratio [%]) or in ng/mL for
Discussion
In our study in cattle, we found a higher IFNγ and IL10 response to the positive control PWM and C. burnetii antigen from samples that were transported at ambient temperature compared to transportation on ice, possibly indicating that the lower temperature impacts cell viability. Refrigeration before and after transportation on ice is logistically difficult, more costly, and likely holds little benefit in preventing bacterial overgrowth, given that blood is generally a sterile sample. Additional temperature ranges were tested in the MAP IFNγ recall assay in sheep, and storing samples at 37°C during transport led to a greater antigen-specific response, but only if the antigen was added immediately after collection. 6 It is not known if similar responses will also occur in cattle. The addition of stimulants on-farm and warming of samples during transport was beyond the scope of our study.
We also evaluated whether the length of incubation of whole-blood samples with stimulants impacted the cytokine response and found that a 48-h co-incubation led to higher PWM-induced and C. burnetii–induced IFNγ and IL10 responses compared to a 24-h co-incubation; the same trend was also apparent for the LPS-induced IL10 response. We did not investigate incubation times beyond 48 h; however, paratuberculosis work in sheep found a decrease in the IFNγ response to MAP antigen and positive control concanavalin A at 48–72 h. 6 Similarly, in humans, longer co-incubations lead to a higher IFNγ response following PWM but not C. burnetii antigen stimulation. 29 Although longer incubations may further increase the detectable cytokine response, the potential benefit must be weighed against the additional time required to acquire results, a matter of particular importance if adapting this assay for field application.
At calving, the difference between the mean response to C. burnetii and the unstimulated control was negligible for both IFNγ and IL10, despite a large response to the PWM control confirming cellular viability. This finding is consistent with studies that have shown downregulation of CMI around parturition in dairy cows. 34 The mean IFNγ and IL10 responses to the positive control T- and B-cell stimulant, PWM, were significantly higher at calving compared to 8 wk post-calving, and the IL10 response to the innate immune system mitogen, LPS, was higher at calving. These results may indicate that the T-cell, B-cell, and innate immune system responses are not dampened at parturition relative to ~8 wk post-calving and suggest that it is possible that there is a C. burnetii–specific downregulation in some pro-inflammatory cytokines at calving. Alternatively, the mitogens may induce an artificial response that is suitable as a positive control for determining cell viability but not for capturing physiologically driven changes in immune response.
As both phases 1 and 2 C. burnetii antigens have been used in human 20 and goat 25 Q fever research, we tested both antigens in the cattle CRA. The phase 1 cell is the only phase found in natural infection of immunocompetent hosts 11 and is used in the commercial cell-mediated assay (Q-detect; Innatoss Laboratories) that is available for use in humans. The phase 2 cell is considered avirulent due to a truncation in the LPS O-antigen region following serial passage of phase 1 cells in culture, 1 but has still been used in cattle and human studies, with some studies reporting a stronger IFNγ response following stimulation with phase 2 antigen.18,20,25 Although we found a close correlation between the IFNγ response to phase 1 and phase 2 antigen in each cow, the minor differences suggest that the variation in the O-antigen region of LPS may influence the response, as has also been proposed in work assessing individual IFNγ responses of humans. 18 The rough E. coli LPS control was assessed and found to result in a lower mean IFNγ response compared to whole-cell C. burnetii. A minimal response to the region of LPS conserved across bacterial species (i.e., lipid A and core) was unsurprising given that the predominant cells producing IFNγ in the recall assay in human studies are T cells (mainly CD4 T cells), and this is thought to result from recognition of highly specific C. burnetii cell surface proteins.23,31 However, the O-antigen region of C. burnetii LPS could still contribute indirectly to the cytokine response, including first by influencing the level of exposure of antigenic surface proteins because the truncation of the O-antigen side chains in phase 2 LPS may allow for increased accessibility to proteins in the bacterial cell wall. 16 Second, the virulent phase 1 LPS may help downregulate pro-inflammatory cytokines, a theory that is supported by in vitro studies that have shown that the 2 phases bind different human macrophage uptake receptors, subsequently leading to short-term intracellular survival of phase 2 compared to phase 1. 8 Cows may vary in their response to these different antigenic phases, which could explain the minor differences between response to C. burnetii phases 1 and 2 on the individual level. Future research should be directed toward further understanding the physiologic relevance of using the laboratory-produced phase 2 cellular antigen to assess responses in natural C. burnetii infection in cattle, as this may prove useful in distinguishing different disease states when used in conjunction with phase 1 or in assessing responses to vaccines that rely on one or the other C. burnetii phase.
For IL10, there was a close correlation between the responses to C. burnetii phases 1 and 2 and a stronger response to the LPS control compared to IFNγ. In combination, these results indicate that the most highly conserved region of the LPS (lipid A and core), present on both C. burnetii phases and in the LPS control, likely contributes in a nonspecific manner to IL10 production, possibly via binding to toll-like receptor 4 (TLR4) on monocytes as part of the innate immune system. 32 Indeed, human Q fever research identified monocytes as the most common producers of IL10 following stimulation of PBMCs by C. burnetii. 23 Although the exact reason for the strong LPS-induced IL10 response of the cattle is unknown, significant systemic increase in IL10 response to cows intramammary-challenged with E. coli LPS was suggested to reflect a protective mechanism against excessive inflammation. 10 Studies that investigate pathogenesis of coxiellosis in cattle utilizing IL10 assays should include an LPS control due to the ubiquitous exposure to gram-negative bacteria in the dairy setting and, as such, the potential for cross-reactivity. The contrast in results for IL10 compared to IFNγ highlights the importance of optimizing assays for each cytokine and the value in understanding the whole-blood dynamics that govern immune responses when interpreting results. Studies using the CRA for measuring IFNγ response to both C. burnetii and MAP antigen in cattle successfully increased the IFNγ response by blocking the activity of IL10 with an anti-IL10 monoclonal antibody.5,7 However, we were interested in monitoring the actual IFNγ response of cows over time and how this response could contribute to the pathogenesis of coxiellosis, and therefore we decided not to block the activity of IL10 and instead to measure the natural IL10 response.
Although the use of rough E. coli LPS as a control has, to some extent, supported the specificity of the assay for C. burnetii, given that there are LPS components conserved across bacterial species, future research could be directed toward investigating the specificity of the assay regarding other conserved antigens across bacterial species, given the use of whole cells in our assay. Alternatively, specific C. burnetii antigens could be used rather than whole cells to further limit the potential for cross-reactivity with closely related bacterial species.
Footnotes
Acknowledgements
We thank the dairy producers for allowing access to their cattle for sample collection and for assistance with sampling. The authors appreciate the laboratory assistance of Anna Waldron, Slavika Patten, and Zhou Mei Zheng, and the statistical assistance from Dr. John Morton. We also appreciate the contribution to discussions from members of the University of Sydney Q fever research team (including Drs. Sam Rowe and Ruth Zadoks).
Declaration of conflicting interests
The authors declared no potential conflicts of interest with respect to the research, authorship, and/or publication of this article.
Funding
This work was supported by a Meat & Livestock Australia Donor Company Limited grant (P.PSH.1307).