
Abstract
Bone marrow (BM) samples in dogs are typically acquired from hematopoietically active trabecular BM at appendicular skeletal sites, such as the proximal humerus and femur, or axial skeletal sites, such as pelvis, sternum, and rib. Suitability for in vivo biopsy varies by site, but equivalency of BM composition at different sites is uncertain. We sought to determine whether the composition of BM is comparable in humerus, ilium, rib, and sternum. Samples from each site were obtained within 24 h after death from 30 dogs with spontaneous disease submitted for postmortem examination. Tissues were fixed in acetic acid–zinc–formalin, demineralized with EDTA, and assessed by 4 independent raters for hematopoietic cellularity, granulocytic:erythrocytic (G:E) cell ratio, megakaryocyte (MKC) number, and presence of hemosiderin. Statistical analysis showed lower cellularity, MKC number, and hemosiderin in ilium than in rib, higher cellularity in rib and sternum than in humerus and ilium, and lower G:E cell ratio in rib than in humerus (p < 0.05). Analysis of covariance indicated that most differences between sites were attributable to individual animal variation rather than site or rater. Differences overall were of small magnitude, and values for each parameter were similar to those reported in healthy younger dogs. We concluded that samples from any of the 4 sites are suitable to approximate composition of BM at the other sites.
Keywords
Assessment of bone marrow (BM) is an important component of investigating hematologic abnormalities, identifying infectious agents with tropism for hematopoietic tissue, detecting neoplasms that are metastatic or infiltrative in BM, and other conditions such as metabolic, toxic, or immune effects on hematopoiesis. In young individuals, most medullary bone sites are hematopoietically active, but with maturation into adulthood, hematopoiesis is progressively concentrated in bones of the axial skeleton that have a trabecular bony network, such as the skull, vertebrae, ribs, sternebrae, and pelvis, and in the proximal region of long bones, such as the femur and humerus. 20 Common sites in dogs for in vivo acquisition of BM aspirate biopsies are the humerus, iliac crest, sternum, femur, and the costochondral junction.6,8,10 Choice of site is largely based on operator preference and patient body condition score and size, and whether an aspirate and core biopsy, or only an aspirate biopsy, will be acquired. The sternum and costochondral junction are only suitable for aspirates, whereas both aspirate and core biopsies may be obtained from the other sites. The proximal humerus rather than the ilium is considered more suitable for core biopsies in small dogs. 1
It is generally assumed that the composition and activity of BM are similar at all sites with active hematopoiesis based on several methodologically distinct investigations. In humans, erythropoiesis was similar across different BM sites based on the balance of radioactively (59Fe or 52Fe) or otherwise labeled iron uptake and excretion.9,13,21 However, such ferrokinetic methods have limitations because the availability of injected iron for erythropoiesis is modulated by the concentration of iron-binding plasma proteins, such as transferrin and ferritin, and the quantity and nature of iron stores such as hemosiderin. Furthermore, ferrokinetic methods only assess erythropoiesis, and not granulopoiesis or thrombopoiesis.
More recently employed techniques utilize positron-emitting tomography (PET) by itself or combined with computed tomography (PET-CT) or magnetic resonance (PET-MR) to measure cell proliferation and cell metabolic activity. Among these, the radioactive thymidine analogue 3′-deoxy-3′- 18 F-fluorothymidine ( 18 F-FLT) is phosphorylated by thymidine kinase following entry into cells, and is trapped in newly synthesized DNA in lieu of endogenous thymidine. The half-life of 18F-FLT is ~110 min.4,15 Capture and analysis of regional 18F-FLT signals from whole-body scans in humans were useful to identify variable cell proliferation in hematopoietic compartments and to distinguish extramedullary from intramedullary hematopoiesis in conditions such as myelodysplastic syndrome and atrophic (aplastic) anemia. However, methods vary for image capture and reconstruction, incorporation of bone signal attenuation, and consideration of bone attenuation in signal analysis. Furthermore, tissues with high proliferative rates, such as the intestinal tract, must be excluded from analysis. 17 Focal lesions due to inflammation or bone remodeling may yield false-positive results, and measurement of DNA synthesis is not equivalent to identifying hematopoietic proliferating cells. 3
Radiotracing with 18F-FLT and PET-CT was used to evaluate hematopoiesis in 6 healthy dogs 3–6-y-old. 12 Signal capture and analysis of 11 skeletal regions-of-interest (ROIs) indicated that the highest proportion of proliferating cells was in the thoracic vertebrae, followed by the lumbar vertebrae, and then the proximal humerus. Signals from the proximal humerus were limited to a narrow region of approximately one third of the proximal metaphysis, those from the proximal femur were relatively weak, and those from sternebrae were less intense than the humerus but more uniform across the ROIs. The study yielded results suggestive of heterogeneity among hematopoietic sites in healthy dogs. However, given that only 6 individuals were assessed, and 2 different doses were utilized, results could not be evaluated statistically or across different ages. Furthermore, information on dogs with hematologic or other diseases was not derived.
Cell metabolic (rather than proliferative) activity can be measured with radioactive agents such as 18fluorine-deoxyglucose ( 18 FDG), a glucose analogue. Administration of 18FDG allowed sensitive and specific detection of focal BM involvement in human patients with diffuse large-B-cell lymphoma and Hodgkin lymphoma.2,14 The radiotracer accumulates in cells with high glucose demand, such as tumors and inflammatory cells, but is not considered suitable for detecting hematopoiesis, BM infiltrative or metastatic neoplasms, or leukemias. Neither of the radiotracer methods are comparable to ferrokinetic methods.
In a study of histologic and cytologic assessment of BM samples collected postmortem from the proximal humeri and iliac crests of dogs estimated to be healthy and adult, hematopoietic activity (“cellularity”) was not determined, but sample quality, iron stores, and cell composition were compared across sites. 8 The results are therefore not comparable to the imaging-based assessment of hematopoiesis but showed differences in the granulocytic:erythrocytic (G:E) cell ratio by the method of assessment and site, and a higher G:E cell ratio in samples from the iliac crest relative to the humerus. The difference observed in the G:E cell ratio between methods of assessment is difficult to reconcile because samples from the same site were analyzed. Other sites commonly sampled in vivo, such as the sternum, were not included. We use the term G:E cell ratio herein to convey that all hematopoietic cells are “myeloid,” that granulocytes and their precursors comprise >98% of BM leukocytes, and that monocytes and precursors are rare and inconsistently identifiable.11,19 The term myeloid:erythroid ratio (MER) is also commonly used and refers to leukocytes as the “myeloid” component. 8
It remains uncertain whether there are significant differences in the quantity and quality of hematopoiesis at different sites in dogs with a range of clinical conditions. Therefore, we sought to determine whether samples from 4 sites that are suitable for in vivo sampling yield comparable results. We hypothesized that hematopoiesis is similar at the different sites.
Materials and methods
Cases
Samples were obtained from 30 dogs that were euthanized (n = 29) or died naturally (n = 1), and submitted for postmortem examination. Inclusion criteria were weight >5 kg and initiation of autopsy <24 h after death. The dogs were 1–16-y-old, weighed 6.2–62.3 kg, and included 18 females (2 intact, 16 spayed) and 12 males (2 intact, 10 castrated). The mean time-after-death until sample collection was 11.6 h (range: 1.5–24 h). None of the dogs were euthanized due to primary hematopoietic disease. Sample collection procedures were exempt from Animal Use Protocols by the Animal Care Committee of the University of Guelph because assessment of BM is part of the standard autopsy protocol.
Specimens
Samples were collected from the costochondral junction of rib 6 or 7, the dorsal iliac crest, the sternebra 3, and the craniolateral aspect of the greater tubercle of the humerus. These bones were removed from the carcass, and the soft tissue covering each bone was dissected away with a scalpel blade. After detaching the femur, the ilium was separated from the pelvic bone with rongeurs, and the iliac crest was diagonally cut with a bone saw until red marrow was visible. Each bone was then placed in a miter box for transection at ~2–3-mm intervals. 7 Imprints were prepared from red-marrow samples dissected from the greater tubercle of the humerus or the iliac crest of 3 animals. The imprint slides were air-dried, Wright-stained, and coverslipped.
Fixation and demineralization
BM samples were collected within 24 h of death from 30 dogs with spontaneous disease, fixed with acetic acid–zinc–formalin for 24 h, and then demineralized with 14% EDTA for 24 h. Samples were processed routinely by embedding in paraffin, sectioning at 2–3 µm, and staining with H&E (Animal Health Laboratory, University of Guelph, Guelph, Ontario, Canada). 7
Histomorphologic assessment
Sections were microscopically evaluated independently by 4 assessors (GML Diamantino, J Beeler-Marfisi, RA Foster, D Bienzle) with the collection site and individual animal identity anonymized. The sections were scored subjectively for cellularity (proportion of hematopoietic relative to adipose tissue; %), G:E cell ratio, megakaryocyte (MKC) number (average number per 10 fields of 0.237 mm2), and the presence of hemosiderin (0 = absent, 1 = present). BM hemosiderin was identified as brown-gold fine-to-coarse aggregates in H&E-stained sections. Prior to scoring, the 4 raters jointly reviewed 12 slides (10% of the entire set) to calibrate assessment of cellularity and identification of hemosiderin and MKCs, and to review classification of granulocytic and erythrocytic cells. Then, raters individually scored all glass slides and assigned a numerical value for each parameter. At least 10 intertrabecular spaces free of artifact were assessed.
Statistical analysis
Data were analyzed with Statistical Analysis Software (SAS 9.4), and differences were considered significant at p ≤0.05. Cellularity and G:E cell ratios were treated as binomial-like data because the data were constrained to be between 0 and 100%, and a logit transform was applied with a bias correction of 0.375 and 0.25, respectively, using Proc Mixed. Bias correction reduces bias and accommodates 0% or 100% responses. 22 Pairwise comparisons among sites were conducted using both t-tests and Tukey tests. MKC number was a count variable, and a log transform was used with a bias correction of 0.25 added first to each observation to account for the range starting at 0. Hemosiderin was a binary response (or outcome) with scores of 0 or 1 (absent or present). Then, logistic regression was performed using Proc Glimmix. All 4 responses were modeled with a fixed effect of site and random effects of rater, animal, rater*animal, and rater*site.
For cellularity, G:E cell ratio, and MKC number, residual analysis was performed to assess ANOVA assumptions. This analysis included formally assessing the residuals for normality using the 4 tests offered by SAS (Shapiro–Wilk, Kolmogorov–Smirnov, Cramer–von Mises, Anderson–Darling). In addition, the residuals were plotted against the predicted values and other variables used in the model. Such analyses may reveal outliers, unequal variances, or other issues that may require addressing. Residual analyses are uninformative for binary data such as hemosiderin. Approximate 95% CIs of parameter estimates were generated. Graphs were prepared with Prism (v.10.3.1; GraphPad). The raw data from our study are available by contacting the corresponding author.
Results
Cases
Individual dogs had a range of clinical illnesses, including hemangiosarcoma, osteosarcoma, melanoma, histiocytic sarcoma, lymphoma, hepatocellular neoplasia, and others (Suppl. Table 1). Hemangiosarcoma was the most common diagnosis (n = 5). Results of a CBC within 2 wk before death were available for 29 of 30 dogs. Five dogs had mild anemia (hematocrit 0.30–0.37 L/L; RI: 39–56 L/L), and one dog had marked anemia with agglutination (dog 14; hematocrit 0.17 L/L). Two dogs had mild leukopenia (WBC 3.2, 3.5 × 10⁹/L; RI: 4.9–15.4 × 10⁹/L), and 4 dogs had leukocytosis (WBC 23.2–42.1 × 10⁹/L). One dog had moderate thrombocytopenia (dog 23; 59 × 109/L, RI: 117–418 × 109/L).
The cytologic imprint preparations yielded >50% cells without intact cytoplasmic or nuclear membranes (data not shown). The frequency of cell lysis precluded identification and meaningful differential counting; therefore, cytologic evaluation was not pursued further.
Hematopoietic cellularity
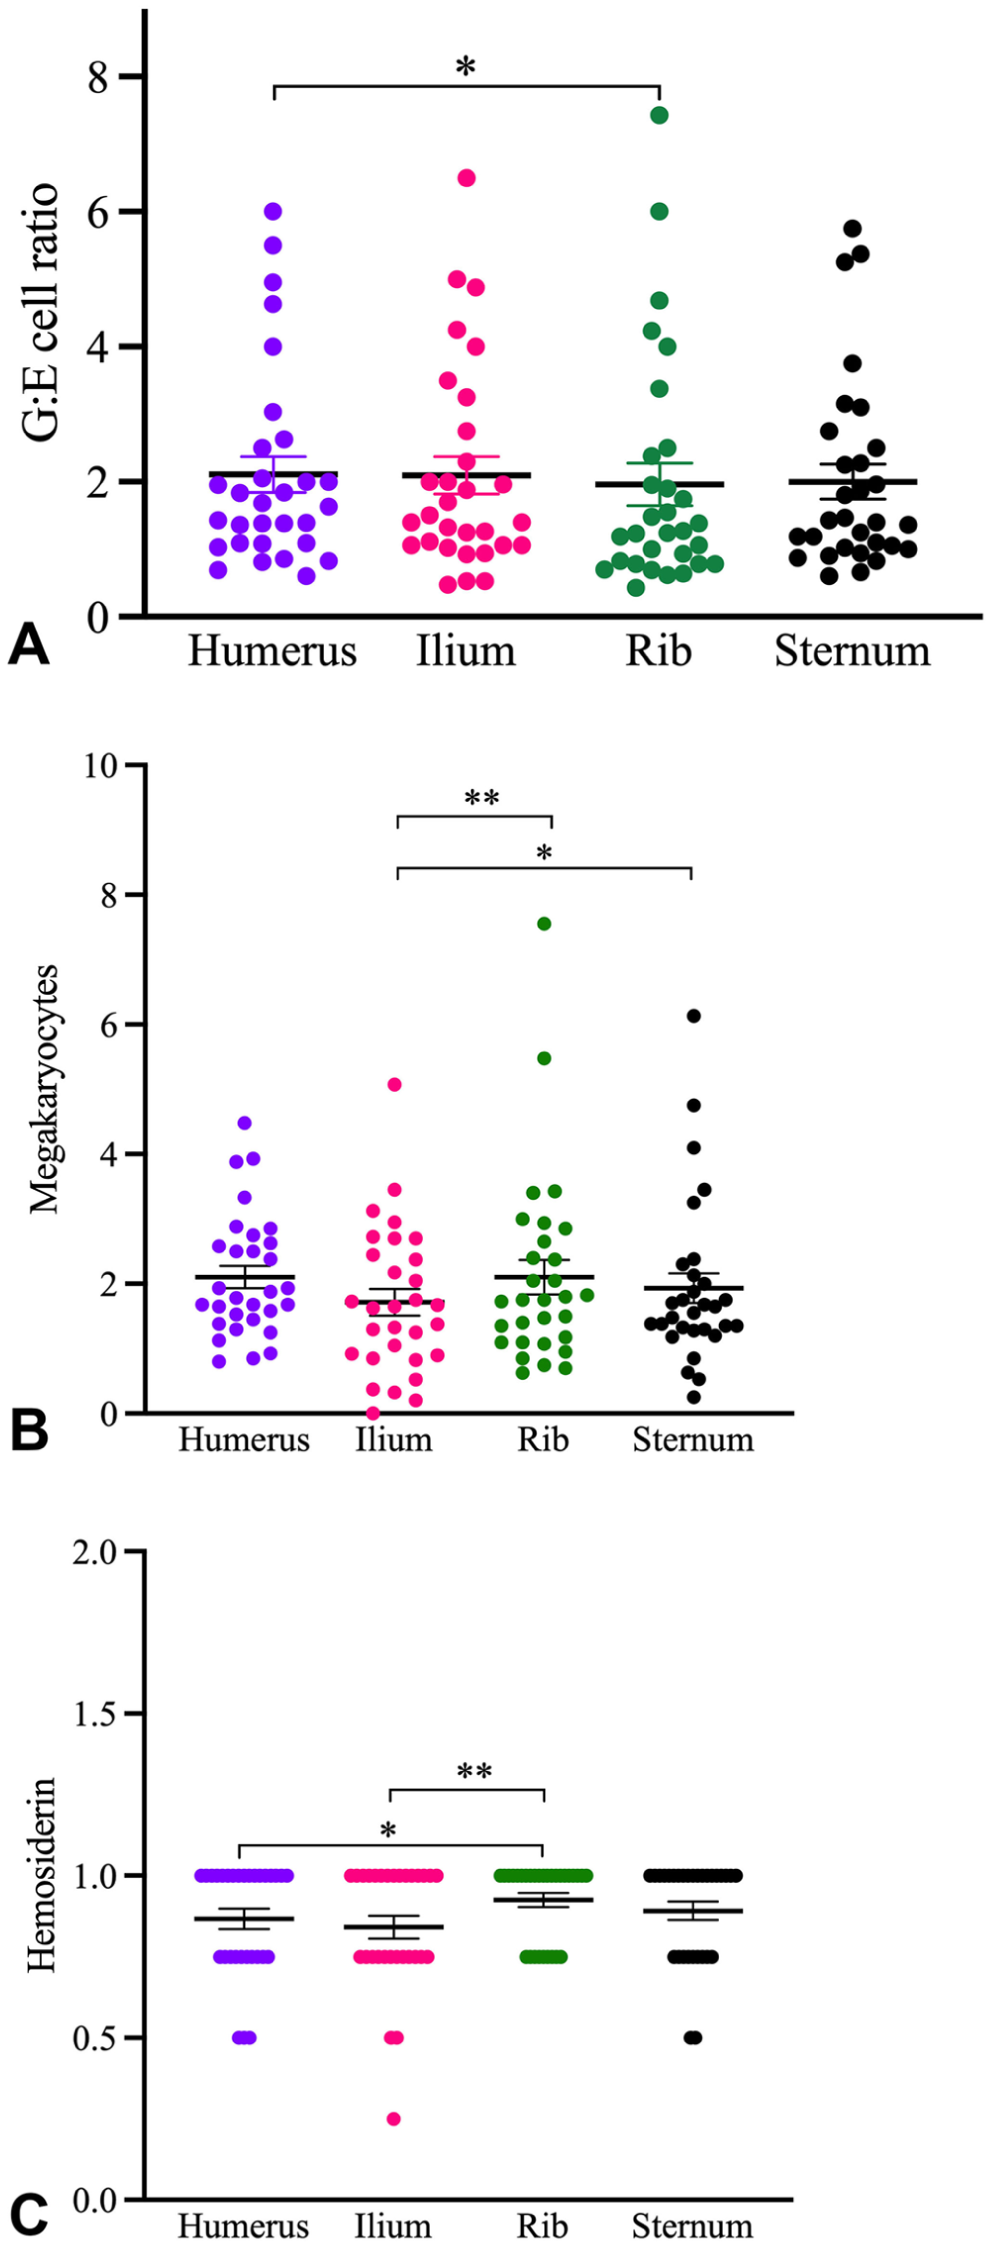
Analysis of variance (F-test) comparing site by site, and rater by rater, indicated that the cellularity differed among the 4 sites (p = 0.0002), with overall highest scores for rib and lowest scores for ilium (Table 1; Figs. 1, 2).
Mean canine bone marrow hematopoietic cellularity by site.
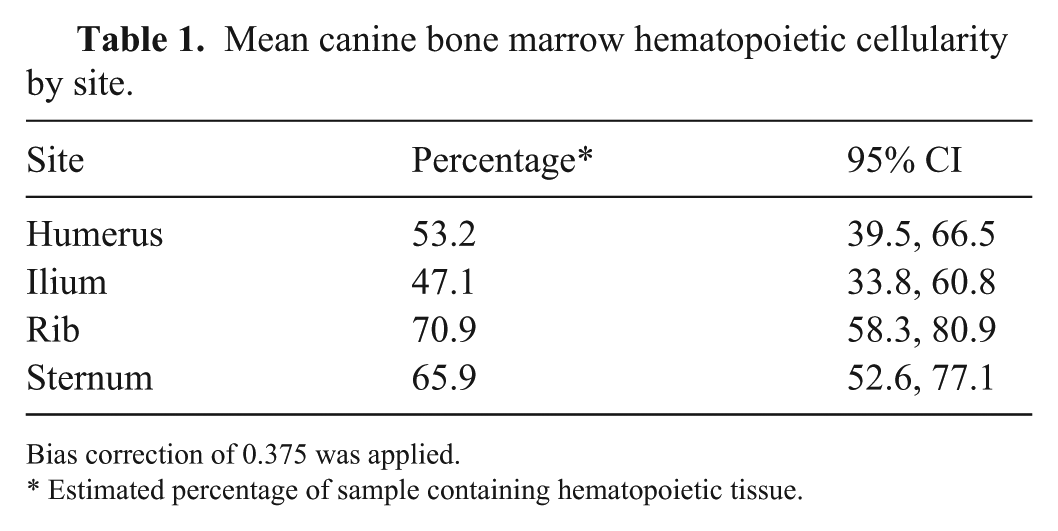
Bias correction of 0.375 was applied.
Estimated percentage of sample containing hematopoietic tissue.
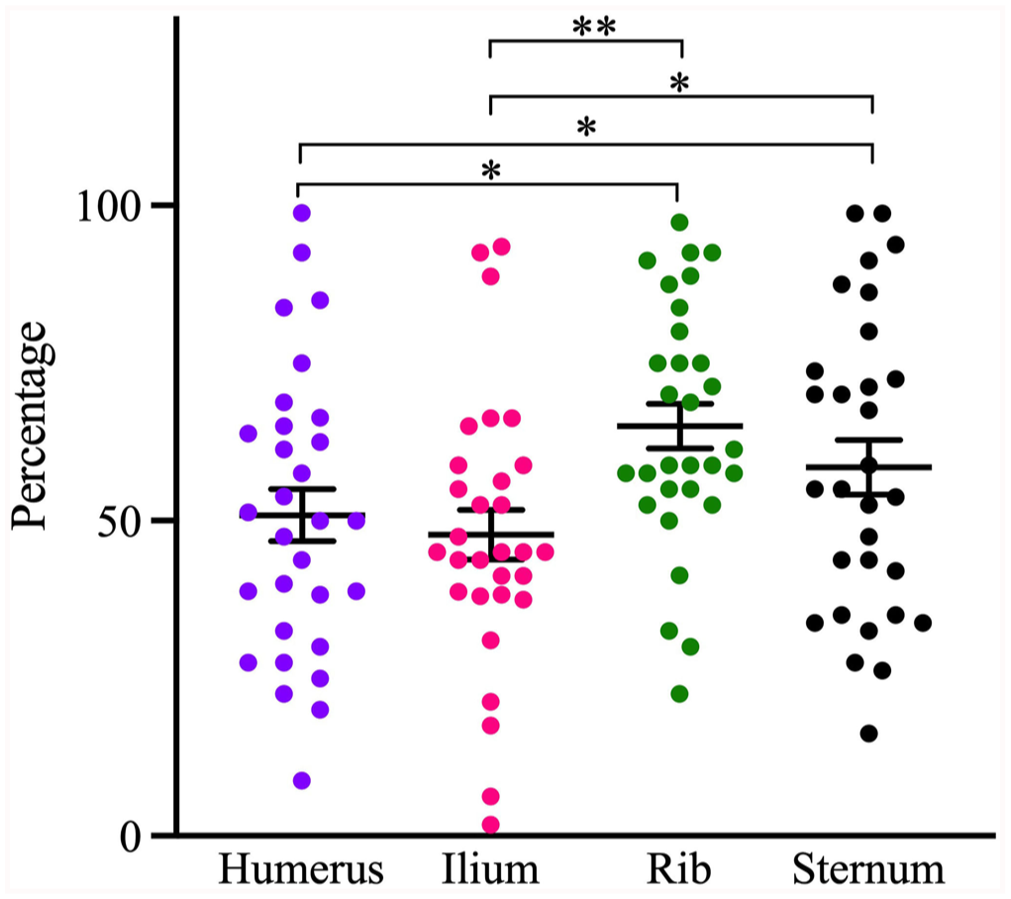
The hematopoietic cellularity at different bone marrow sites of dogs. Central lines and error bars =
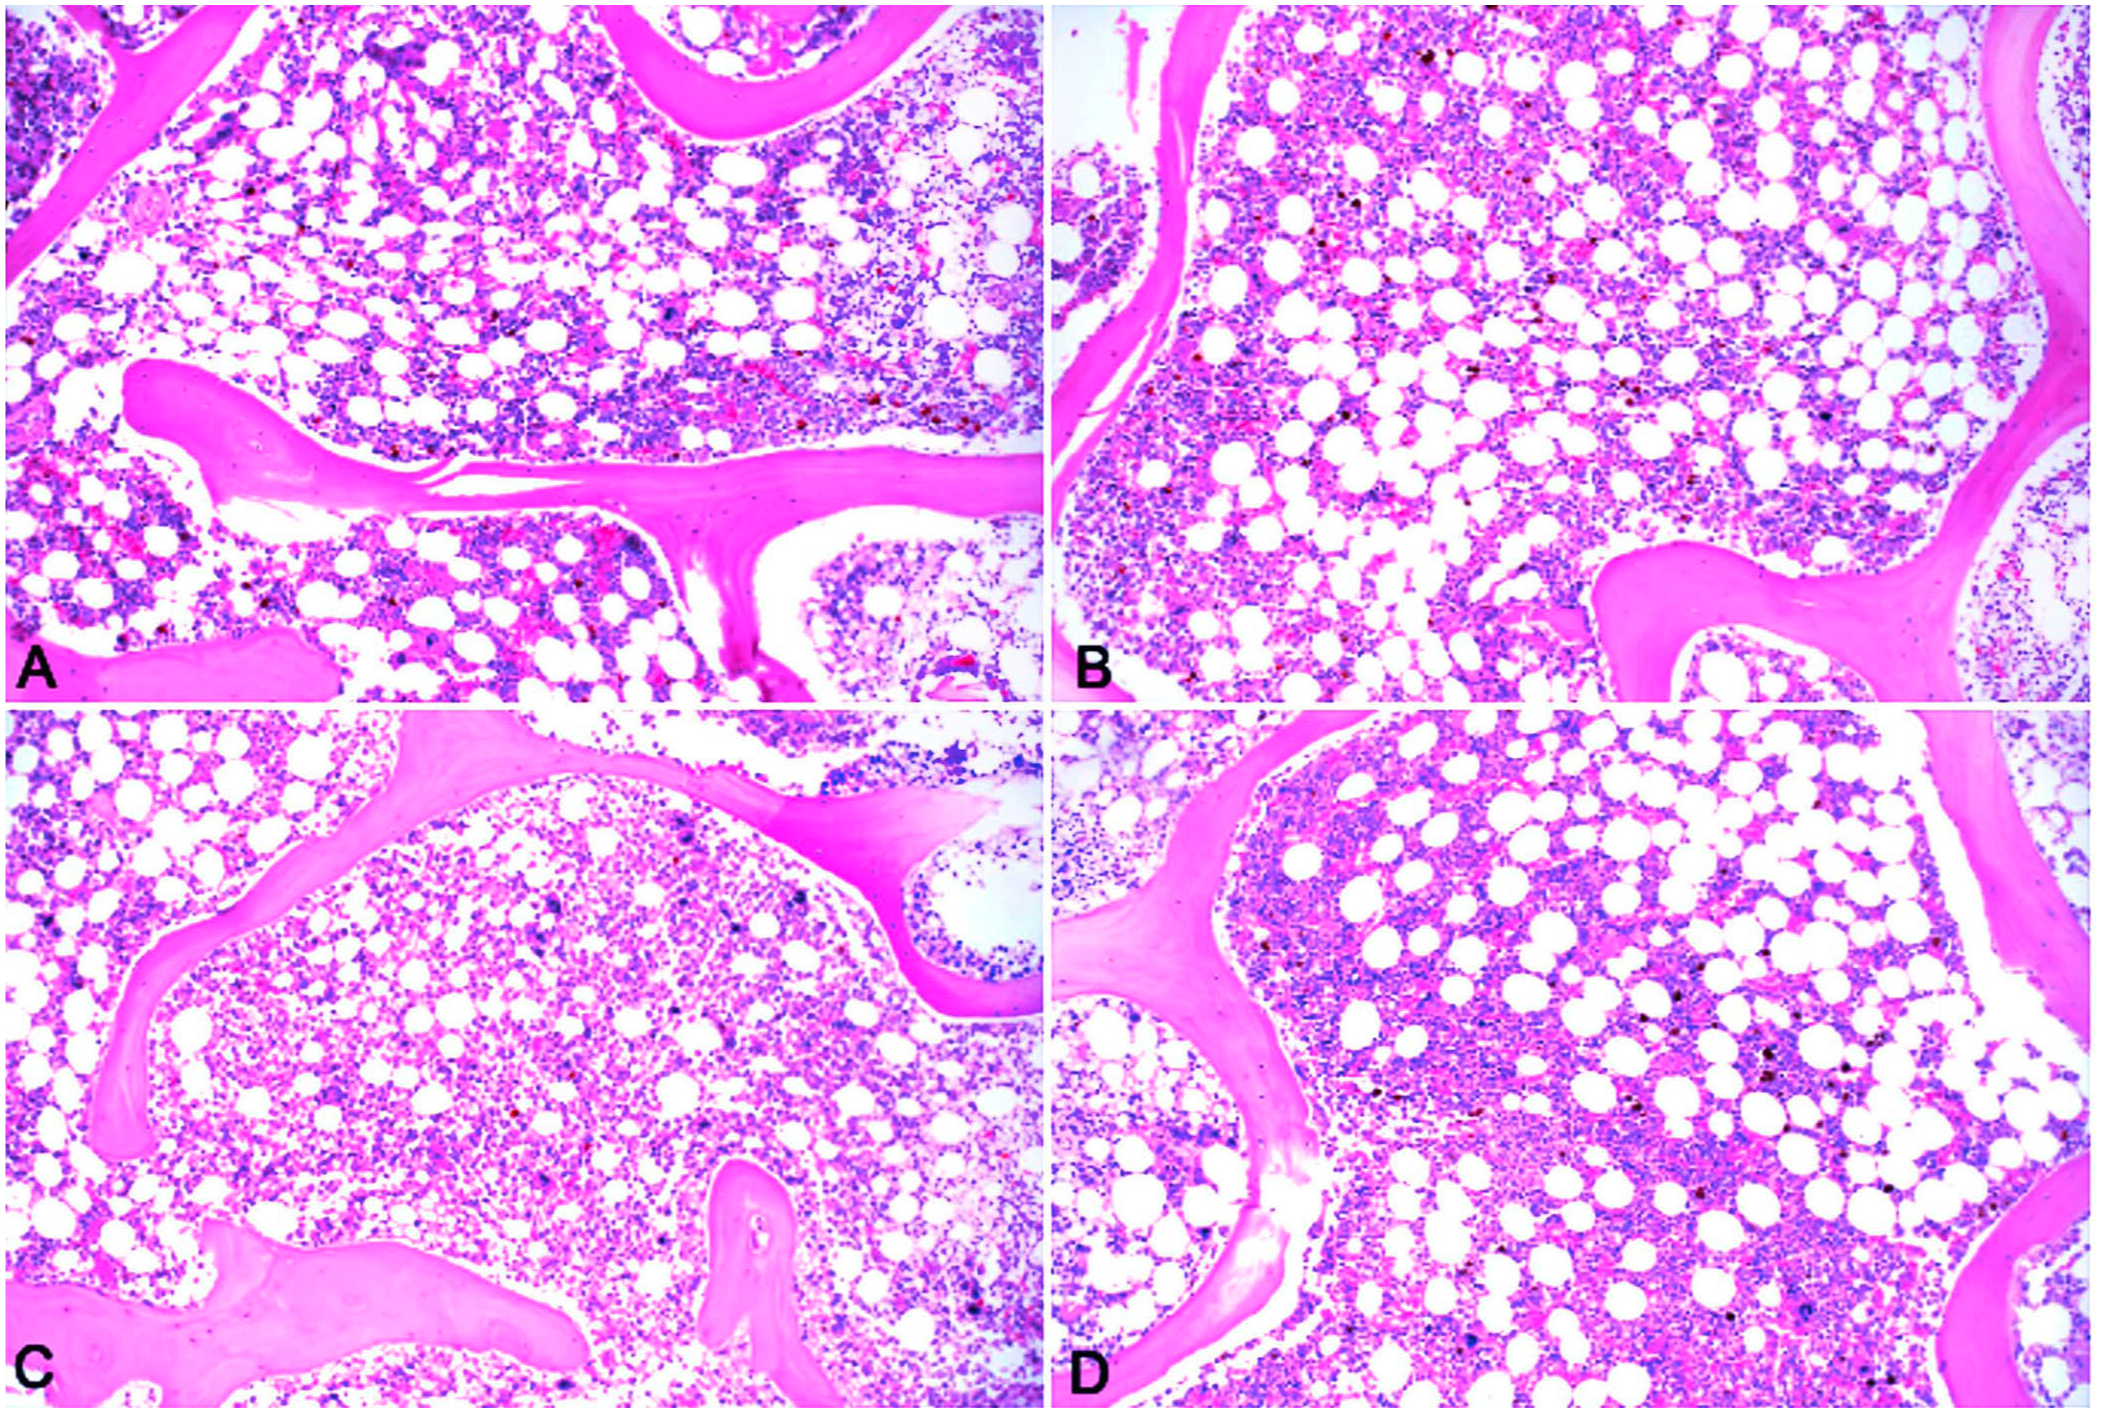
Sections of bone marrow from
In pairwise comparisons, the cellularity of the humerus was significantly different from that of the rib and sternum (Table 2). The odds of identifying hematopoietic relative to adipose tissue in the humerus were 53% lower than in rib, and 41% lower than in sternum. The cellularity of the ilium was also significantly different from that of the rib and sternum, and the odds of identifying hematopoietic tissue in the ilium were 64% and 54% lower than in the rib and sternum, respectively.
Pairwise comparisons of hematopoietic cellularity at different sites in bone marrow of dogs.
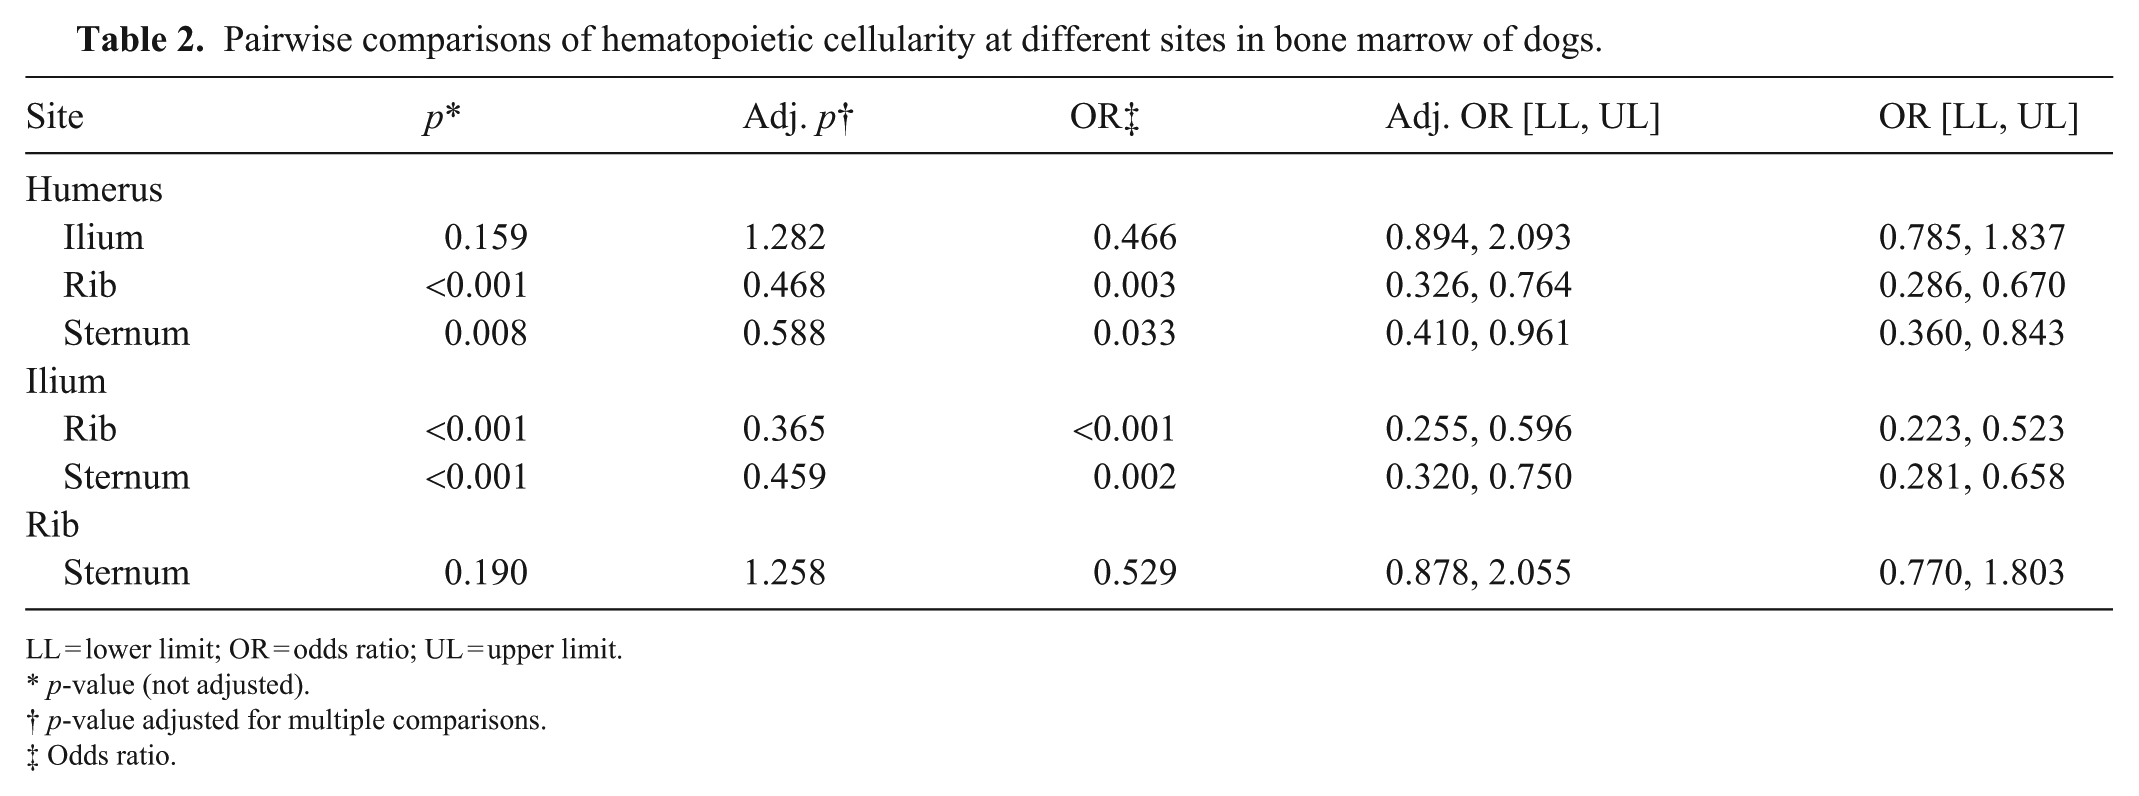
LL = lower limit; OR = odds ratio; UL = upper limit.
p-value (not adjusted).
p-value adjusted for multiple comparisons.
Odds ratio.
Evaluation of covariance with removal of the random sources of variation (rater and rater*individual animal) indicated that the individual animal was the main source of variation (estimate = 1.54; Suppl. Table 2). The interclass correlation between individual animal and residual estimate was 0.646, meaning that observations within an animal were 64.6% more alike than observations between animals or raters. Covariance analysis of rater*site showed lower variation of individual animal (SE = 0.022), meaning that the raters may have scored sites somewhat differently (Suppl. Table 2).
Granulocytic:erythrocytic cell ratio
Overall, the G:E cell ratio differed between sites (p = 0.035), with ratios of 45.6–66.7. The humerus had the highest and the rib had the lowest ratio (Table 3; Fig. 3A). Hence, for every 100 cells assessed in the humerus, it is expected that cells would be 58% granulocytic and 42% erythrocytic.
The mean granulocytic:erythrocytic cell ratio at different sites in bone marrow of dogs.
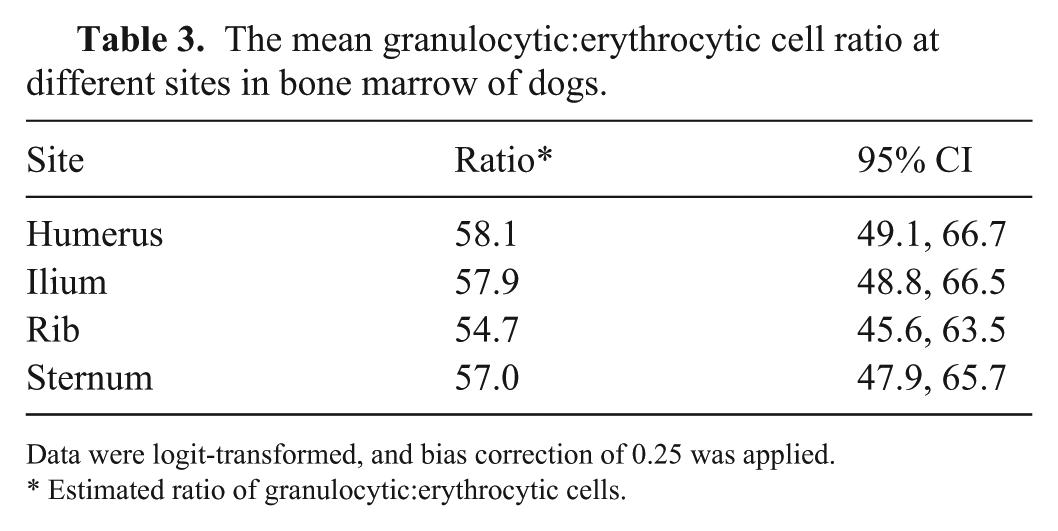
Data were logit-transformed, and bias correction of 0.25 was applied.
Estimated ratio of granulocytic:erythrocytic cells.
The
In pairwise comparisons, the only significantly different G:E cell ratio was between the humerus and rib (Table 4). Overall, the odds of finding a higher G:E cell ratio in the humerus were 14.8% higher than in the rib. Once the analysis was adjusted for multiple comparisons, there was no difference in the G:E cell ratio between ilium and rib.
Pairwise comparison of the granulocytic:erythrocytic cell ratio at different sites in bone marrow of dogs.
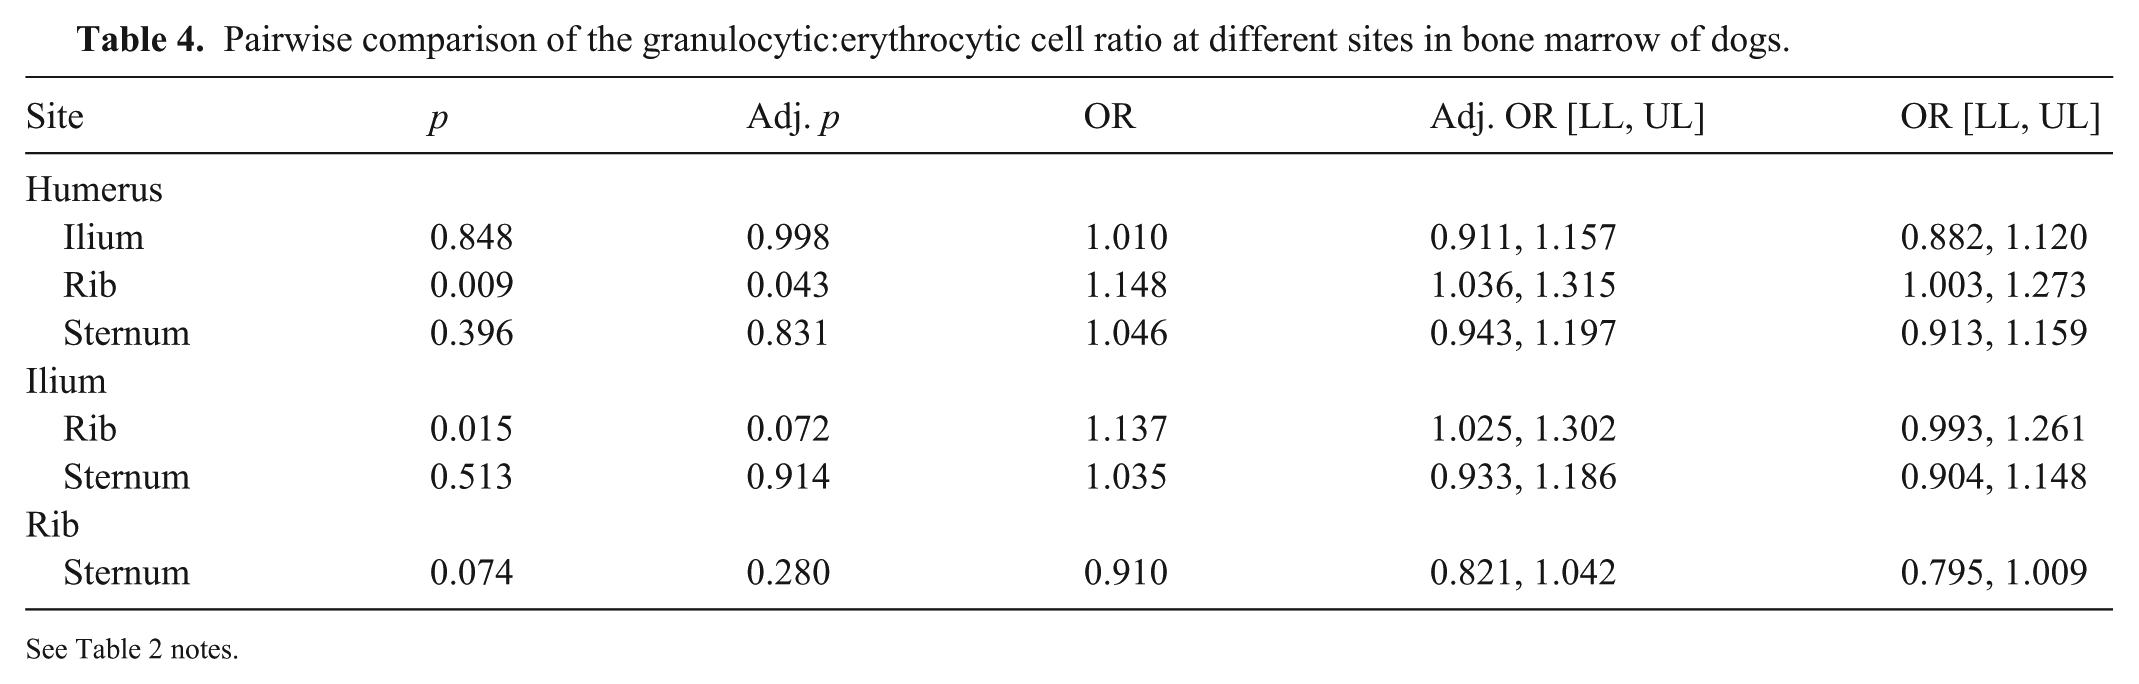
See Table 2 notes.
Analysis of covariance, when removing the random source of variation of rater*site (since there was no random variance) and maintaining rater, individual animal, rater*individual animal, and residual covariant parameters, indicated an individual animal effect (estimate = 0.265; Suppl. Table 3). The rater*individual animal showed the effect of raters on the variation among individual animals. The residual analysis revealed unequal variance, which needed to be accommodated based on the Akaike information criterion. One rater was the main source of variation (estimate = 0.871). Exclusion of this rater did not change the overall interpretation; therefore, all results were retained. The next highest source of variation was individual animal (estimate = 0.265).
Megakaryocytes
The number of MKCs varied between sites (p <0.001), with the highest number in the rib and the lowest number in the ilium (Table 5; Fig. 3B). In pairwise comparisons, differences were noted between ilium and rib, and ilium and sternum (Table 6). Overall, there were 25.5% and 20.6% fewer MKCs in the ilium than in the rib and sternum, respectively.
The mean number of megakaryocytes per high-power field (0.237 mm2) at different sites in bone marrow of dogs.
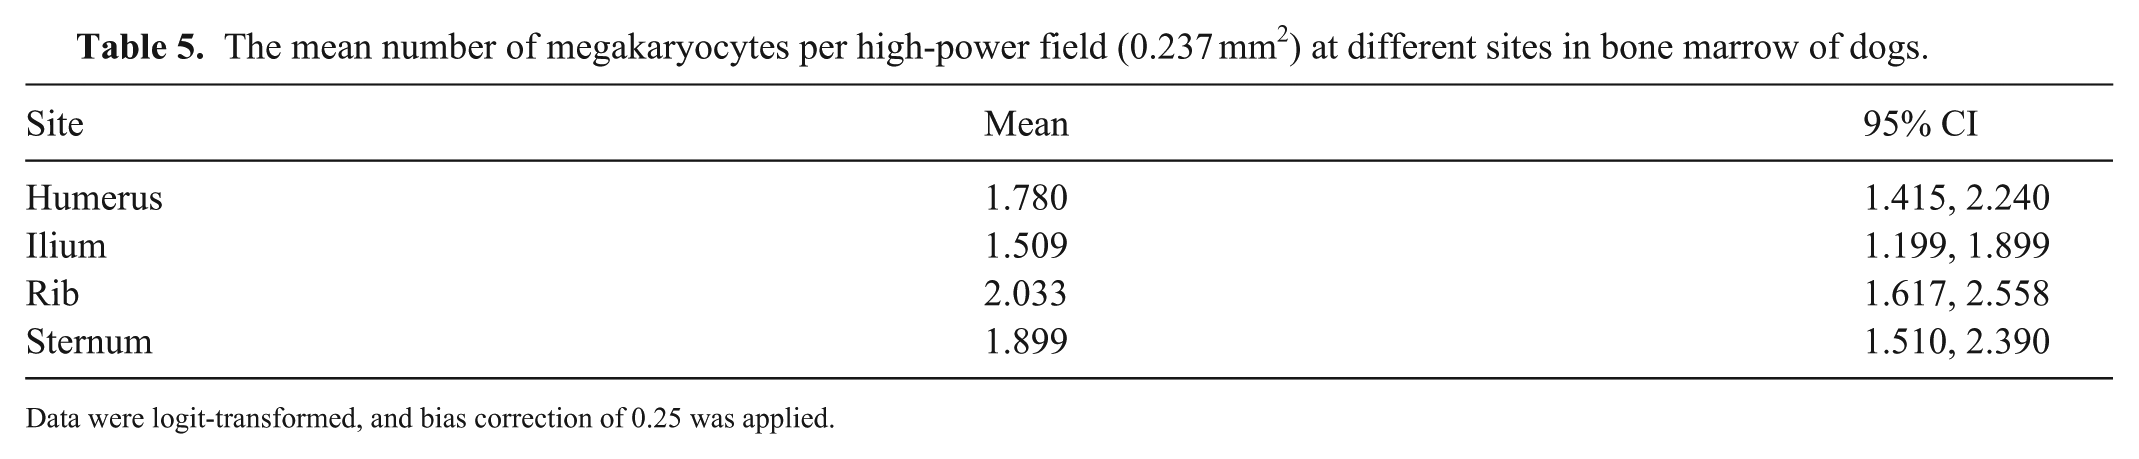
Data were logit-transformed, and bias correction of 0.25 was applied.
Pairwise comparison of the number of megakaryocytes in bone marrow of dogs.
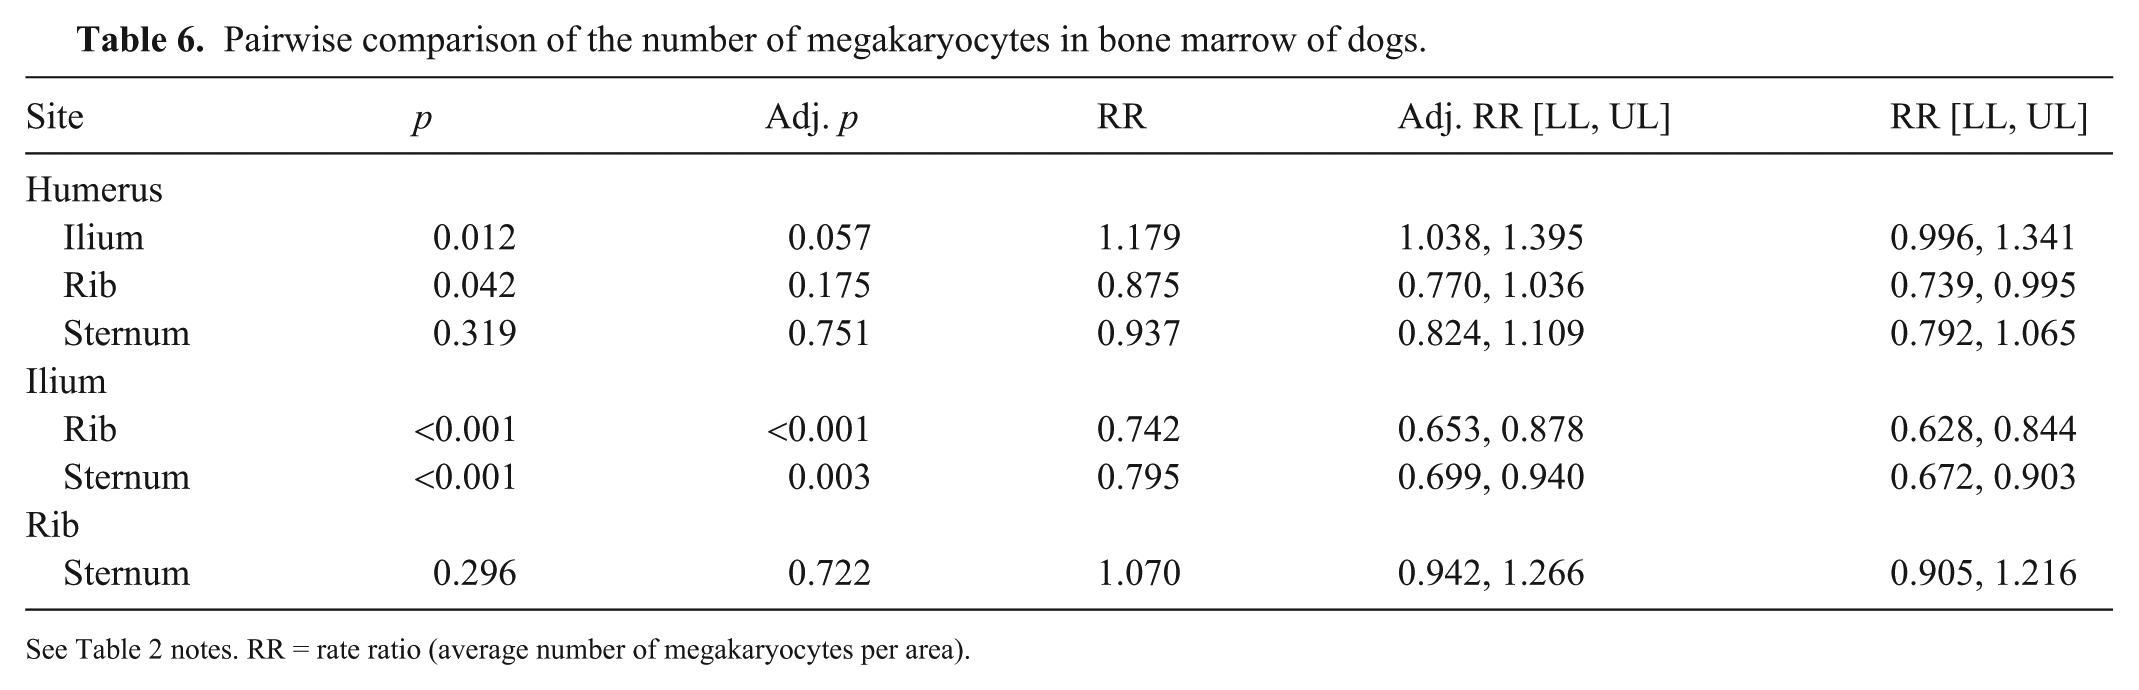
See Table 2 notes. RR = rate ratio (average number of megakaryocytes per area).
There was a significant difference between the 4 sites; however, omitting the ilium, the MKC number did not vary significantly (p = 0.1257) between rib, humerus, and sternum. Rather, the average MKC number among these bones was 1.26 times higher (95% CI [1.14,1.40]) than that of the ilium.
Upon evaluation of covariance, the random sources of variation—rater*individual animal and rater*site—were removed because there was no random variance between them, and rater, individual animal, and residual covariant parameters were maintained (Suppl. Table 4). The residual shows that the variations arose mainly from individual animals rather than raters.
Hemosiderin
Detection of hemosiderin in BM varied between sites (p <0.001). On random effect evaluation, the highest probability of observing hemosiderin was in the rib, and the lowest probability in the ilium (Table 7; Fig. 3C). From pairwise comparisons, the differences between humerus and ilium and between ilium and ribs were significant (Table 8). The odds of identifying hemosiderin in the humerus were 79% lower than in the rib, and the odds of identifying hemosiderin in the ilium were 88% lower than in the rib. In analysis of covariance, individual animals were the primary source of variation, contributing ~3 times as much variance as rater, and 4 times as much as rater*individual (Suppl. Table 5).
Presence of hemosiderin by site in bone marrow of dogs.
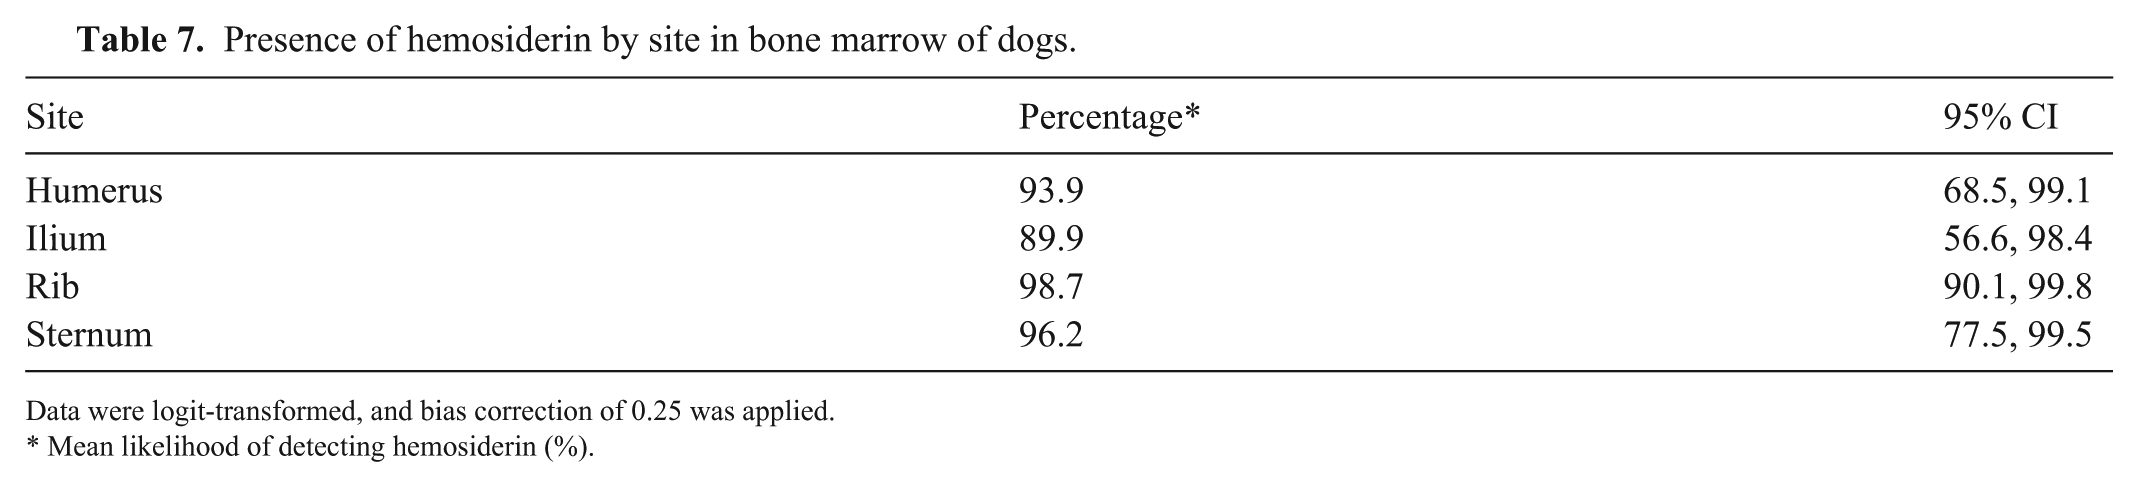
Data were logit-transformed, and bias correction of 0.25 was applied.
Mean likelihood of detecting hemosiderin (%).
Pairwise comparison of hemosiderin between sites in bone marrow of dogs.
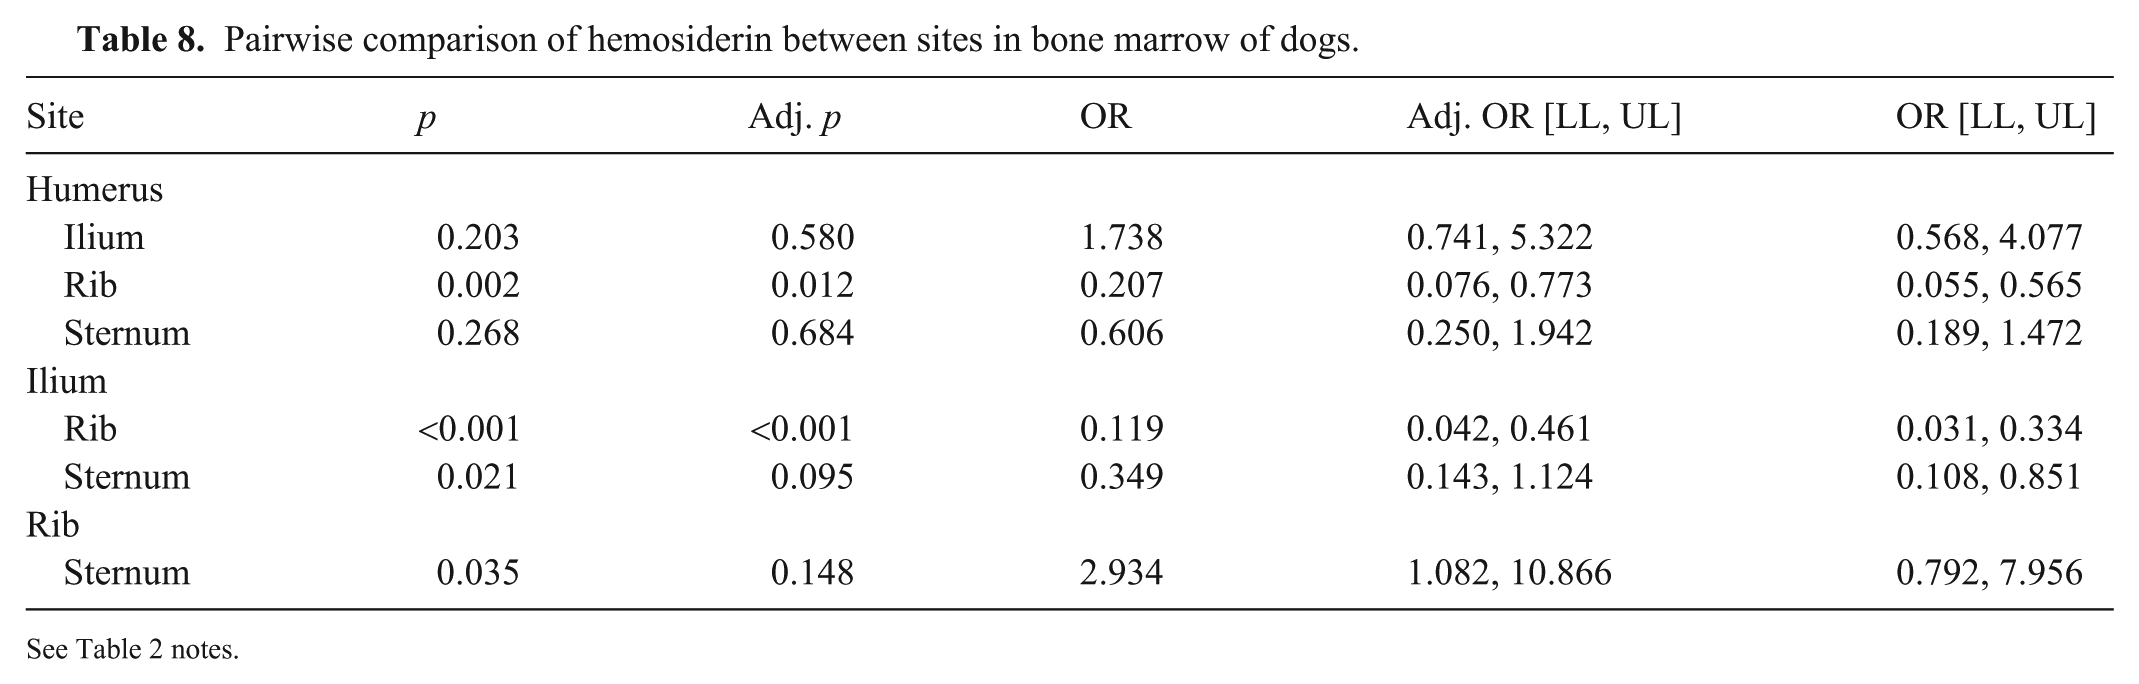
See Table 2 notes.
Discussion
Although sternum and rib are only suitable for in vivo BM aspiration, we consider that our results are nevertheless informative for choosing aspirate and core biopsy sites in vivo, and for choosing postmortem tissue from any of the 4 sites that we compared. The 30 cases examined included a wide range of ages, weights, breeds, and clinical conditions in dogs, with concomitantly overall most pronounced variability attributable to individual animal, and less variability to site or rater.
Differential hematopoietic cell identification is best achieved by cytologic evaluation. However, cell degeneration, even within <24 h after death, precluded meaningful cytologic assessment in our study. Our findings are consistent with results reported for postmortem BM samples obtained from humans but differ from those reported for dogs in another study.8,18 In the latter study, 8 samples were collected within 45 min of euthanasia, and 58% of cytologic BM preparations were considered to be of excellent or good quality. These differences may reflect the time interval between euthanasia and sampling in the latter study compared to our study, differences in the criteria for suitability of interpretation, or differences in assessment. Sections in our study were stained with H&E given that it is the most widely used stain in veterinary histopathology, and samples were demineralized with EDTA, which has been shown to yield superior morphology compared to acid demineralization. 7
We noted differences in the hematopoietic cellularity between sites. Rib and sternal samples had higher cellularity than humerus and ilium. The magnitude of differences between sites was modest, and the individual animal was the greatest contributor of variability. Neither rib nor sternum was assessed in a previous microscopic study of canine BM, 8 and the ilium was not separated into pelvic elements and lumbar vertebrae in tracer-based study, precluding comparison with our results. In the tracer-based study, cell proliferation in the humerus was slightly higher but overlapped that of sternum or ribs. 12 This difference may be in part because younger dogs would have a greater proportion of the BM cavity of long bones that is hematopoietically active relative to the predominantly middle-aged or older dogs in our study.
The G:E cell ratio reflects whether the BM responds adequately and synchronously to the requirement for peripheral leukocytes and/or erythrocytes. The ratio was 0.45–0.66 in our study, which is similar to that reported in healthy dogs.8,11,19 Differences were noted between the humerus and the rib, but this magnitude of difference is unlikely to be biologically significant. Determination of the MER yielded higher values by cytologic than histologic assessment in another study. 8 Such a difference is difficult to reconcile because samples from identical locations were assessed with 2 slightly different methods. 8 One rater each performed the cytologic and histologic assessments, and covariance was not calculated, which limited distinction between biologic and analytic factors. 8 The MER of iliac crest samples was higher than that of humeral samples. We did not identify similar differences in our study, but overall, G:E cell ratios and MERs were comparable in both studies.
BM MKCs provide for adequate platelet mass in peripheral blood. There are normally 2–5 individually dispersed MKCs per intertrabecular space in histologic sections from healthy dogs. 20 The MKC number varied slightly between the 4 sites, with ilium having the lowest and rib the highest number. This result mirrors hematopoietic cellularity, which was also lowest in the ilium. Samples with higher hematopoietic cellularity have more MKCs per microscopic field 1 ; therefore, this was an expected finding. Differences in MKC number have been associated with normalized quality scores of BM samples, which is similar to our findings. 8
Differences in BM hemosiderin were noted between samples from the ilium and rib, and humerus and rib. Hemosiderin is stored in macrophages, and, in iron-replete animals, hemosiderin would be more likely to be noted in samples with high cellularity. Samples from the ilium had the lowest cellularity, which may have contributed to the relatively less frequent observation of hemosiderin. Some variation among independent raters in detection of small, dispersed amounts of pigment might be expected, and more sensitive detection of hemosiderin could be achieved by specific staining for ferric iron. However, the odds of detecting hemosiderin were ≥90% for all sites and animals, consistent with the mature age and absence of chronic blood loss among dogs in the study population.
Weight-bearing forces are hypothesized to affect hematopoietic cellularity, and to contribute to long bones having more adipose tissue relative to hematopoietic tissue.5,16 This hypothesis would be consistent with the higher cellularity that we noted in the rib and sternum than in the humerus and ilium. However, obtaining good quality in vivo BM samples, in particular cores, may be challenging in small dogs and cats. Our results indicate that differences between the more readily accessible proximal humerus and other sites are minor.
There are limitations to our study. The unavailability of cytology preparations restricted the enumeration of individual hematopoietic cells to estimates from histologic preparations. This limitation was offset by maximizing the quality of histologic sections through adherence to standardized protocols for fixation, EDTA-based demineralization, and thin sectioning. The time interval between death of the animal and sample collection was 2–24 h. Although this time interval has been shown not to significantly affect histomorphology scores, a more uniform time interval may nevertheless have reduced variability. 7 Hematologic abnormalities in study animals were few and of mild-to-modest severity. The composition of BM at different sites might be more variable in animals with chronic and severe cytopenias, infiltrative BM diseases, or as a result of chemo- or radiation-therapy. Therefore, our results may not be equally applicable to animals with primary hematopoietic diseases.
Supplemental Material
sj-pdf-1-vdi-10.1177_10406387251387786 – Supplemental material for Comparison of the bone marrow composition in samples from rib, ilium, sternum, and humerus of dogs
Supplemental material, sj-pdf-1-vdi-10.1177_10406387251387786 for Comparison of the bone marrow composition in samples from rib, ilium, sternum, and humerus of dogs by Gabriella M. L. Diamantino, Janet Beeler-Marfisi, Robert A. Foster, William Sears, Alice Defarges and Dorothee Bienzle in Journal of Veterinary Diagnostic Investigation
Footnotes
Acknowledgements
We thank the staff in the postmortem suite and the histopathology laboratory of the Animal Health Laboratory, University of Guelph, for expert technical support, and Dr. Courtney Schott for constructive review of the manuscript.
Declaration of conflicting interests
The authors declare no potential conflicts of interest with respect to the research, authorship, and/or publication of this article.
Funding
Funding for our research was from the Pet Trust Foundation, University of Guelph, and the Natural Sciences and Engineering Research Council of Canada. Gabriella M. L. Diamantino received an Ontario Veterinary College PhD Scholarship for doctoral studies.
Supplemental material
Supplemental material for this article is available online.
References
Supplementary Material
Please find the following supplemental material available below.
For Open Access articles published under a Creative Commons License, all supplemental material carries the same license as the article it is associated with.
For non-Open Access articles published, all supplemental material carries a non-exclusive license, and permission requests for re-use of supplemental material or any part of supplemental material shall be sent directly to the copyright owner as specified in the copyright notice associated with the article.