
Abstract
Feline oral squamous cell carcinoma (FOSCC) is an aggressive tumor with poor outcomes. Mechanisms of prostaglandin E2 (PGE2)-related inflammation and angiogenesis interact in human OSCC; however, this relationship has not been reported in FOSCC, to our knowledge. We aimed to characterize expression of genes encoding PGE2 synthases (PTGES1–3), PGE2 receptors (EP1–4), hypoxia inducible factor 1α (HIF1A), and vascular and endothelial growth factor A (VEGFA) in FOSCC cell lines (SCCF1–3) in vitro using reverse-transcription quantitative real-time PCR (RT-qPCR). Expression of PTGES1, PTGES3, EP4, and VEGFA were serum-inducible in SCCF2 cells; VEGFA was also inducible in SCCF1 cells (p ≤ 0.05). Compared to other serum-treated cells, SCCF3 cells had the lowest VEGFA expression despite the highest HIF1A (p ≤ 0.05) expression. PGE2 (5 µg/mL and 35 µg/mL) was added to SCCF2 cells for 4 different times (30, 60, 120, 240 min). Both doses of PGE2 stimulated expression of HIF1A and CD147 at 240 min (p ≤ 0.05). PGE2 treatment stimulated cyclooxygenase 2 (COX2) expression at 30 min, followed by suppression at 60 and 120 min and a sharp reduction in EP4 expression at 60 min (p ≤ 0.05). Treatment of SCCF2 with PGE2 and EP4 antagonist L-161,982 increased COX2 expression, and L-161,982 (alone and in combination with PGE2) stimulated EP4 expression (p ≤ 0.05). Genes for PGE2 synthase enzymes, PGE2 receptors, HIF1α and VEGFA were expressed in FOSCC cells in vitro. SCCF2 cells responded to exogenous PGE2 and EP4 antagonism, suggesting that EP4 activity in FOSCC deserves more study.
Keywords
Feline oral squamous cell carcinoma (FOSCC) is a highly aggressive tumor of the oral cavity of cats, often associated with significant tissue invasion including infiltration of bone. 39 The true metastatic rate of FOSCC is uncertain, because it is likely that many cats are euthanized due to local disease before metastasis becomes clinically apparent, although one report indicated that 35.7% of cats with FOSCC had lymph node metastasis. 5 Cats with FOSCC have a poor prognosis, with an average survival of only 2 mo after diagnosis. 38
Prostaglandin E2 (PGE2) and the cyclooxygenase pathway of inflammation are important to cancer biology in general, and their significance in human and animal OSCC has been reviewed. 57 PGE2 is produced by enzymes downstream of cyclooxygenase-1 and -2 (COX1 and COX2), referred to as microsomal and cytosolic prostaglandin E synthases (mPGES1, mPGES2, and cPGES, encoded by PTGES1–3, respectively). PGE2 exerts its effects through 1 of 4 E-prostanoid receptors, which are encoded by EP1–4. 59
Past work has demonstrated that FOSCC cell lines express COX1 and COX2 genes, COX2 protein, and produce PGE2. 54 Furthermore, immunohistochemistry (IHC) studies of human and feline OSCC confirm expression of mPGES1 and CD147 in a subset of tumors.54 –56 CD147, known as an extracellular matrix metalloproteinase inducer, is associated with tumor invasion and metastasis, and its expression is associated with poor prognosis in human OSCC. 46
The importance of inflammation and tumor-driven angiogenesis in human and animal OSCC has been reviewed. 58 Briefly, angiogenesis is regulated by members of the vascular endothelial growth factor (VEGF) family, referred to as VEGFA–D. VEGFs are expressed in response to increased activity of the hypoxia-inducible factor family of transcription factors (HIF, with subtypes 1α, 2α, 3α) leading to increased tumor vascularity with subsequent tumor growth. Areas of hypoxia have been found in FOSCC using clinical imaging, 4 and VEGFA expression has been shown in FOSCC cell lines and tissues.7,20 Interestingly, published research suggests a relationship between cyclooxygenase-driven inflammation and angiogenesis. In one such study, COX2 expression was significantly correlated with VEGFA expression in feline cutaneous SCCs and FOSCC tissues. 43 Those authors speculated that PGE2 could stimulate HIF1α and VEGFA expression, causing increased tumor growth. In human OSCC, increased COX2 expression in tumor cells was associated with increased VEGFA expression, increased tumor vascularity, and shorter patient survival. 17 In human esophageal SCC, hypoxia upregulates HIF1α activity causing angiogenesis, activation of the PGE2 synthesis pathway, upregulation of inflammatory interleukin-1β (IL1β) expression, as well as activation of growth factor signaling pathways. 32
Studies demonstrating that PGE2 and hypoxia-associated pathways contribute to angiogenesis, invasion, and metastasis in human OSCC have been reviewed and show potential relevance to FOSCC (summarized in Fig. 1). 58 An RNA-seq study comparing 7 FOSCC tumors to 3 oral mucosa samples from healthy cats revealed that gene expression related to signaling pathways common to inflammation, hypoxia, and angiogenesis was enriched in FOSCC, including NF-kB, JAK-STAT3, and TGFβ. 61 Examining the interaction between PGE2 synthesis and angiogenic pathways could help increase our understanding of the mechanisms of FOSCC disease progression, leading to improved therapy and prognosis. We aimed to determine if genes encoding PGE2 synthases (PTGES1–3), PGE2 receptors (EP1–4), VEGFA, and HIF1α are expressed in FOSCC cell lines, and to determine if exogenous PGE2 is capable of stimulating VEGFA and HIF1A gene expression in FOSCC cells via EP receptor signaling.
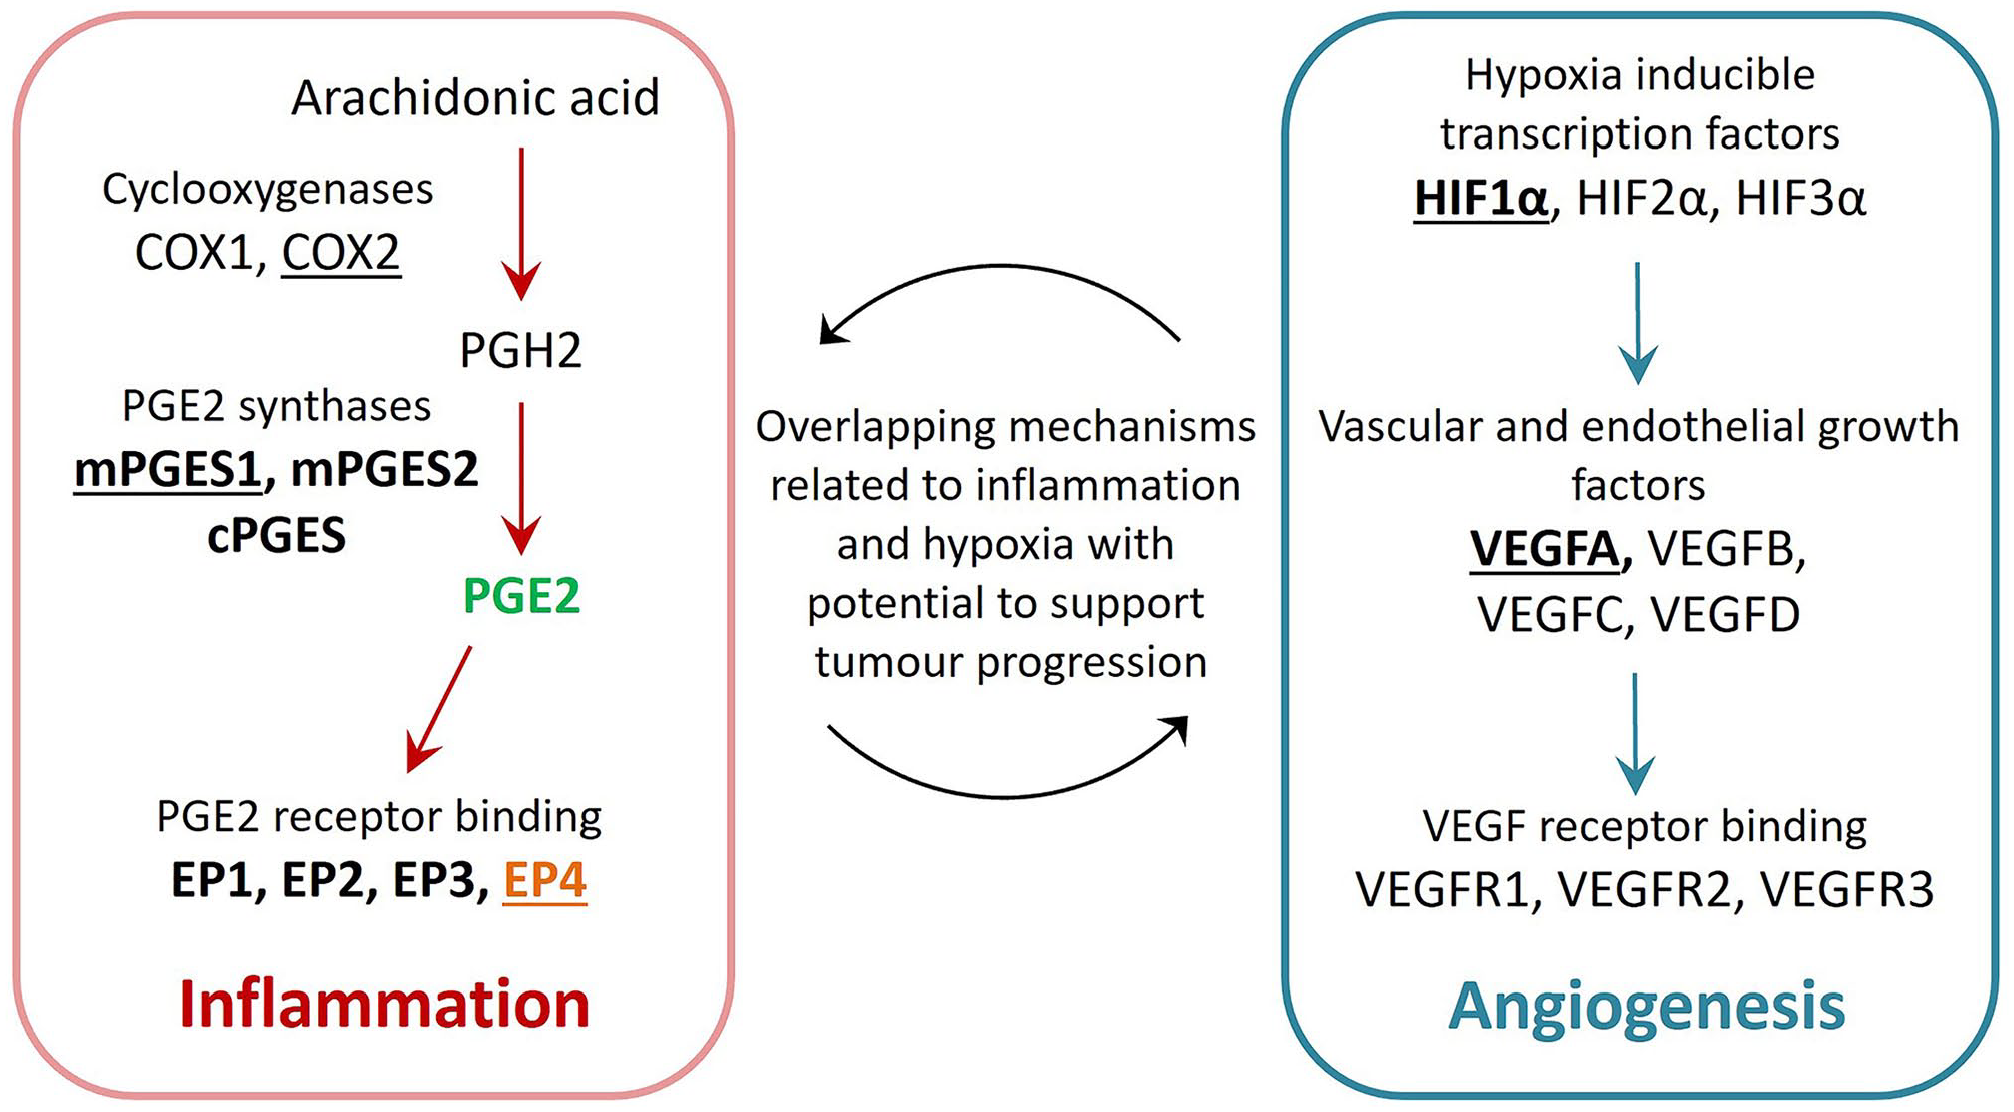
Selected mediators of angiogenesis and PGE2-related inflammation. FOSCC cell lines (SCCF1–3) were surveyed for expression of genes encoding PGE2 synthase enzymes (mPGES1, mPGES2, and cPGES), PGE2 receptors, HIF1α, and VEGFA (bold). SCCF2 cells were treated with exogenous PGE2 (green) and L-161,982 (an inhibitor of EP4, orange) to investigate their effect on mRNA expression of selected targets (underlined), including a mediator of tumor invasion, CD147 (not shown). Figure adapted from: Nasry and Martin. 58
Materials and methods
FOSCC cell lines and culture conditions
FOSCC cell lines (laryngeal SCCF1, gingival SCCF2, lingual SCCF3) were acquired from The Ohio State University (Table 1).40,71 These are adherent epithelial cells, and their culture conditions have been published. 54 Briefly, the cell lines were maintained in Dulbecco modified Eagle medium supplemented with 4.5 g/L glucose, L-glutamine, and sodium bicarbonate (MilliporeSigma), 10% heat-inactivated fetal bovine serum (FBS; Wisent), and 100 U/mL of penicillin and 100 μg/mL of streptomycin (HyClone). The FOSCC cells were periodically subcultured using 0.25% trypsin–EDTA (Wisent). Cells were cultured overnight in serum-free conditions (replacement of 10% FBS with 10 mg/mL of bovine serum albumin [0.1% BSA]) before application of experimental conditions to synchronize the cultures and to determine the impact of serum components on experimental outcomes.
Qualitative summary of SCCF1–3 cell lines with subjective, relative expression of selected mediators of inflammation and angiogenesis.
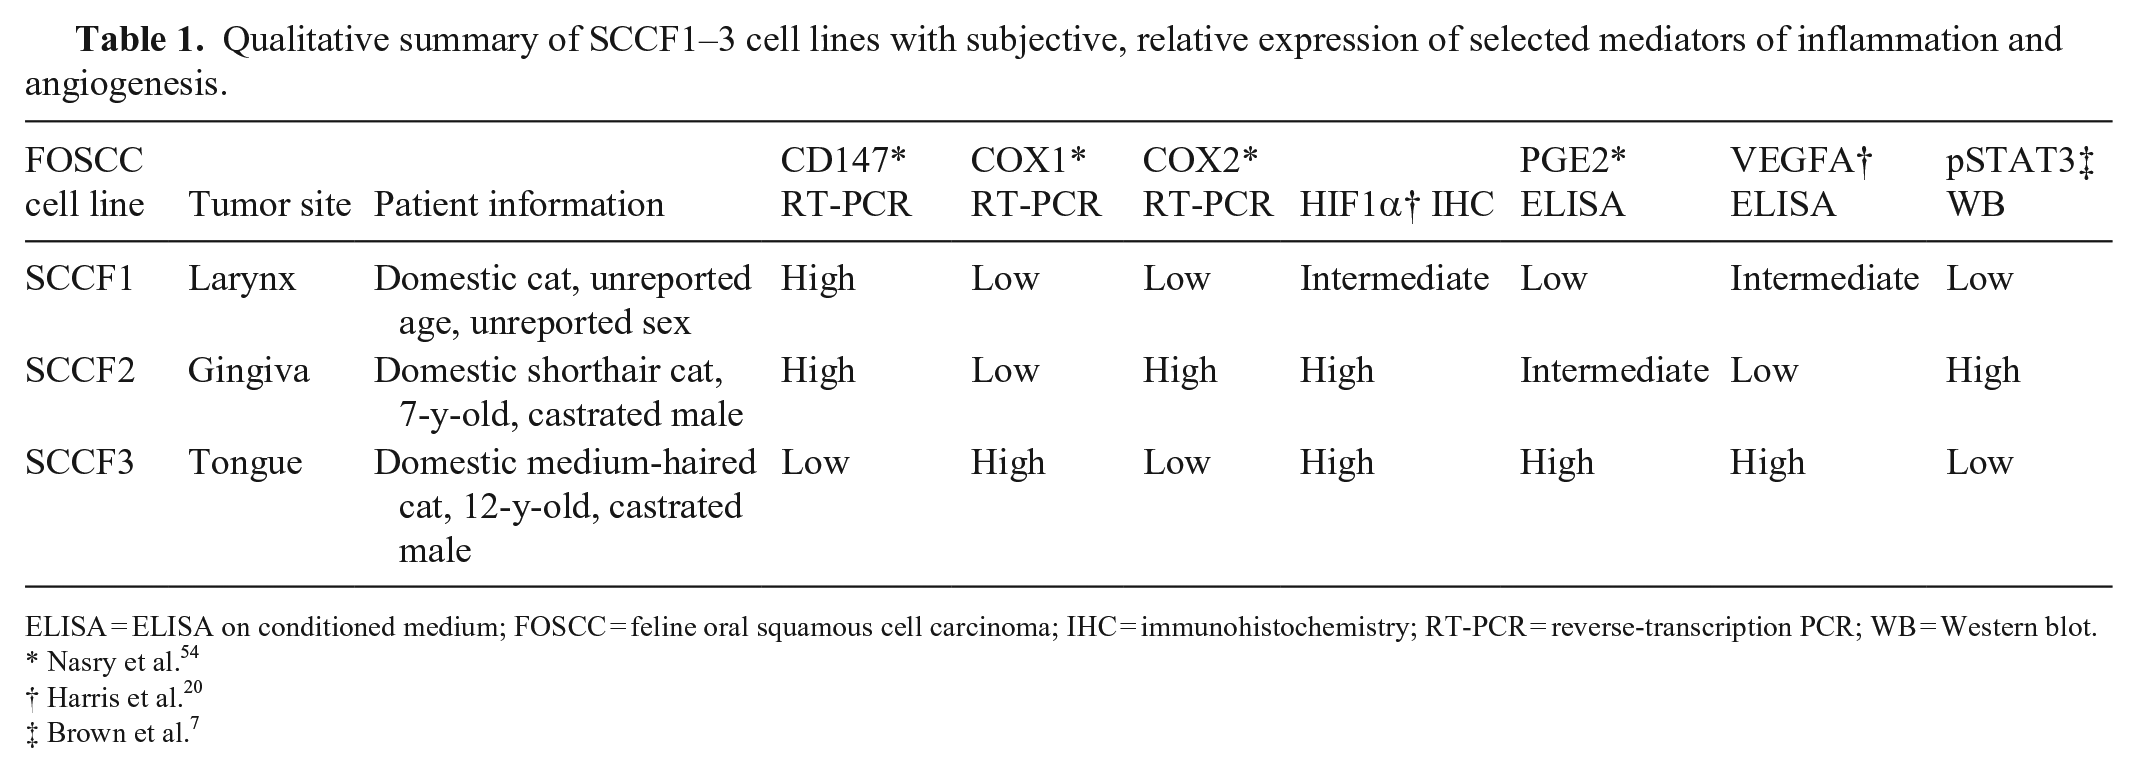
ELISA = ELISA on conditioned medium; FOSCC = feline oral squamous cell carcinoma; IHC = immunohistochemistry; RT-PCR = reverse-transcription PCR; WB = Western blot.
Nasry et al. 54
Harris et al. 20
Brown et al. 7
Primer design and assay optimization for reverse-transcription quantitative PCR
Primers for feline genes of interest (VEGFA, VEGFB, HIF1A, HIF2A. HIF3A, EP1, EP2, EP3, EP4, PTGES1, PTGES2, PTGES3) were designed using feline gene sequences catalogued in the databases of the National Center for Biotechnology Information (NCBI) and Primer-Blast software (NCBI) as described previously 54 (Suppl. Tables 1, 2). Primer validation and assay optimization included determination of real-time PCR (rtPCR) amplification pattern and product melting peaks (CFX96 Touch real-time PCR detection system, CFX Maestro software; Bio-Rad), demonstrating number and size of PCR products using agarose gel electrophoresis, sequencing of PCR products, and verifying that the reaction efficiency was 90–110% (Suppl. Methods; Suppl. Fig. 1). 8 Optimization also included determination of ideal annealing temperature and cDNA dilution. Primers were tested and optimized using pooled FOSCC cDNA (SCCF1–3) and feline kidney cDNA (Suppl. Methods).19,25,47,54,56 Primers for VEGFB, HIF2A, and HIF3A were excluded from experiments due to very low expression revealed during optimization and validation (Suppl. Table 2). Primers for genes of interest COX2 and CD147, and reference genes RPS18, B2M, TUBB, HPRT1, and GAPDH (Suppl. Table 1), were previously designed and validated. 54 Reference gene stability was checked using M value determination (gene stability value) in CFX Maestro software (Bio-Rad). Under standard conditions, RPS18 and GAPDH were determined to be the most appropriate. For experiments involving treatment with exogenous PGE2 and an EP4 inhibitor (L-161,982), HPRT1 was added to RPS18 and GAPDH for a total of 3 reference genes.
RNA extraction and cDNA synthesis
RNA was extracted (RNeasy micro kit; Qiagen) according to the manufacturer’s instructions, which included DNase digestion to reduce gDNA contamination. RNA was eluted in 40 μL of elution buffer. RNA concentration and A260/A280 ratios were determined (NanoDrop ND-1000 spectrophotometer; Thermo). Isolated RNA was stored at −80°C until reverse-transcription (RT; iScript gDNA clear cDNA synthesis kit; Bio-Rad) according to the manufacturer’s instructions (250 ng of RNA in a 20-μL reaction volume). No reverse-transcriptase (NRT) controls were prepared on a subset of samples. A thermocycler (My-Cycler; Bio-Rad) was used for the cDNA synthesis reaction (5 min at 25°C, RT for 20 min at 46°C, and RT inactivation for 1 min at 95°C). cDNA was stored at −20°C until used for real-time quantitative PCR (RT-qPCR).
FOSCC expression of genes encoding PGE2 synthases, PGE2 receptors, HIF1α, and VEGFA
SCCF2 cells (2 × 10⁵) were seeded into each well of a 6-well plate (Fisher). Synchronized cell cultures were established by culturing cells for 48 h in a serum-containing growth medium, rinsing with sterile PBS, and adding serum-free medium containing 0.1% BSA (HyClone), followed by overnight culture. The next morning, the serum-free group remained in the serum-free medium while the medium for the synchronized group was replaced with a standard growth medium containing 10% FBS and cultured for 2 h followed by RNA extraction and cDNA synthesis. Serum-free and serum-induced (stimulated) cells were cultured in triplicate wells, and 3 independent experiments were performed. Quantitative RT-PCR (RT-qPCR) was performed to determine if the expression of genes encoding PGE2 synthases, PGE2 receptors, HIF1α, and VEGFA differed between FOSCC cell lines and between serum-free and serum-treated conditions.
Effect of PGE2 and EP4 inhibition on gene expression in SCCF2 cells in vitro
To model the effect of microenvironment PGE2 on FOSCC gene expression, exogenous PGE2 was added to the culture medium of FOSCC cell lines. SCCF2 cells have the highest COX2 gene expression, 54 and the inducible nature of EP4 expression was only significant in the SCCF2 cells (Fig. 2A). Furthermore, SCCF2 cells had invasive behavior in vivo and inducible expression of VEGFA in our study as well as others.7,20,40,41 Therefore, SCCF2 was selected for continued analysis.
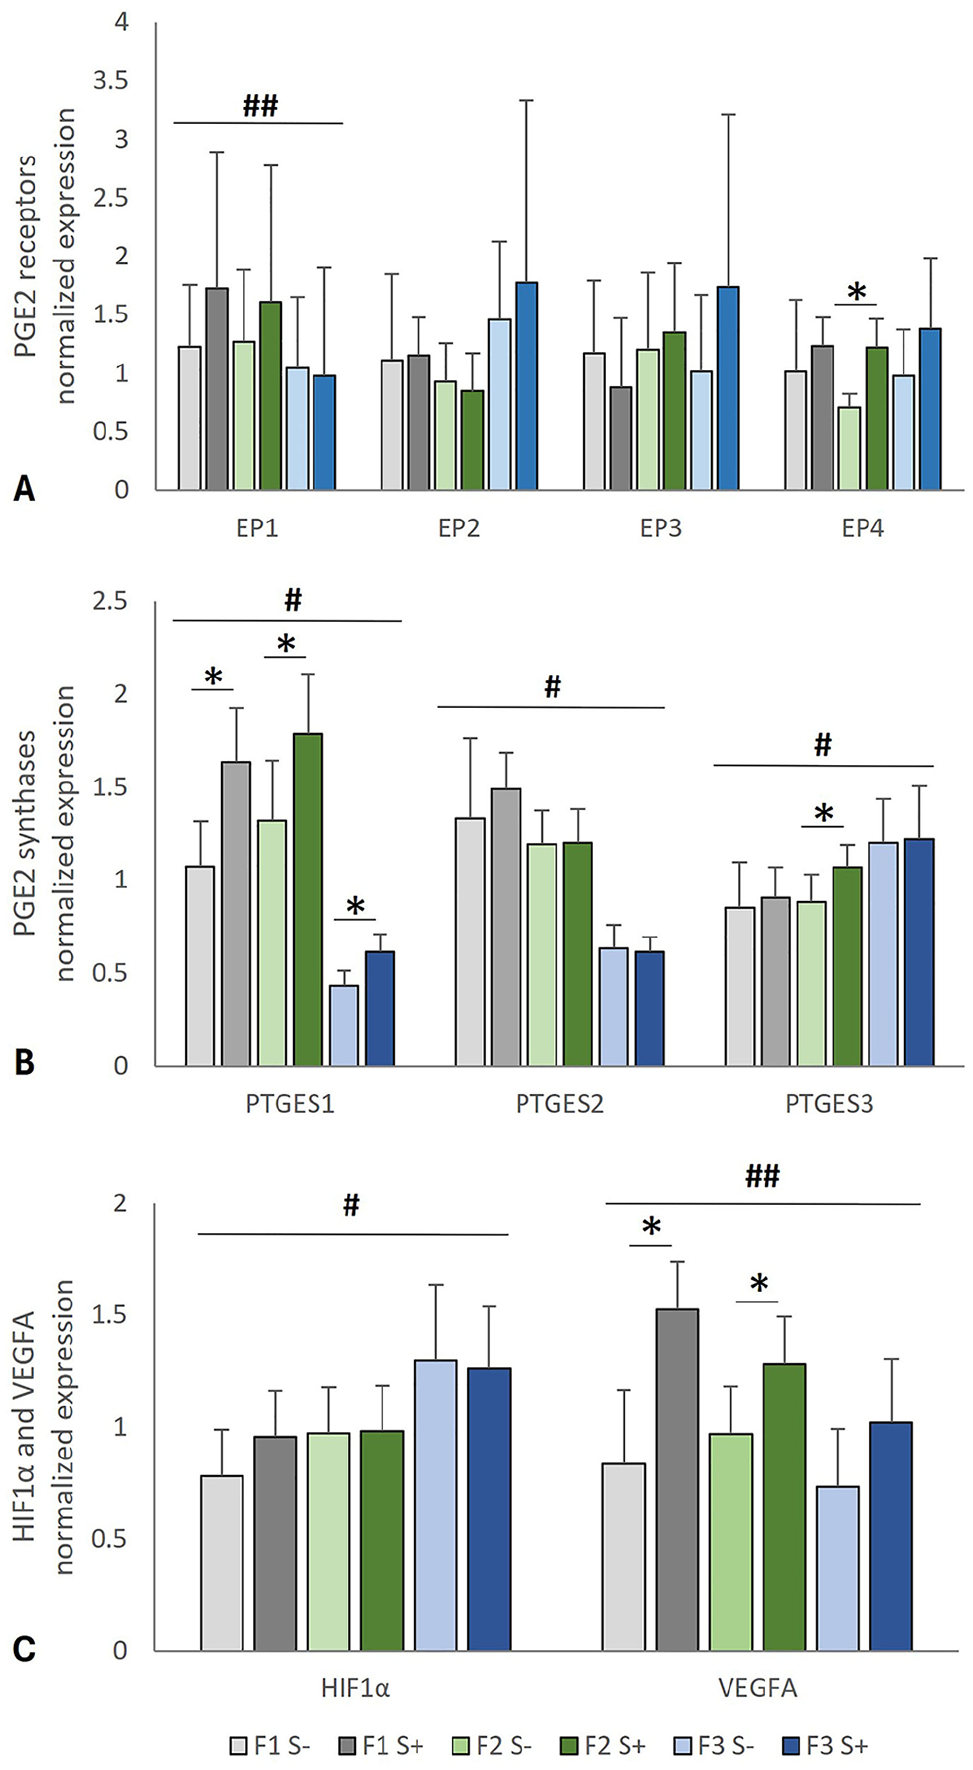
Expression of genes encoding PGE2 receptors, PGE2 synthases enzymes, HIF1α, and VEGFA in feline oral squamous cell carcinoma (FOSCC) using RT-qPCR. SCCF1 (F1), SCCF2 (F2), and SCCF3 (F3) cells were cultured overnight in serum-free conditions, followed by 2 h of serum-containing (S+) or serum-free (S–) medium. Each bar represents the mean fold-change in relative gene expression, and error bars show SD (3 replicate cultures per experiment, 3 independent experiments combined). P ≤ 0.05 was considered statistically significant. * = significant effect of serum; # = significant difference between cell lines in serum-free and in serum-treated conditions; ## = significant difference between cell lines only in serum-free conditions. ANOVA and Bonferroni post-hoc tests were used to compare gene expression between cell lines, and 2-tailed t-tests were used to compare serum-free to serum-treated conditions. Kruskal–Wallis tests were performed when the data were not normally distributed.
SCCF2 cells were cultured with exogenous PGE2 (Cayman Chemical), and changes in gene expression were determined. SCCF2 cells (2 × 10⁵) were seeded into each well of a 6-well plate and, after 2 d of growth, were cultured overnight in serum-free medium. There were 12 treatment groups, with 3 culture wells per group. Two concentrations of PGE2 were selected based on the literature and preliminary studies (0.35 µg/mL, 5 µg/mL)12,52 in addition to the vehicle-treated group (0.1% DMSO). These doses had no significant effect on SCCF2 viability over 24–72 h of exposure in preliminary studies (data not shown). Four exposure times (30, 60, 120, 240 min) were evaluated. RNA extraction and RT-qPCR assays were performed to determine the effect of PGE2 treatment on expression of CD147, COX2, EP4, HIF1A, and VEGFA genes. Expression in the PGE2-treated cells was calculated relative to the expression in the vehicle-treated cells. Three independent experiments were performed.
To determine the role of the EP4 receptor in SCCF2 cells with and without exogenous PGE2, an EP4 inhibitor (L-161,982; Cayman Chemical) was employed. The concentration of 7.5 µg/mL of L-161,982 was selected based on the literature, preliminary studies (data not shown), and solubility of L-161,982. 33 The effect of L-161,982 on SCCF2 viability was evaluated (in preparation for publication) with minimal effect after 72 h of exposure at comparable doses. 53 The experiment was done similarly to the exogenous PGE2 experiment and, following overnight culture in serum-free medium, the appropriate treatment was added. In this experiment, there were 4 treatment groups. Triplicate cultures of SCCF2 cells were untreated (0.1% DMSO vehicle only) or treated with either PGE2 alone (5 µg/mL), L-161,982 alone (7.5 µg/mL), or PGE2 combined with L-161,982. Cultures were pretreated with vehicle (0.1% DMSO), or L-161,982 for 30 min before 30-min treatment with vehicle, PGE2 alone, L161,982 alone, or PGE2 combined with L161,982. RNA extraction and RT-qPCR and semi-quantitative PCR assays were then performed to determine the effect or PGE2 and EP4 inhibition on expression of CD147, COX2, PTGES1, EP4, HIF1A, and VEGFA genes relative to vehicle-treated cells. Three independent experiments were performed.
Statistical analysis
Duplicate PCR reactions were used to generate an average Cq value for each sample and target. Each experimental condition included 3 replicate cultures (samples). Each experiment was performed 3 times, and the data were combined for analysis. Gene expression data were evaluated for normal distribution using Shapiro–Wilk tests (https://www.socscistatistics.com). When data were not normally distributed, comparisons were made using Kruskal–Wallis tests (https://www.socscistatistics.com). Parametric analyses were performed (Stata BE18; StataCorp). ANOVA and Bonferroni post-hoc tests were used to compare gene expression between cell lines and between PGE2 and EP4 treatments, and 2-tailed t-tests were used to compare serum-free to serum-stimulated conditions. Two-way ANOVA followed by Bonferroni post-hoc tests were used to evaluate the effect of PGE2 dose and exposure time. Values of p ≤ 0.05 were considered statistically significant. The results are graphically represented by showing normalized expression relative to the overall average of the samples or relative to the average gene expression for the control group.
Results
In vitro expression of genes encoding PGE2 synthases enzymes, PGE2 receptors, HIF1α, and VEGFA in FOSCC cell lines
PGE2 receptor transcripts (EP1–4; Fig. 2A), PGE2 synthase transcripts (PTGES1–3; Fig. 2B), and transcripts for HIF1A and VEGFA (Fig. 2C) were detected in all FOSCC cell lines (SCCF1–3) at various levels. Serum treatment resulted in increased expression of PTGES1 (which encodes mPGES1) in SCCF1, SCCF2, and SCCF3 cells (p < 0.001, p = 0.008, and p = 0.002, respectively) and increased expression of VEGFA in SCCF1 and SCCF2 cells (p < 0.001 and p = 0.008, respectively). Serum-induction of EP4 expression (p = 0.002) and PTGES3 expression (p = 0.01) was observed in SCCF2 cells but not in SCCF1 or SCCF3 cells. SCCF3 had the least PTGES1 (p < 0.001), PTGES2 (p < 0.001), and VEGFA (p = 0.005) expression of the 3 cell lines evaluated (Fig. 2). In contrast, SCCF3 cells had the most PTGES3 (p = 0.005) and HIF1A (p = 0.013) expression. Although mRNA copy number was not quantified, EP1, EP2, and EP3 demonstrated late and inconsistent amplification (x− Cq of 32–34 for all cell lines combined) compared to EP4 with an x− Cq of 27 across all cell lines, suggesting that EP4 was the dominantly expressed PGE2 receptor under conditions of serum induction. There appeared to be an inverse relationship between HIF1A and VEGFA, where SCCF3 had the most HIF1A and the least VEGFA expression (Fig. 2C).
The effect of exogenous PGE2 on expression of HIF1A, VEGFA, CD147, COX2, and EP4 genes in SCCF2 cells
To determine if rising levels of PGE2 in the tumor microenvironment could impact FOSCC gene expression, we added exogenous PGE2 to SCCF2 cultures at 4 times (30, 60, 120, 240 min). Exogenous PGE2 (0.35 µg/mL and 5 µg/mL) affected the expression of HIF1A, VEGFA, CD147, COX2, and EP4 mRNA levels in SCCF2 to various degrees and in a time-dependent fashion (Fig. 3). Both concentrations of PGE2 caused a statistically significant increase of HIF1A (p < 0.001 and p = 0.001, respectively; Fig. 3A) and CD147 (p = 0.031 and p = 0.015, respectively; Fig. 3C) at 240 min. Although VEGFA expression at 240 min was nominally increased, the effect was not statistically significant (p = 0.072; Fig. 3B). Nominal increases in HIF1A and VEGFA expression were observed after 30 min of 5 μg/mL of PGE2 exposure. There was a transient increase of COX2 expression at 30 min (p = 0.04, p < 0.001; Fig. 3D) followed by suppression at 60 min (p = 0.03, p = 0.019) and 120 min (p < 0.001, p = 0.007). EP4 expression was sharply reduced by both doses of PGE2 at 60 min (p < 0.001) and nominally increased at 240 min (p = 0.063, p = 0.07; Fig. 3E).
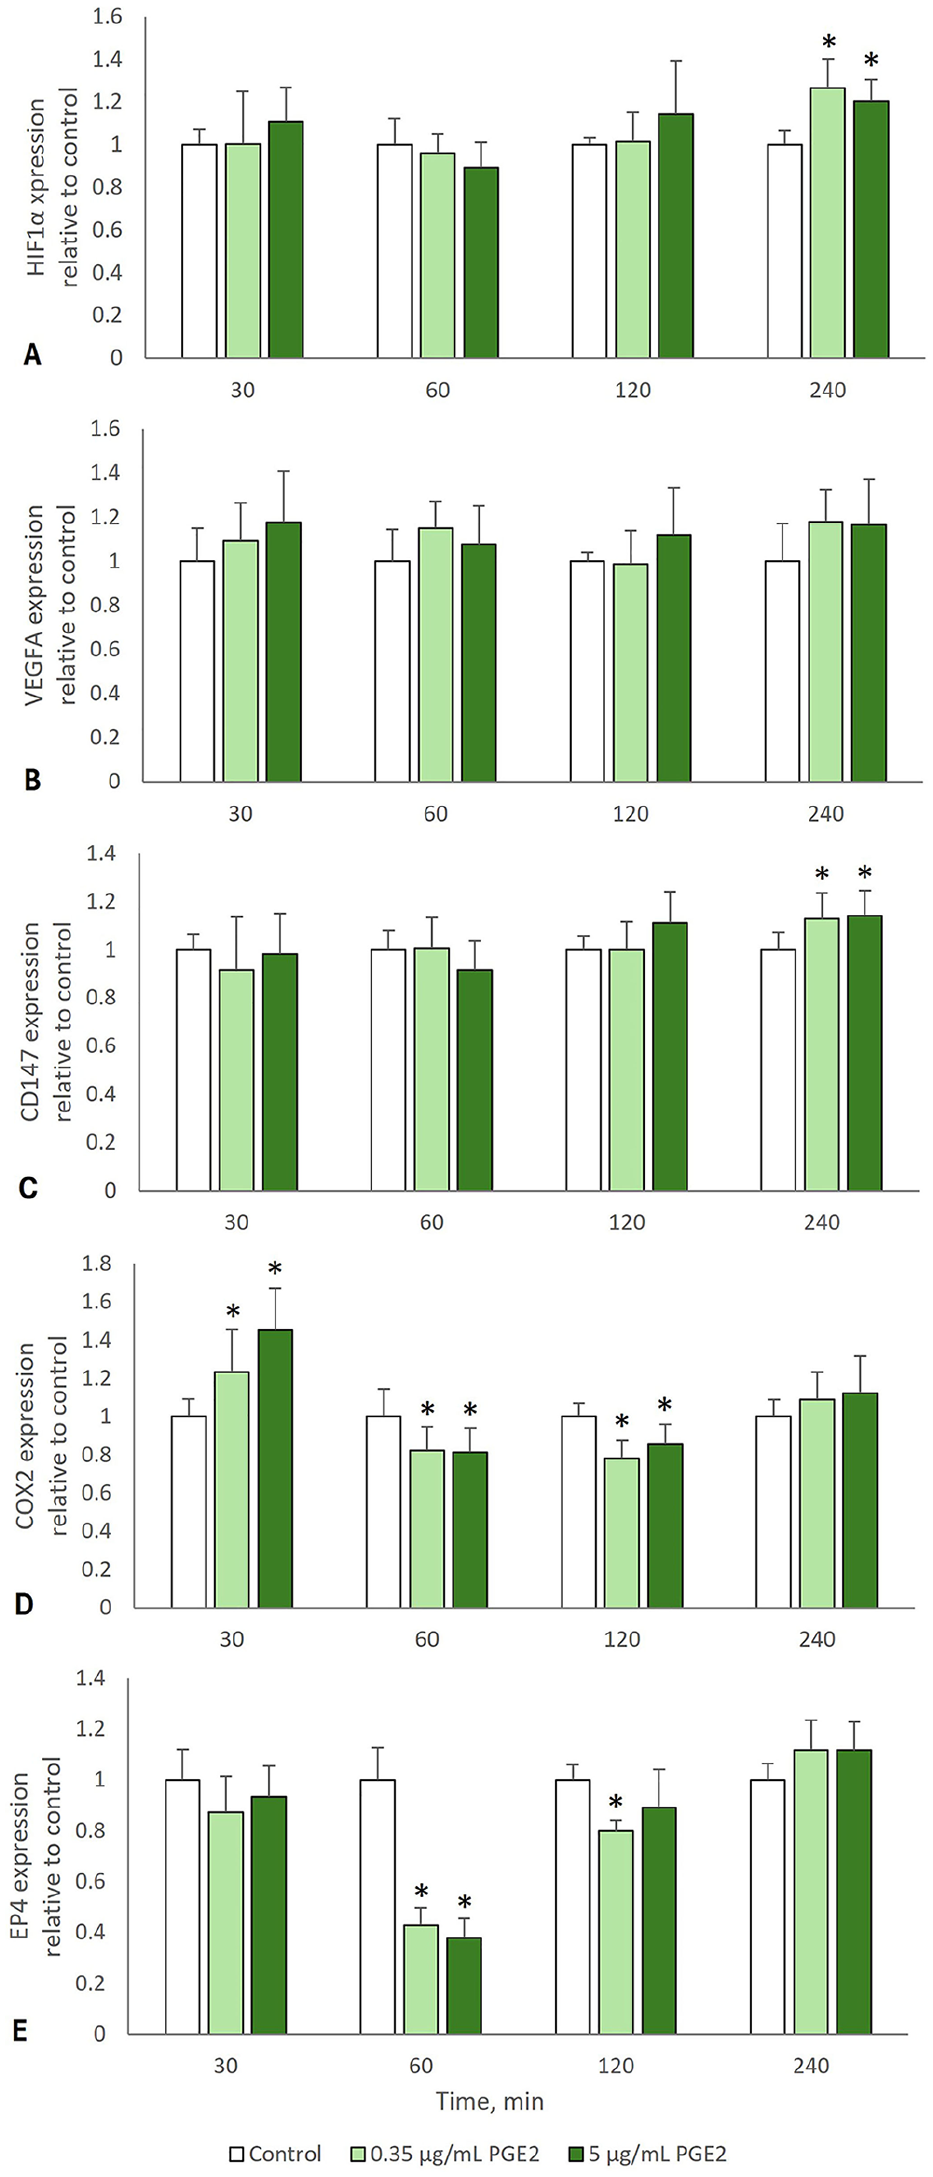
The effect of exogenous PGE2 on expression of genes encoding HIF-1α, VEGFA, CD147, COX2, and EP4 in SCCF2 cells. SCCF2 cells were cultured overnight in serum-free conditions, followed by treatment with 0 µg/mL (vehicle-only), 0.35 µg/mL, or 5 µg/mL of PGE2 for 30, 60, 120, and 240 min. All vehicle and PGE2 treatments included 0.1% DMSO. Each bar represents the mean fold-change in gene expression relative to vehicle-treated SCCF2 cells, and error bars show SD (3 replicate cultures per experiment, 3 independent experiments combined). Two-way ANOVA was used to evaluate the effect of PGE2 dose and exposure time, followed by Bonferroni post-hoc tests. P ≤ 0.05 was considered statistically significant (*).
The effect of EP4 inhibitor (L-161,982) on expression of HIF1A, VEGFA, CD147, COX2, EP4, and PTGES1 genes in feline SCCF2 cells
Qualitative evidence suggested that the dominantly expressed PGE2 receptor in FOSCC cell lines was EP4 (Fig. 2). The early time of 30 min for PGE2 exposure was selected based on the induction of COX2 observed in the previous experiment. Effects of treatment on expression of CD147 (p = 0.73), HIF1A (p = 0.797), and VEGFA (p = 0.101) did not reach statistical significance at this time (Fig. 4). However, there were mild nominal increases in HIF1A and VEGFA expression following PGE2 treatment that was not prevented by L-161,982. Treatment of SCCF2 cells with L-161,982, with or without exogenous PGE2, resulted in a mild, yet significant, increase in EP4 gene expression (p < 0.001). The EP4 inhibitor combined with exogenous PGE2 had the greatest stimulatory effect on COX2 expression in SCCF2 cells (p < 0.001; Fig. 4). There was a non-statistically significant increase in PTGES1 expression following PGE2 treatment (p = 0.126), which was not observed in the presence of L-161,982.
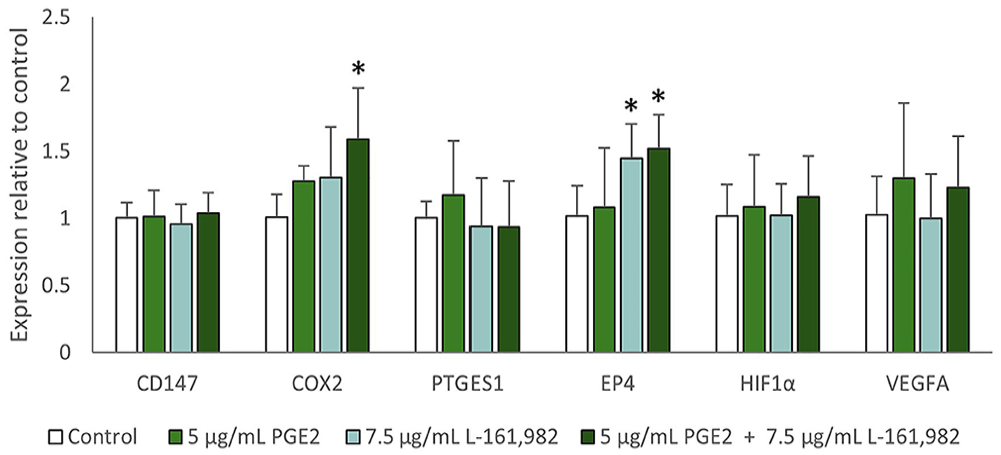
The effect of EP4 inhibitor (L-161,982) on expression of genes encoding HIF1α, VEGFA, CD147, COX2, EP4, and PTGES1 in SCCF2 cells. SCCF2 cells were cultured overnight in serum-free conditions, followed by treatment with vehicle-only (0.1% DMSO), 5 µg/mL of PGE2, 7.5 µg/mL of L-161,982, or 5 µg/mL of PGE2 combined with 7.5 µg/mL of L-161,982. All treatments included 0.1% DMSO. Each bar represents the mean fold-change in gene expression relative to vehicle-treated SCCF2 cells, and error bars show SD (3 replicate cultures per experiment, 3 independent experiments combined). ANOVA and Bonferroni post-hoc tests were used to compare gene expression between treatment groups. Kruskal–Wallis tests were performed when the data were not normally distributed. P ≤ 0.05 was considered statistically significant (*). The 30-min exposure was selected based on the short-term stimulation of COX2 mRNA expression by PGE2, as shown in Fig. 3. PGE2 treatment caused a nominal increase in expression of COX2 (p = 0.215) and PTGES1 (p = 0.158). Although increased PTGES1 expression appeared to be prevented by the EP4 inhibitor, COX2 expression was highest when SCCF2 cells were treated with PGE2 and the EP4 inhibitor (p < 0.001). EP4 inhibitor alone and in combination with PGE2 caused increased EP4 expression (p < 0.001). Although not statistically significant, PGE2 caused subtle, numeric increases in HIF1A and VEGFA that did not appear to be prevented by the EP4 inhibitor. There was no apparent effect of EP4 inhibitor on CD147 mRNA expression.
Discussion
Serum exposure stimulated PTGES1 expression in all 3 cell lines, which was similar to what was observed for COX2 in our previous study. 54 SCCF2 has been shown to have the highest COX2 expression, 54 and had the highest PTGES1 expression in our study, although the magnitude of difference between PTGES1 expression between cell lines was not as remarkable as for COX2. This lends support to some degree of coordinated expression for these genes. However, expression of PTGES1 in SCCF1 cells was only modestly lower than in SCCF2 cells, despite COX2 expression being dramatically lower in SCCF1 compared to SCCF2 cells. 54 This suggests that the relationship between PTGES1 and COX2 expression may be complex and cell-line dependent, despite reports of studies of human OSCC and cancer of the prostate, lung, and colon.3,9,14,31,62
We found no significant effect of serum on PTGES2 expression. PTGES2 has been reported to be moderately coordinated with COX2 expression in human cancer. 48 Although previous work showed that COX2 expression is serum-inducible in these cell lines, 54 we observed no stimulation of PTGES2 expression. Furthermore, the pattern of PTGES2 expression across the 3 cell lines did not closely match the pattern of COX2 expression reported previously (Table 1). 54 Our findings suggest that COX2 and PTGES2 expression are not as highly linked in FOSCC cells as they appear to be in some of the human cancer literature.
PTGES3 expression has been reported to be coupled with COX1 expression to maintain PGE2 production for cellular homeostasis. 70 We found that PTGES3 gene expression was induced by serum exposure in SCCF2 cells, similar to how expression of COX2 is serum-induced. 54 This suggests that expression of PTGES3, in addition to PTGES1, could be coordinated with COX2 expression in SCCF2 cells. In a human breast cancer study, PTGES3 expression (but not PTGES1 expression) followed COX2 expression, and the authors concluded that PTGES3 could be used as a prognostic marker in breast cancer survival. 2 It is possible that coordinated production of COX2 and PTGES3 are important in a subset of FOSCC cases. On the other hand, we previously showed that COX1 expression was relatively high in SCCF3 (Table 1), 54 and here, PTGES3 expression was also relatively high in SCCF3 cells. This is consistent with the theory that PTGES3 and COX1 levels are coupled in order to maintain a basal level of PGE2 production, which has been shown in human OSCC. 9 From the above, we speculate that COX2 and COX1 may both play a role in PGE2 production in FOSCC, along with PGE2 synthases in a manner that may vary between individual FOSCC patients.
Amplification curves and Cq values indicated very low expression of EP1–3 in all 3 FOSCC cell lines, which was unchanged following serum exposure. In contrast, serum exposure caused a statistically significant increase in EP4 expression in SCCF2 cells, and nominal (albeit not statistically significant) increase in EP4 expression in SCCF1 and SCCF3, reminiscent of the stimulatory effect of serum exposure on COX2 expression in these cells. 54 Levels of EP4 mRNA and EP4 protein have been shown to be increased in canine SCC, apocrine gland anal sac adenocarcinoma, and urothelial carcinoma compared to normal tissues as detected by RT-PCR and IHC. 50 Additionally, EP4 mRNA expression was increased in canine lymphoma compared to reactive lymph nodes, 51 as well as in canine osteosarcoma compared to normal nasal turbinate bone. 49
The dominant type of EP receptor in a tumor could have implications for tumor behavior and therapy due to the receptors being associated with different intracellular signaling pathways. In humans, one study has shown EP4 to be the dominant PGE2 receptor in OSCC 60 and another showed that an EP4 inhibitor (L-161,982) blocked PGE2-mediated signaling in tongue OSCC cells. 33 Similarly, another report showed that EP4 is the most prominent EP receptor in colorectal cancer cells. 65 PGE2 binding to EP4 leads to activation of adenylate cyclase, increasing cAMP and activity of PI3K and subsequent signaling through AKT.37,69 The AKT pathway has been shown to be activated in human OSCC,21,66 and has been shown in human cancer, including colorectal carcinoma, to be triggered by EP4 binding.59,65 In veterinary medicine, the AKT pathway had been shown to be activated in FOSCC 10 and a PI3K inhibitor (LY294002) was anti-proliferative and pro-apoptotic in human, canine, and feline OSCC cells. 67 Herein, EP4 expression was stimulated by serum exposure in SCCF2 cells, similar to what we have seen for COX2. 54 This raises the possibility that EP4 may be important in PGE2-mediated effects in SCCF2 cells, possibly leading to activity of the AKT pathway, as reviewed by others. 59 The AKT pathway as a signaling node downstream of EP4 in FOSCC deserves investigation.
Not all studies point to EP4 as the dominant EP receptor in OSCC. Other researchers have shown the importance of EP3 in human OSCC,1,22 and an IHC study revealed that COX2 and PTGES1 are expressed with EP2 in canine and feline mammary cancer, leading the authors to conclude that they work together to maintain PGE2-related fuctions. 44
Regardless of serum-free or serum-treated conditions, VEGFA was expressed in all 3 of our FOSCC cell lines. This is consistent with others who showed VEGFA expression in FOSCC cells,7,20 as well as in invasive feline mammary carcinoma samples, 45 and in canine SCC, fibrosarcoma, and melanoma. 68 VEGFA expression was also reported in feline and canine cutaneous SCCs and OSCC tissues by IHC. 47 Serum exposure caused a significant increase in VEGFA mRNA expression in SCCF1 and SCCF2 cells. A similar increase was observed in SCCF3 cells, but statistical significance was not reached (p = 0.054). This effect on VEGFA expression occurred without a corresponding statistically significant increase in HIF1A expression. Interestingly, serum-treated SCCF3 had the highest expression of HIF1A and the lowest expression of VEGFA. Future studies evaluating VEGFA protein levels in SCCF3 cells would help characterize this finding.
Our 3 cell lines only differed in VEGFA expression in serum-exposed conditions, with SCCF1 cells having the highest expression. This is similar to a study that showed SCCF1 cells increased secretion of VEGFA to the greatest degree (compared to SCCF2 and SCCF3) following treatment with epidermal growth factor. 20 In contrast, SCCF3 had relatively high HIF1A expression in our study. In a different study, SCCF2 cells treated with LLL12 (selective inhibitor of STAT3 phosphorylation) responded with significantly increased VEGFA and HIF1A gene expression, but SCCF3 cells did not. The authors showed that phosphorylated STAT3 levels were low in SCCF3 cells. 7 Perhaps the relatively low expression of VEGFA observed in SCCF3 cells observed herein could be explained by lower activity of the STAT3 intracellular signaling pathway. Future studies are needed to test this hypothesis.
The pattern of HIF1A and VEGFA expression observed in our gene expression screening experiment did not closely match our expectations, which was that the cell line with the highest HIF1A expression would also have the highest VEGFA expression. Perhaps performing this study under standard (normoxic) conditions played a role. HIF1α is known to be degraded in normoxic conditions due to the instability of the alpha unit. In hypoxic conditions, it becomes stable, triggering the expression of target genes such as VEGFA. 30 Our focus was on gene expression rather than protein stability. Therefore, it is uncertain whether the relatively high level of HIF1A mRNA in SCCF3 cells corresponded to elevated levels of HIF1α protein. On the other hand, an IHC study of 80 samples of tongue OSCC found that there was no relationship between HIF1α and VEGFA protein expression, suggesting that there are other ways of regulating VEGFA expression in OSCC besides HIF1α protein levels alone. The authors concluded that HIF1α is correlated with levels of VEGFC, not VEGFA. 24
After determining the expression of genes encoding PTGES enzymes, prostaglandin E2 receptors, HIF1α, and VEGFA under standard conditions, we investigated the effect of adding exogenous PGE2 to SCCF2 cells. Exogenous PGE2 caused a non-statistically significant increase in VEGFA expression. As mentioned above, VEGFA protein expression is increased by hypoxia and is related to angiogenesis and poor prognosis in human OSCC. 11 A study using colorectal adenoma cells showed that exogenous PGE2 caused a small, but not significant, increase of VEGFA expression after 6 h, 42 and PGE2 only increased VEGFA expression in human tracheal cells after 24 h of exposure. 6 However, others showed that PGE2 exposure induced COX2, PTGES1, and VEGFA expression in chronic obstructive pulmonary disease. 15 It is possible that PGE2 might have had more effect on VEGFA expression in hypoxic conditions, as demonstrated by others who found that exogenous PGE2 augments the effects of hypoxia on human umbilical vein endothelial cells and partially reverses the effect of a selective COX2 inhibitor on angiogenesis. 76
HIF1A mRNA expression was increased after 240 min of exogenous PGE2 exposure, consistent with others who found that PGE2 stimulates HIF1α in the absence of hypoxia, in murine and human mammary carcinoma cells.63,69 HIF1α stimulates PGE2 production, and inhibition of HIF1α and EP4 causes a reduction in VEGFA mRNA in breast, colon, and melanoma cancer cell lines. 28 In human prostate cancer cells and renal proximal tubular cells, exogenous PGE2 caused increased HIF1α expression through the PI3K/AKT pathway. 35 On the contrary, a report found no effect of exogenous PGE2 on HIF1A mRNA expression in a prostate cancer cell line, although the protein level was increased. 34 The authors concluded that PGE2 promotes HIF1α stabilization in the nucleus, supporting the importance of PGE2 in HIF1α regulation.
Regarding CD147, we observed a significant increase in gene expression at 240 min of PGE2 treatment. CD147 mRNA and CD147 protein expression in human and feline OSCC samples and cell lines has already been reported.54,55 Anti-CD147 therapy in mice bearing OSCC xenografts resulted in delayed tumor growth compared to untreated controls. 16 CD147 expression in macrophages has been shown to be upregulated via the COX2/PGE2 signal transduction pathway. 74 Another study revealed a relationship between CD147, COX2, and inflammation, in which COX2 modulated the production of CD147 via a PGE2-dependent pathway in human macrophages. 13 CD147 levels have been shown to be correlated with HIF1α in lingual OSCC by IHC, 24 which is consistent with our finding that 4 h of PGE2 treatment caused an increase in CD147 and HIF1A mRNA expression.
Findings of several cancer research studies suggest that COX2, PGE2, and EP4 may work together.26,27,36 Herein, PGE2 treatment led to a significant and rapid increase of COX2 mRNA expression (30 min) followed by a period of suppression (60 and 120 min). A similar acute response was observed by others when 30 min of exogenous PGE2 exposure caused an increase in COX2 expression in human prostate cancer cells and renal proximal tubule cells. The author speculated that PGE2 regulates expression of its own synthesizing enzyme (COX2) in a positive feedback loop during tumor progression, through the AKT signaling pathway. 35 Additionally, exogenous PGE2 stimulated COX2 expression in a prostate cancer cell line, 34 and in human colorectal adenoma and carcinoma cell lines.23,42,75
COX2 54 and EP4 mRNA expression were similar in that they were both serum-inducible, and their expression was suppressed following 60 and 120 min of PGE2 treatment. A similar EP4 effect was reported in human monocyte cultures, in which PGE2 treatment suppressed the stimulatory effect of lipopolysaccharide on EP4 expression in blood monocytes and in a monocyte cell line. 29 Treatment of 7 human OSCC cell lines with dmPGE2 (a stable PGE2 analog) caused increased EP1, EP2, and EP3 gene expression, but did not increase EP4 expression. 1 The response to PGE2 herein raises the possibility that there could be a homeostatic mechanism that suppresses COX2 and EP4 expression in the face of increasing PGE2 levels, at least transiently.
It was interesting to see a nominal increase in COX2 mRNA expression after treatment with EP4 inhibitor alone, and surprising to see that COX2 mRNA expression was highest when the cells were treated with PGE2 and the EP4 inhibitor in combination. This indicated that the EP4 inhibitor was capable of exerting an effect on SCCF2 cells, but the effect of PGE2 on COX2 expression was mediated through a different receptor or mechanism. This raises the possibility that even though the expression of the other PGE2 receptors was quite low on an mRNA level, one of them may still be responsible for binding to PGE2 and triggering an acute, transient increase in COX2 expression. Like COX2, we observed that the EP4 inhibitor stimulated EP4 mRNA expression, regardless of the presence or absence of exogenous PGE2. Review of the literature does not suggest an explanation for this observation. However, if EP4 agonists are capable of inhibiting EP4 gene expression as shown in monocytes, 29 then perhaps EP4 antagonism is capable of causing a reciprocal stimulation of EP4 mRNA expression. Studying PGE2 and EP4 inhibition at additional times would help determine if EP4 mRNA expression in SCCF2 cells is regulated by PGE2 abundance and EP receptor activity.
Other studies have shown that PGE2 exerts effects independently of EP4. For example, an EP4 inhibitor (ONO-AE3-208) did not affect the proliferation of human OSCC cell lines, whereas an EP3 inhibitor (ONO-AE3-240) partially reduced human OSCC cell line proliferation through reduced COX2 expression and PGE2 synthesis. The authors concluded that COX2, PGE2, and EP3 have a vital role in the development of OSCC. 22 On the other hand, EP4 antagonist L-161,982 inhibited proliferation and stimulated apoptosis in a COX2/PGE2 dependent manner in human OSCC cells, 33 and EP4 inhibitor ONO-AE3-208 reduced proliferation and metastasis in breast and lung cancer cell lines. 73
Although not statistically significant, it was interesting that there was a numeric increase in PTGES1 expression after PGE2 treatment that was not observed when the cells were pre-treated with L-161,982. The ability of PGE2 to cause an increase in PTGES1 expression has been shown in human OSCC cell lines co-cultured with fibroblasts. 3 Understanding the consequences of EP4 inhibition is important because EP receptor antagonists are being investigated as a treatment for pain and inflammation in veterinary patients.64,72 For example, an EP4 receptor antagonist (grapiprant) has been approved for treating pain and inflammation in dogs. 18 Future studies utilizing additional cell lines are needed to better understand the significance of EP4 activity in FOSCC cells, especially if EP4 inhibition has the ability to cause a paradoxical increase in COX2 and EP4 expression in feline cells.
Supplemental Material
sj-pdf-1-vdi-10.1177_10406387251315677 – Supplemental material for In vitro expression of genes encoding HIF1α, VEGFA, PGE2 synthases, and PGE2 receptors in feline oral squamous cell carcinoma
Supplemental material, sj-pdf-1-vdi-10.1177_10406387251315677 for In vitro expression of genes encoding HIF1α, VEGFA, PGE2 synthases, and PGE2 receptors in feline oral squamous cell carcinoma by Walaa Hamed Shaker Nasry, Juan Carlos Rodriguez-Lecompte and Chelsea K. Martin in Journal of Veterinary Diagnostic Investigation
Footnotes
Acknowledgements
We thank laboratory technician Haili Wang (Department of Pathology and Microbiology, UPEI) for invaluable technical assistance and Dr. Spencer Greenwood (Department of Biomedical Sciences, UPEI) for access to equipment that facilitated this work.
Declaration of conflicting interests
The authors declared no potential conflicts of interest with respect to the research, authorship, and/or publication of this article.
Funding
Our work was supported by the Natural Sciences and Engineering Research Council of Canada (NSERC; RGPIN-2019-06898, Chelsea K. Martin), the Zoetis Investment in Innovation Fund (Chelsea K. Martin, Juan Carlos Rodriguez-Lecompte), and MITACS Training Award (Walaa Hamed Shaker Nasry).
Supplemental material
Supplemental material for this article is available online.
References
Supplementary Material
Please find the following supplemental material available below.
For Open Access articles published under a Creative Commons License, all supplemental material carries the same license as the article it is associated with.
For non-Open Access articles published, all supplemental material carries a non-exclusive license, and permission requests for re-use of supplemental material or any part of supplemental material shall be sent directly to the copyright owner as specified in the copyright notice associated with the article.