
Abstract
Phenobarbital is a common antiseizure medication that has a relatively narrow therapeutic window. Therapeutic drug monitoring (TDM) is a helpful tool to guide dose adjustments for phenobarbital and avoid its toxicity. We investigated the agreement among 3 methods of quantifying phenobarbital in canine plasma: high-performance liquid chromatography (HPLC), point-of-care (POC) testing, and the FDA-approved immunoassay analyzer. We randomly selected 45 plasma samples obtained by the TDM service (College of Veterinary Medicine, Auburn University, Auburn, AL, USA). Passing–Bablok regression and Lin concordance correlation coefficients (CCCs) were used to determine the agreement of the results obtained for the 3 methods; Bland–Altman plots were used for bias analysis using the results from the HPLC method as a reference. The FDA-approved immunoassay analyzer and POC immunoassay method results agreed with the HPLC. The results from the FDA-approved immunoassay analyzer were better correlated than those from the POC method, with Lin CCCs of 0.96 (95% CI: 0.93–0.98) and 0.94 (95% CI: 0.90–0.97), respectively. The average biases of the FDA-approved and the POC immunoassay analyzers were 0.80 and −0.64 µg/mL, respectively. Based on the CIs of Lin CCCs, the commercial POC phenobarbital test is a good screening tool and agrees with the HPLC method. However, the FDA-approved immunoassay analyzer method allows for more accurate quantification of phenobarbital concentrations, which is required for appropriate dose adjustment of phenobarbital.
Phenobarbital is one of the drugs of choice for the control of epileptic seizures in dogs.8,30,35 A patient’s clinical response and toxicity are correlated with the plasma phenobarbital concentration. 11 Because the disposition of phenobarbital is complicated by hepatic metabolism, 22 it is difficult to predict the plasma drug concentration by dosage alone. Inter- or intra-individual variability and unpredictability of plasma phenobarbital concentrations can have serious clinical consequences,25,29 such as uncontrolled epileptic seizures when plasma drug concentrations (PDCs) decrease to subtherapeutic ranges. Also, high PDCs may lead to adverse effects such as elevated liver enzyme activities,2,20 altered response to adrenocortical function, 13 decreased serum thyroid hormone concentrations, 20 induced pancytopenia, 37 and clinically apparent hepatotoxicosis.5,16 The recommended therapeutic reference interval for the serum phenobarbital concentration is 15–45 µg/mL for the treatment of canine epileptic seizures. 18 However, it has been suggested that the risk of hepatotoxicity may increase with concentrations >35 µg/ml. 16 Although several factors may contribute to the drug concentration, a plasma concentration is the only predictor to guide a dose adjustment, not only to improve epileptic seizure control but also to avoid serious adverse effects from the long-term use of phenobarbital. Therefore, monitoring plasma phenobarbital concentration is necessary to establish the patient’s therapeutic interval after initial phenobarbital treatment and to monitor efficacy and toxicity.
A point-of-care (POC) phenobarbital immunoassay is commercially available and has been used increasingly in small animal practices due to its convenience. It has a rapid turnover rate and provides results on-site. The POC test is based on a competitive binding immunoassay 26 ; however, measurement accuracy is questionable due to a lack of standard QC for each run. Another commercial instrument used in diagnostic laboratories is a U.S. Food and Drug Administration (FDA)-approved automated immunoassay analyzer. It is reliable because each phenobarbital analysis requires routine QC. Results are delivered quickly, and the instrument can run multiple samples in a batch; however, the turnover of results to the clinicians is consumed by shipping the sample to a laboratory and processing time. This increase in turnaround time compared to the POC analyzer may be problematic in patients who are not controlled or if the clinician measuring phenobarbital concentrations is concerned about toxicity.
The high-performance liquid chromatography (HPLC) method is the gold standard for the analysis of several compounds and is employed in research due to its reliability, accuracy, and precision.32,34 However, additional steps for HPLC methods are required compared to automated methods, such as sample preparation, standard curve construction, interpretation, and result reports.32,34 Thus, HPLC is not a practical method for use in clinic laboratories.
Determination of the agreement of the 2 commercial immunoassay instruments with HPLC on the same samples has yet to be documented. Differences in the results of various phenobarbital assays may lead to errors in dose adjustment or cause uncontrolled epileptic seizures or drug overdose toxicity.32,34 Our objective was to compare 2 commercial automated POC and FDA-approved immunoassay analyzers for quantifying plasma phenobarbital concentrations with the gold standard, the HPLC method.
Materials and methods
We randomly selected 45 plasma samples from the archived canine samples submitted to the Clinical Pharmacology Laboratory (CPL; College of Veterinary Medicine, Auburn University, Auburn, AL, USA) for phenobarbital therapeutic drug monitoring analysis. The selection was based on 3 ranges of phenobarbital concentrations as determined by the FDA-approved immunoassay analyzer (15 samples for each range): low = <15 µg/mL, middle = 16–29 µg/mL, and high = >30 µg/mL. The maximum storage time of selected samples was 90 d, and the minimum was 30 d. All 45 samples had no abnormal gross appearance and passed pre-analytical hemolysis, icterus, and lipemia interference examination by an integrated clinical chemistry system (Dimension Xpand Plus; Siemens). All samples were re-coded to anonymize 3 laboratory technicians. One technician was assigned to perform each method.
Quantification of plasma phenobarbital concentrations
Although the phenobarbital concentrations of selected plasma samples were obtained from a database at the CPL, all 3 methods were performed simultaneously within 2 wk to minimize any storage-time effect.
Point-of-care immunoassay
The POC test was carried out on a chemistry analyzer with a commercial phenobarbital reagent kit (Catalyst Dx chemistry analyzer; PBHR, Idexx), according to the manufacturer’s instructions. Before the study, the manufacturer’s technician performed QC using the commercial kit (PHBR control; Idexx) and routine instrument maintenance.
FDA-approved immunoassay analyzer
The integrated clinical chemistry system that we used (Dimension Xpand Plus; Siemens) is the FDA-approved immunoassay analyzer used to quantify plasma phenobarbital with a commercial kit (Dimension PHNO homogeneous particle enhanced turbidimetric inhibition immunoassay; Siemens). The assay is calibrated with a plasma calibrator (Dimension DRUG CAL; Siemens) set for 0–80 μg/mL concentrations. The lower limit of quantification is 1 µg/mL, and the CV is 4.4% at 12.1 μg/mL and 4.6% at 28.2 μg/mL in pooled canine plasma. The U.S. FDA approved this method as a reference laboratory chemical analyzer in human medicine. 41
High-performance liquid chromatography method
Phenobarbital was quantified in canine plasma based on modifications of assays developed previously.6,17 Phenobarbital was extracted from canine plasma by protein precipitation. The HPLC system used was a 2695 separations module and a 2489 UV-visible detector (Waters). Separation was with a Sunfire C18, 5 µm, 4.6 × 150-mm column (Waters) at 30ºC. The mobile phase consisted of 65:35 of water:acetonitrile (VWR), respectively, with a flow rate of 1.0 mL/min. The retention time for phenobarbital was 4.5 min, and UV absorbance was monitored at 205 nm. The standard curve was generated with concentrations of 2.5–50 µg/mL by adding known amounts of phenobarbital (MilliporeSigma) reference standard to canine plasma. The precision (CV%) for phenobarbital in canine plasma at 2.5, 10, 30, and 50 µg/mL were 3.10%, 0.97%, 0.95%, and 0.62%, respectively. The limit of detection (LOD) and the limit of quantification (LOQ) were 1 µg/mL and 2.5 µg/mL, respectively, for canine plasma. The accuracy (% recovery) at 2.5, 10, 30, and 50 µg/mL was 96.5%, 99.7%, 100.2%, and 100.0%, respectively. If phenobarbital concentrations exceeded 50 µg/ml, samples were diluted in blank plasma as 1:2.
Statistical analysis
All analyses were performed with SAS v.9.4 (SAS). Scatter plots of results from tests (y-axis) and the gold standard (x-axis) data were created to visualize, and the Passing–Bablok method estimated linear regression parameters with 95% CIs. Two-method equivalence was assessed based on the CI estimated parameters; the tests are equivalent when the CI parameters of Passing–Bablok regression for the intercept contain 0. The CI for the slope must contain 1.9,33 The Lin concordance correlation coefficient (CCC) was computed to estimate degree agreement between methods: >0.99 = almost perfect; 0.95–0.99 = substantial; 0.90–0.95 = moderate; and <0.90 = poor.3,27 The absolute and percentage bias of tested method values compared to HPLC values were explored graphically using Bland–Altman plots.10,19 The bias average and 95% limits of agreement were computed using the Bland–Altman technique. The Bland–Altman plot was also used to identify outliers in the data outside the lines representing the SD for the mean difference. The Pearson correlation coefficient (r) between the reference and test was calculated, and the correlation was significant at p ≤ 0.05. The paired samples t-test was used to compare the differences of the means between the tested and reference methods; significantly different from zero or no bias.
Results
Quantification limits and storage stability
The tested quantification ranges were 2.5–50.0 µg/mL for HPLC (2.5–100 µg/mL with 2-fold dilution), 1.0–80.0 µg/mL for the FDA-approved immunoassay analyzer, and 5.0–55.0 µg/ml for the POC method. The CV% of phenobarbital concentrations of the initial concentrations and at the time of study in the same samples from the FDA-approved method were calculated to ensure that storage did not affect drug stability. The initial phenobarbital concentrations of the 3 ranges were close to the current concentrations with CV% of 17.4%, 6.2%, and 7.3% for low, middle, and high ranges of phenobarbital concentrations, respectively.
Comparison between the HPLC method and FDA-approved immunoassay analyzer
Analysis of 45 samples for phenobarbital was successful on the HPLC and FDA-approved immunoassay analyzer, with concentrations of 3.1–68.8 µg/mL and 3.5–79.8 µg/mL, respectively. Passing–Bablok regression analysis between the FDA-approved immunoassay analyzer and HPLC tests indicated that these 2 methods were equivalent by the 95% CI of the y-intercept including zero (95% CI: −0.69 to 1.80 µg/ml) and the slope including the value 1 (95% CI: 0.94–1.07 µg/mL; Table 1, Fig. 1). The Lin CCC was 0.96 (95% CI: 0.93–0.98), with a Pearson correlation coefficient of r = 0.96, giving substantial concordance between the HPLC method and the FDA-approved immunoassay analyzer. Bland–Altman analysis revealed a minimally overestimated bias between the HPLC and FDA-approved immunoassay tests with a x̄ and SD of 0.80 ± 3.65 µg/mL (p = 0.15) and 95% limits of agreements of −6.51 to 8.10 µg/mL. Three outliers from the FDA-approved immunoassay analyzer were detected at concentrations of 27.4, 38.6, and 68.8 µg/mL, compared to those from the HPLC: 16.7, 23.3, and 79.8 µg/mL, respectively (Fig. 2).
Results of Passing–Bablok regression, Lin concordance correlation coefficient (CCC), and Bland–Altman plot bias analysis to assess method agreement between each of the automated instruments (FDA-approved immunoanalyzer, and point-of-care [POC] method) and reference high-performance liquid chromatography (HPLC) method, for quantifying canine plasma phenobarbital concentrations.
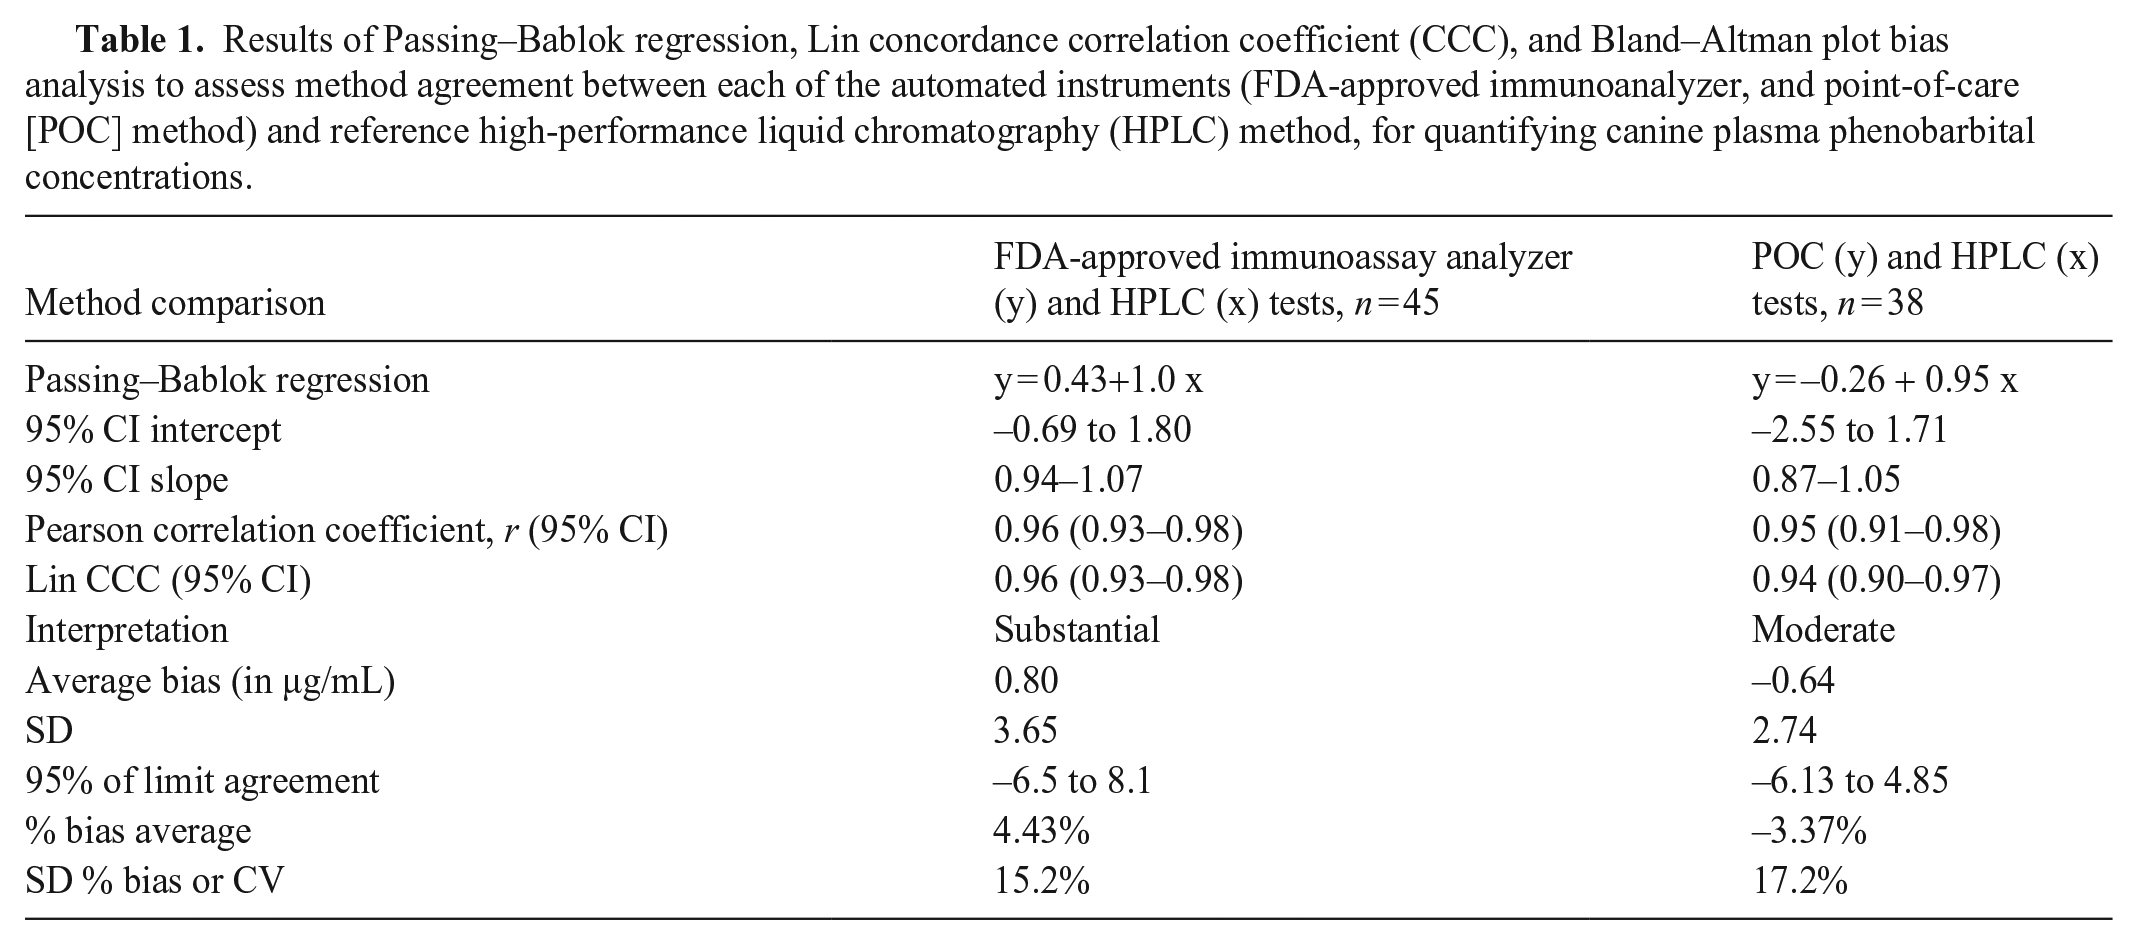
Comparison of 3 methods of quantification of phenobarbital in canine plasma: high-performance liquid chromatography (HPLC, reference method), a point-of-care (POC) immunoassay, and the FDA-approved immunoassay analyzer.
Comparison between HPLC and POC methods
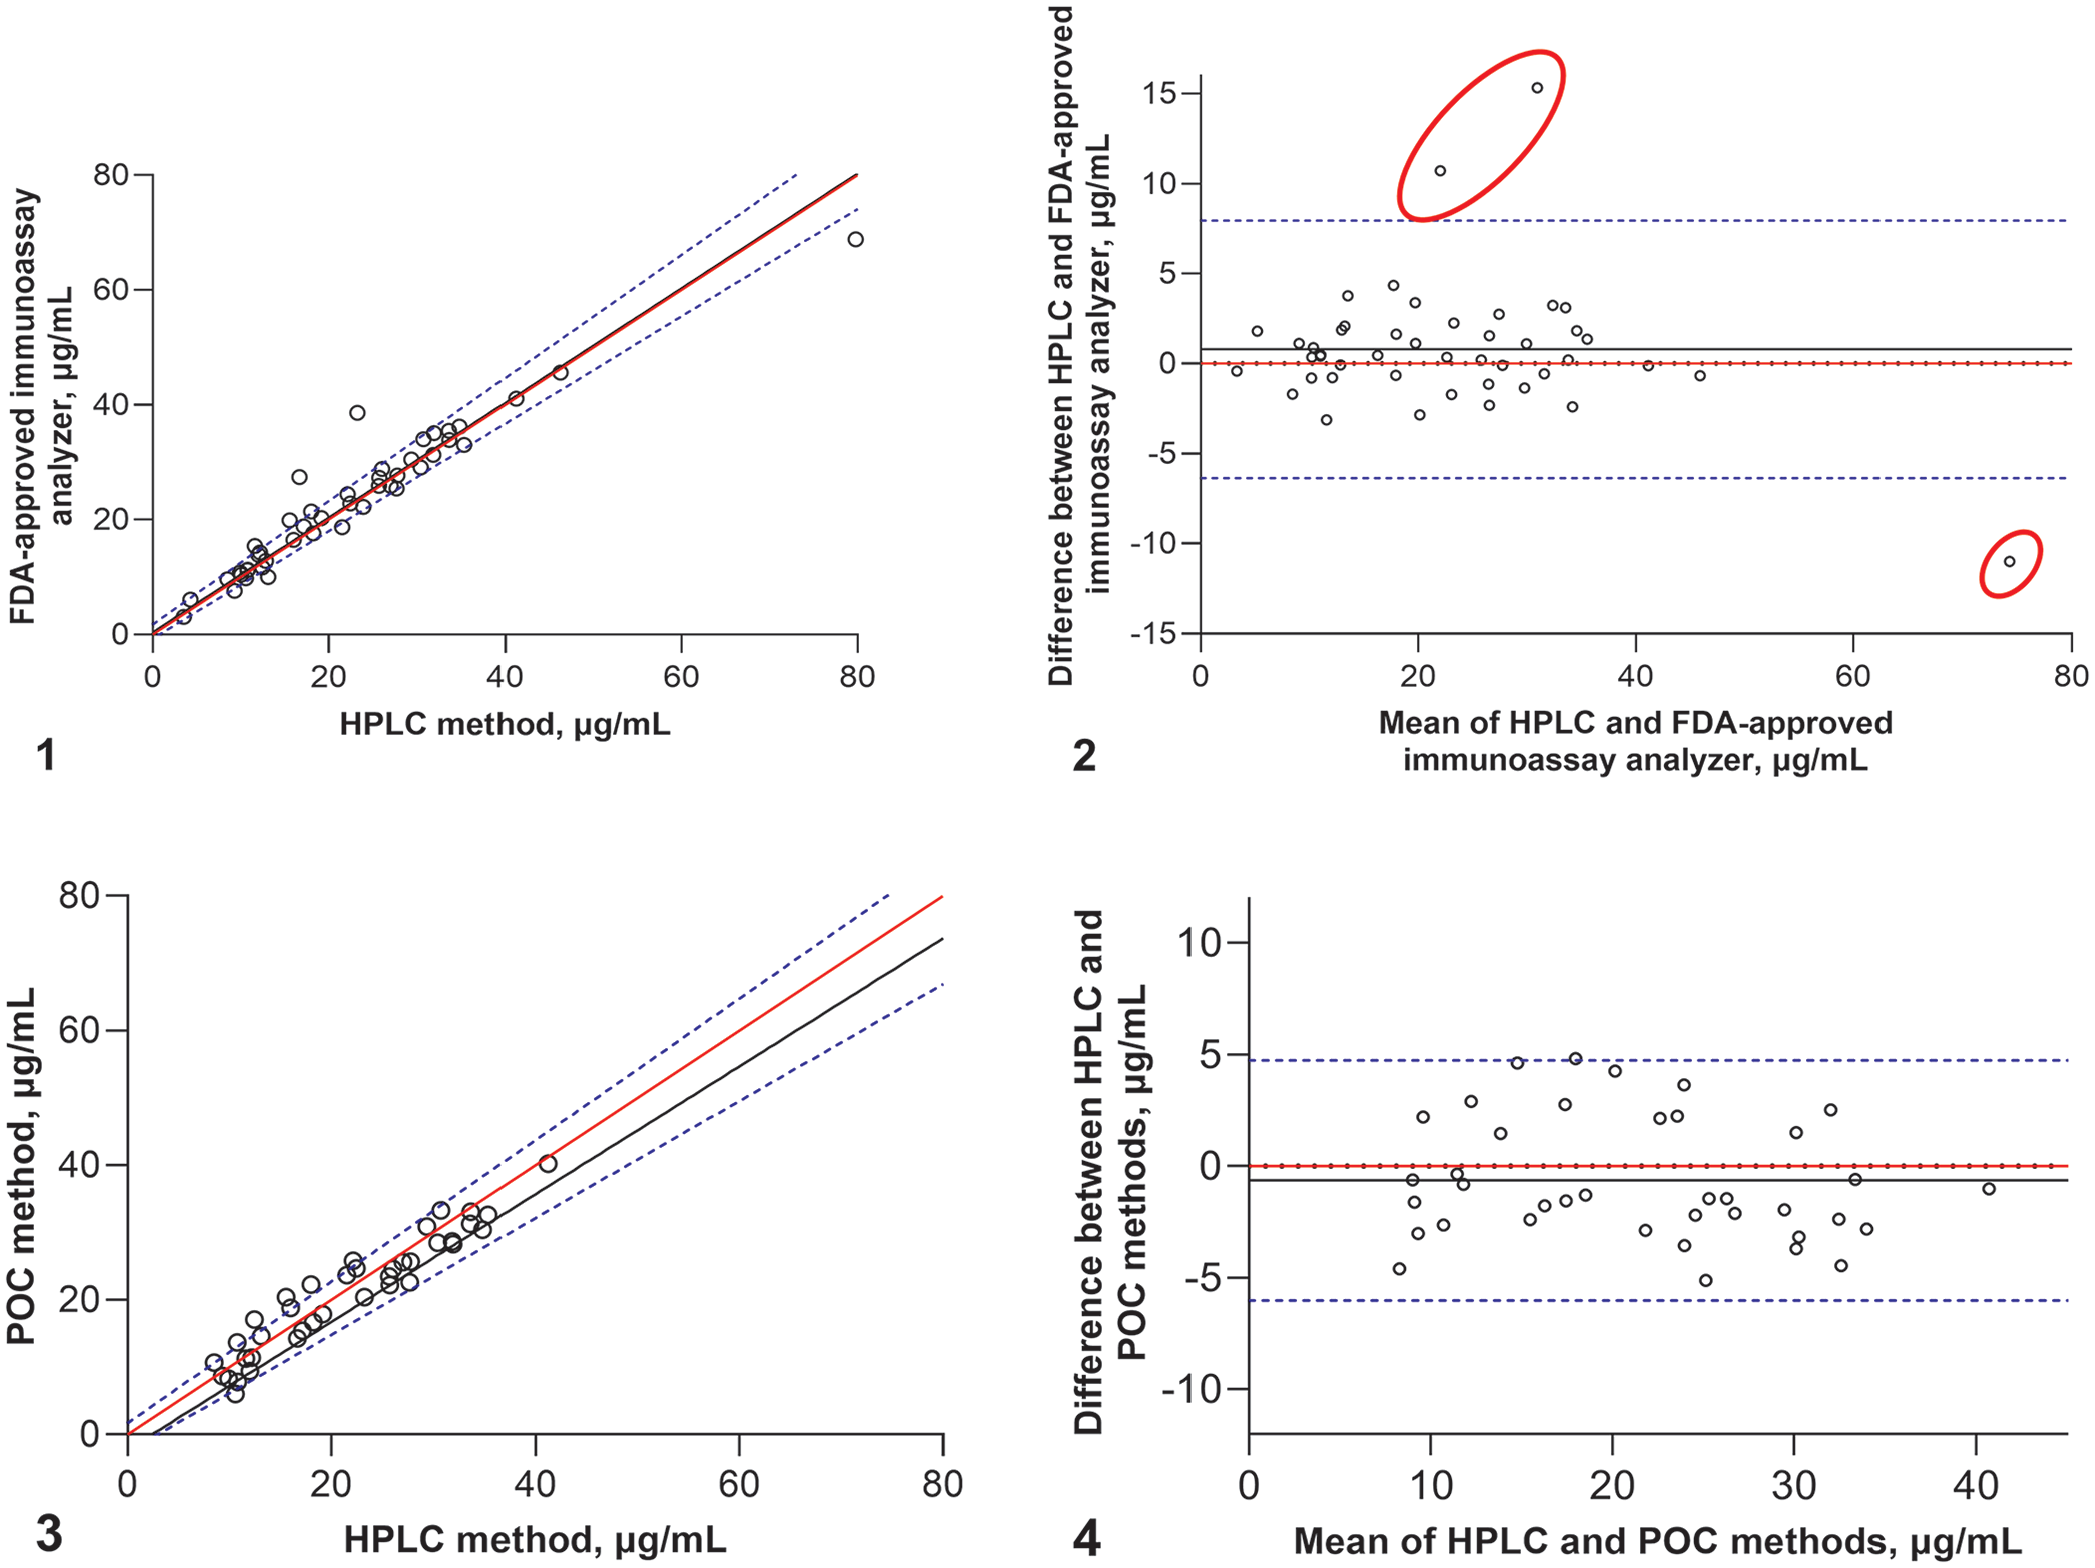
The POC test failed to report 7 samples: 4 samples had no result (unknown cause), and 3 samples were out of the testable range (2 samples were <5.0 µg/mL, and 1 sample was >55 µg/mL). Only 38 samples (84.4% of the total) for the POC test were further analyzed through statistical analysis. Passing–Bablok regression showed that the POC and HPLC tests were equivalent with a constant y-intercept of −0.26 (95% CI: –2.55 to 1.71, including zero) and a slope of 0.95 (95% CI: 0.87–1.05, included value 1; Table 1, Fig. 3). The phenobarbital concentrations from the POC test moderately agreed with the HPLC method, with a Lin CCC of 0.94 (95% CI: 0.90–0.97) and a Pearson correlation coefficient of r = 0.95. Bland–Altman analysis showed an insignificant negative bias between the HPLC and POC tests (p = 0.17) with a bias x̄ and SD of −0.64 ± 2.74 µg/mL and 95% limits of agreements of −6.13 to 4.85 µg/mL (Fig. 4). No outliers were identified for the POC method.
Discussion
Using real-life clinical samples and comparing 2 methods for quantifying plasma phenobarbital concentrations with the HPLC method, we found that the Lin CCCs from both methods were comparable; therefore, both tested immunoassay methods were equivalent to the HPLC test. Although the POC method was a good tool for monitoring plasma phenobarbital concentrations on-site, it has some potential limitations in replacing the FDA-approved immunoassay analyzer. The bias and limits of agreement from the POC test were smaller than those from the FDA-approved immunoassay analyzer. This slight bias may result from a narrow range of quantifying drug concentrations. The testable concentration range for POC is only 5–55 µg/mL, whereas the FDA-approved immunoassay is 1–80 µg/mL. Although the HPLC calibration curve was constructed to a maximum concentration of 50 µg/mL, the HPLC method allowed the dilution of the sample to extend the measurable range. The POC protocol limits the dilution option for the samples with concentrations >55 µg/mL. 26 Despite the range limitations of POC testing, the difference between testing modalities was minimal, and it is not clinically relevant. However, the laboratory methods (FDA-approved immunoassay analyzer or HPLC) may be suitable for monitoring patients with unusual dose-concentration responses. A study in dogs demonstrated a non-linear relationship between phenobarbital doses and concentrations that might occur at high doses. 1 Additionally, physiologic or pathologic factors may complicate phenobarbital disposition and plasma concentration. Therefore, the results from the laboratory methods provide more accurate phenobarbital concentrations, specifically in the range beyond the POC test.
Degrees of hemolysis, icterus, and lipemia may impact most clinical laboratory results.23,24 Lipemia causes sample turbidity and affects some analytical procedures, including immunoassays and HPLC methods.31,40 However, the HPLC method requires sample preparation to minimize interferences, such as proteins, lipoproteins, and lipids, although lipid interference is minimal with HPLC. 28 However, some authors do describe issues related to the lipemic samples for analyzing some compounds, resulting in false results.14,21,40 We found no lipid interference in our results because all samples were below the pre-analytical threshold of the lipemia indices. When using the POC test on-site, a pre-analytical interference screening function is unavailable, so users must be aware of inaccuracies in phenobarbital results from lipemic serum. Although some studies have investigated the effect of lipemia on routine biochemical tests or drug quantification,14,21,40 none of them have described the importance of the degree of lipemia and the difference in results from actual concentrations. Further investigation is needed to evaluate the extent of variation in the results from lipemic samples for both the immunoassay and HPLC methods.26,38
Three outliers occurred with the FDA-approved immunoassay method, with 2 results in the mid-range and 1 in the high-range concentrations. The phenobarbital concentrations of the 2 outliers in the mid-range were higher than those from the HPLC and POC methods. Both automated methods are immunoassays based on antigen–antibody (Ag-Ab) complexes. The detecting signal quantifies the complexes, and the resultant data are sent to the instrument reader to interpret drug concentrations directly or indirectly. Phenobarbital concentrations from the POC test are directly determined from the Ag-(labeled)Ab complexes. In contrast, the drug concentrations from the FDA-approved method are based on the levels of light that pass through the turbid sample resulting from Ag-Ab complexes. Anything that causes a change in sample turbidity may affect the signal received by the detector, leading to inaccurate concentration results. Several components in plasma (e.g., bilirubin, hemoglobin, protein, lipids) may interfere with the turbidity assay signal. We found that our samples did not have pre-analytical warnings of endogenous interference from hemolysis, icterus, or lipemia. Therefore, our speculation is that these 2 overestimated outliers may be from the paraproteins that may increase sample turbidity, leading to artificially high concentration readings. Several studies support that assay interference by paraproteins is through increased sample turbidity (e.g., falsely elevated levels of phosphate, 36 gamma-glutamyltransferase, 4 bilirubin, 39 and C-reactive protein). 7 The high-range phenobarbital concentration outlier, which is lower than the HPLC result, might have been caused by the precipitin reaction. Theoretically, the reaction occurs when the amount of Ag exceeds the available binding Ab sites. 15 The Ag-Ab complex reaction reaches the point of maximum turbidity, and the complexes then precipitate, leaving a less-cloudy sample and reading a concentration falsely lower than the actual. However, these hypotheses need further investigation.
The manufacturer’s technician performed the instrument maintenance, QC, and calibration before performing the POC test for our study specifically. Maintenance and QC for an instrument are fundamental to producing reliable results for every method. 12 Moreover, proper personnel training and continued competency assessment are essential to maintain measurement quality. 38 Veterinary practices must implement routine POC test device validation, maintenance, and QC.
Some limitations of our study included a lack of intra- or inter-day repeatability tests due to the inadequate volume of plasma samples available to repeat the test. The POC method requires a large volume of plasma samples to test and cannot be run in duplicate. Moreover, the variation in sample storage duration may have contributed to differences observed over time. Ideally, all samples would have been stored for the same duration and measured by the 3 methods simultaneously. We performed all 3 tests simultaneously to minimize variation in the sample storage times. There was no pattern between sample storage periods and the difference between the assays, with the most significant differences observed in the sample set assayed with an intermediate (30 d), not the longest (90 d) storage time. Therefore, it appears that long-term storage of plasma samples did not affect our results.
Footnotes
Declaration of conflicting interests
Dr. Thungrat oversees the Clinical Pharmacology Laboratory at the Auburn University College of Veterinary Medicine, which provided therapeutic drug monitoring as a commercial service to veterinarians at the time of the study.
Funding
The authors received no financial support for the research, authorship, and/or publication of this article.