
Abstract
In 2018, a new virus, named equine parvovirus-hepatitis (EqPV-H), was discovered in a biologic product that had been administered to horses that subsequently developed clinical signs of equine serum hepatitis (Theiler disease). Further correlation of the virus with the disease sparked federal requirements that all equine biologics be free of EqPV-H. The initial quantitative real-time PCR (qPCR) test for EqPV-H has proved to be sensitive to co-extracted PCR inhibitors in template nucleic acids, causing false-negative results. We investigated the use of digital PCR (dPCR) as a more robust test. Examination of 227 equine biologic product lots available for purchase both before and after regulatory implementation using both detection methods indicated that dPCR is a more reliable platform. Nevertheless, use of the qPCR method for product screening had reduced the fraction of serials with EqPV-H detected from 39.6% prior to regulation to 6.8% after regulatory implementation. Adoption of dPCR testing is an opportunity to further decrease the prevalence of EqPV-H in equine biologics.
Equine serum hepatitis (Theiler disease, TD) is a serum-associated hepatitis identified by Sir Arnold Theiler in the early twentieth century. TD affects ~2% of horses that are treated with equine-sourced antiserum, causing acute hepatic necrosis. 25 In 2018, a new virus was identified in a vial of tetanus antitoxin that had been administered to a horse shortly before the animal exhibited signs of TD and eventually succumbed. 5 The virus, equine parvovirus-hepatitis (EqPV-H; Parvoviridae, Copiparvovirus ungulate6), was the only extraneous agent identified in the biologic product by next-generation sequencing. EqPV-H was also found in the liver and serum of the deceased horse. In response, the USDA-APHIS-Center for Veterinary Biologics (CVB) published CVB Notice 19-03 stating that as of October 5, 2020, licensees or permittees of antibody, antitoxin, serum, and plasma veterinary biologic products sourced from horses for preventive or therapeutic administration to horses are required to test their donor animals yearly, and test all product lots (serials) before sale to ensure absence of the virus. 21 The regulation of veterinary biologics is described in Title 9, Code of Federal Regulations, of which part 113.450(c)(2) states: “An animal that tests positive for an infectious disease shall not be used in the manufacture of antibody products.” Because EqPV-H is, to date, not culturable, molecular detection is required. A quantitative real-time PCR (qPCR) 29 provided a method for the testing of equine serum, and the Cornell University–Animal Health Diagnostic Center (AHDC; Ithaca, NY, USA) offers fee-for-service testing. The CVB laboratory validated a qPCR assay for biologic product confirmatory testing based on the published methodology. 29 A few equine biologics firms opted to develop similar real-time methodologies in-house to defray costs incurred by the required testing. An extension to regulatory implementation was granted to 2021 April 30 by CVB Notice 20-08 due to supply-chain issues with PCR testing reagents. 22
At the CVB laboratory, EqPV-H DNA in equine blood–sourced products was often observed at or below the qPCR limit of quantification (LOQ); one such product was linked to clinical disease (personal communication with the attending veterinarian). Our examination indicated that EqPV-H was present in the product, but autopsy samples were not available for testing. In addition, evidence suggested that amplification inhibitors co-isolated with viral nucleic acid were impeding test accuracy. Blood and blood components, such as antibodies and hemoglobin, are known to inhibit PCR amplification. 24 Our objective was to transition the CVB Laboratory qPCR test to a more robust digital PCR (dPCR) method. To that end, we examined 227 biologics. Also, the inclusion of commercial products available before and after the April 30, 2021 implementation of testing requirements allowed analysis of the impact of regulation on the purity of commercial biologics.
Materials and methods
Samples
We obtained 227 serials of equine serum products including equine IgG, tetanus toxoid, rattlesnake antivenin, anti–Rhodococcus equi antibody, anti–Escherichia coli antibody, anti–West Nile virus antibody, and normal equine sera from the CVB sample repository and stored frozen at −20°C.
We screened 3 libraries of serum products by qPCR and/or dPCR. Library A was composed of 70 products released for sale before January 2021. These samples were tested by qPCR and 3 dPCR methods. The 69 samples of library B, also products commercially available before April 2021 were tested by qPCR and dPCR (QIAcuity; Qiagen). Library C contained 88 samples only available for sale after the April 30, 2021 implementation of the CVB testing requirement. The purpose of library C was to evaluate the impact of CVB regulation; therefore, samples were tested only by dPCR. Samples for analysis were not chosen according to rigorous statistical sampling procedures, but rather as samples became available, and anonymized to previous results. The major product types were represented in both libraries A+B and library C, with 2 exceptions that reflect systematic differences in sample submission patterns between the 2 time periods. We tested <3% of samples submitted before January 2021 and <5% of post–April 2021 samples.
Nucleic acid extraction
Nucleic acid was isolated from 200 μL of each product (Maxwell RSC total viral nucleic acid kit, Maxwell RSC robot; Promega). Samples were mixed with 200 μL of lysis buffer and 20 μL of proteinase K, then incubated at 22°C for 10 min followed by 56°C for 10 min before dispensing the full volume into the RSC cartridge. Nucleic acid was eluted with 60 μL of nuclease-free water and tested by qPCR and dPCR without dilution.
qPCR
DNA extracted as above was subjected to qPCR (Platinum qPCR Supermix-UDG; Invitrogen). Twenty microliter reactions were performed in a real-time PCR thermocycler (CFX96; Bio-Rad). Each reaction contained 10 μL of 2× Supermix, 0.8 µL each from 10-µM stock solution HPLC-purified primer and FAM-labeled probe, and 5 μL of template, either diluted control plasmid or extracted DNA. Triplicate reactions were denatured at 95°C for 10 min, then cycled 45 times at 95°C for 30 s and 1 min at 60°C. Primers (EqPV-3218F: ATGCAGATGCTTTCCGACC; EqPV-3386R: GCCCCAGAAACATATGGAAA), probe (EqPV-3310: 56-FAM/ACCGTAGCG/ZEN/GATTCGGGATCTGC/31ABkFQ), and reaction conditions were published previously.1,14–16,18,20,27–31,33 A plasmid containing the qPCR target sequence was generated by CVB as a positive control (>99% identical to GenBank OK032478, nucleotides 847–3,652). Plasmid 10-fold serial dilutions performed with 1 ng/μL of salmon sperm diluent (SSD) were run in triplicate to generate standard curves for each 96-well plate. SSD was used as a non-EDTA stabilizing agent. Data were analyzed using the CFX Maestro software (v.1.1; Bio-Rad). The method had been optimized and validated for biologic product confirmatory testing, but we considered any qPCR result generating a Cq value accompanied by an inflection point in the fluorescence curve in 2 of 3 reaction triplicates as EqPV-H “detected”, regardless of the LOQ determined by the standard curve.
dPCR
Digital PCR was performed using 3 different platforms: QX200 (Bio-Rad), Absolute Q (Thermo Fisher), and QIAcuity.
QX200 reactions contained 1× ddPCR Supermix (Bio-Rad), 0.9 µL from 10-µM stock solution of each primer and the FAM-labeled probe described above, and 5.4 μL of template DNA. 29 Single 22-μL reactions were partitioned into ~16,000 droplets/sample using a droplet generator (QX200; Bio-Rad) and thermocycled 45 times. Droplet fluorescence was read (QX200 droplet reader; Bio-Rad), and data were processed with QuantaSoft Analysis Pro software (v.1.7; Bio-Rad).
Each Absolute Q reaction (~20,400 partitions) contained 1× Absolute Q master mix, 0.8 µL from 10-µM stock solution of each primer and probe, and 2 μL of template DNA. Ten microliter reactions were dispensed into plates (QuantStudio MAP16; ThermoFisher) and thermocycled as noted above for qPCR. Analyses were performed using QuantStudio Absolute Q digital PCR software.
QIAcuity 40-μL reaction mixes contained 1× QIAcuity probe PCR master mix, 2.6 µL from 10-µM stock solution of each primer EqPV-3218F and EqPV-3386R, 1.3 µL from 10-µM stock solution of FAM-labeled probe EqPV-3310, and 10 μL of template. The full 40-μL mixtures were loaded onto 24-well plates (26K Nanoplates; Qiagen) for an average active volume of 24.3 μL. Cycling parameters were as above for qPCR. Data were processed using the QIAcuity software suite v.2.1.7.
Per the manufacturers, the dynamic range for all 3 systems is 5 orders of magnitude. Samples that fall above the dynamic range are easily detected and diluted for accurate quantification, but this range was more than sufficient for detecting the EqPV-H load in biologics serials.
EqPV-H qPCR validation
We worked closely with AHDC staff to harmonize our qPCR methods, but some factors were necessarily divergent. Some validation statistics for the published method 29 were published in 2020. 1 We validated the original qPCR method 29 for use in our laboratory using 10-fold serial dilutions of a positive control plasmid containing the target sequence.32,34 The theoretical LOQ was determined by 5 separate technicians to be 50 copies per reaction, which is equivalent to ~3,000 copies/mL of serum when R2 is >0.98 and PCR efficiency is >90% (Suppl. Fig. 1). The CV at the LOQ was 0.3. Standard curves with linear range 5 × 10⁵–5 × 10⁻¹ and no-template controls were included for every reaction. All controls and samples were run in triplicate.
We identified qPCR amplification inhibition from serum samples by spiking serially diluted control plasmid into either a 1-ng/μL SSD matrix or serum before DNA extraction. Dilution curves calculated from the Cq values of each sample type were compared to the standard curve generated from plasmid spiked into SSD without DNA extraction.
EqPV-H dPCR validation
QIAcuity dPCR validation included analysis of the qPCR positive control plasmid in a dilution series (Suppl. Fig. 2). Positive and negative control serum samples were established, stored in 50-μL aliquots at −20°C, and included on each plate. The controls were identified as positive or negative by qPCR, all 3 dPCR methods, and a luminescent immunoprecipitation system as described previously (LIPS; data not shown). 5 Optimization of template volume was determined using gradients of the positive control sample and the plasmid control, and primer/probe concentrations were optimized using dilution series. Precision of the method was calculated from 21 replications of a low-positive sample. The number of reactions necessary per sample was determined by the frequency of amplification in 26 replications of the negative control serum. 9 Digital PCR fluorescence values from individual partitions form Gaussian distributions around a low value (no target amplification) and a high value (target amplification “detected”) with some low percentage of indeterminate values termed “rain.” The distance between the “undetected” and “detected” fluorescence peaks divided by the sum of peak widths was used to calculate the assay resolution (RS). 11
Results
dPCR platform comparison
The LOQ for absolute quantification by a digital amplification method is dependent on the number of valid partitions, total reaction volume, template volume, and dead volume; a hypothetical Bio-Rad QX200 reaction with 2 positive partitions and an average of 16,000 total partitions equates to ~3 EqPV-H copies per reaction, equivalent to ~167 copies/mL of serum. Two positive partitions detected by the Absolute Q with ~20,500 partitions per reaction is equivalent to ~2 copies per reaction, or 300 copies/mL of serum. For the QIAcuity with ~25,000 valid partitions per reaction but a greater ratio of template to master mix, a hypothetical observation of 2 positive partitions equates to ~4 copies per reaction, or 120 copies/mL of serum.
We tested the 70 samples of library A by all 3 dPCR methods. Samples with any positive partitions as calculated by the software were considered “detected.”9,11 The specific software calculations are proprietary, but in general the threshold between “detected” and “undetected” categories is calculated using the distribution of fluorescence readings from all partitions of a single reaction. 10 Twenty-four samples from this set were rated “detected” by all 3 dPCR methods, another 2 were “detected” by 2 of the 3 methods. The 2 discrepancies were not attributable to a single dPCR method, but the QIAcuity detected both. As results of the 3 methods were roughly equivalent, the QIAcuity was adopted by the CVB laboratory based on ease of use, footprint, and price.
EqPV-H QIAcuity dPCR validation
Digital PCR requirements were generated for the QIAcuity platform as described above, including the ideal primer concentration and use of 40 cycles of amplification. Because products from different firms are compounded differently and the resulting PCR inhibitors vary, the software was allowed to set relative fluorescence unit (RFU) cutoffs for each sample individually rather than setting a common cutoff. Template volume was 10 μL when using the 26K plate reaction format (26,000 partitions). Dilution series of the positive control plasmid in the absence of PCR inhibitors detected all reactions containing 13 plasmids and >80% of reactions containing 2.5 plasmids (equivalent to 390 and 75 copies/mL of sample, respectively; Suppl. Fig. 2).
We validated the QIAcuity dPCR assay using a sample diluted to 5.9 × 10⁴ copies per reaction. 11 This sample was not a member of any library. The λ value was 1, indicating that 66% of the partitions had template. After 40 cycles, 2.5 average peak widths (RS) separated the “detected” and “undetected” RFU peaks with 1.8% rain. The recommendation is RS ≥2.5 and rain ≤2.5%. 12
Precision of the method was determined using 21 replicates of the positive control sample, which gave an average of 4 positive partitions per reaction with SD of 2. The positive control is deliberately chosen to be a “low-positive” to ensure consistent sensitivity across tests. Test-to-test variation is characterized by a x̄ of 2,900 copies/mL of serum, with a SD of 1,400 copies/mL of serum. The resulting CV of 49% is an artifact of this sample being a low-positive, but, compared with results in Figure 1, this degree of precision may be adequate for most positives, especially if detection rather than quantification is the priority.
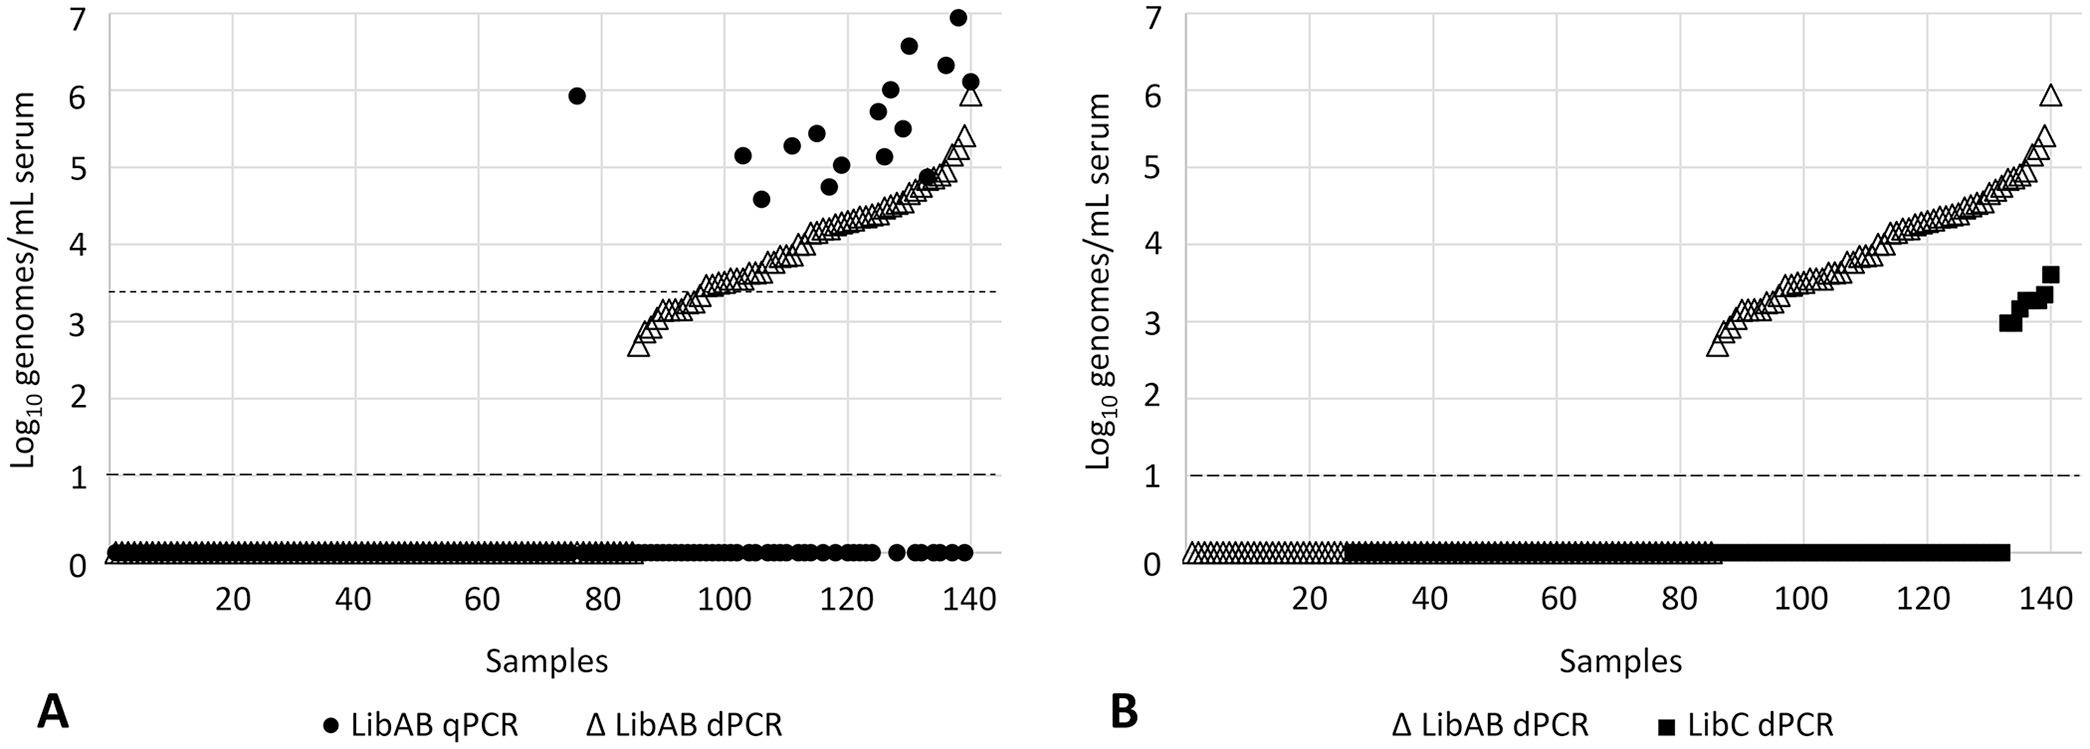
Distribution of equine parvovirus-hepatitis load across products.
Twenty-six replications of the negative control yielded a single run with a single “detected” partition. Because of this result, the conservative choice was made that detection of ≥2 partitions was required for a sample to be considered “detected.” In 54% of cases, a double repeat of any sample that initially had a single positive partition confirmed that it should actually be rated “undetected.”
An example of amplification inhibition was detected in the dPCR data of 1 sample as a drop in the average positive partition RFU from 71.2 to 27.7, with an accompanying RS decrease from 4.6 to 1.8 peak widths between the positive and negative fractions (Fig. 2; Suppl. Fig. 3).
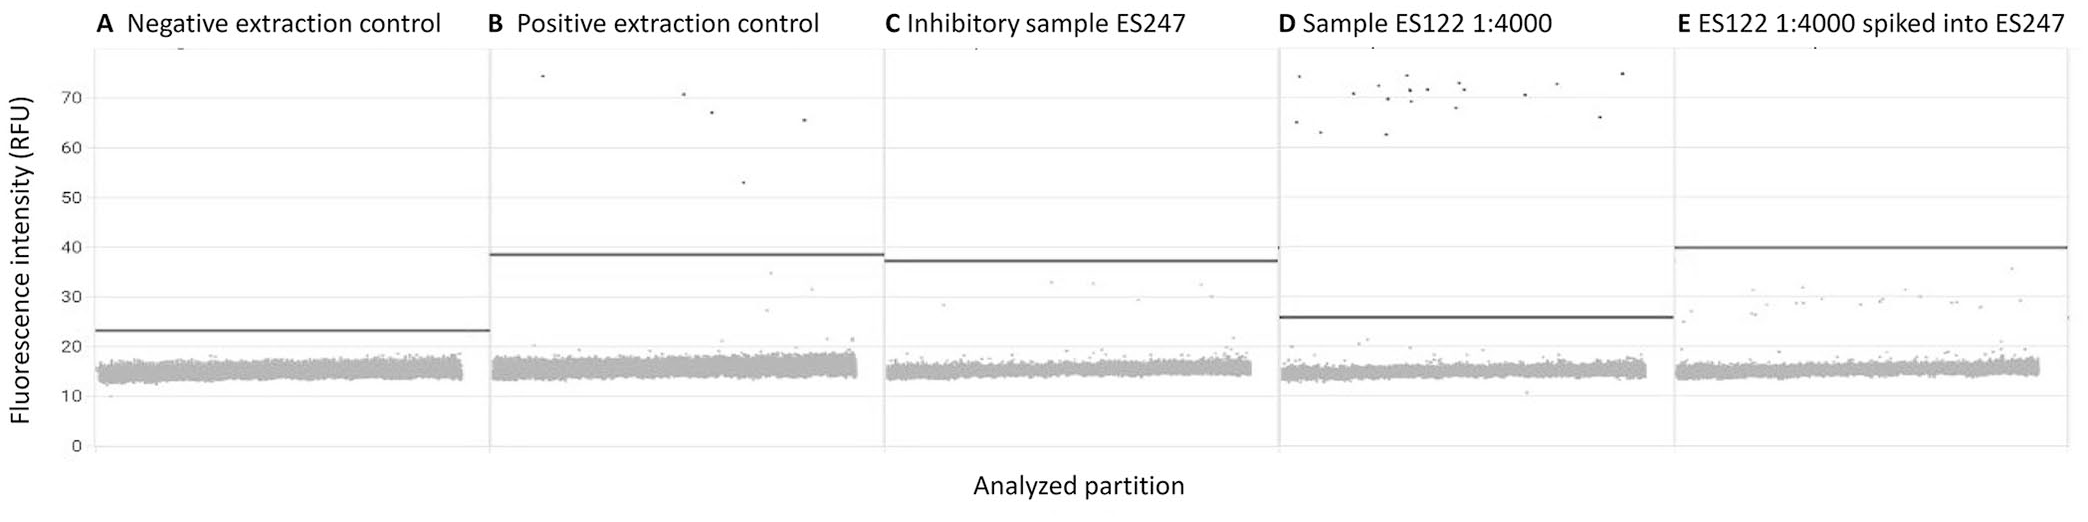
Results of a digital PCR inhibition test resulting in a false-negative result. DNA was extracted from
qPCR results
The qPCR inhibition test results showed an average Cq SD of 0.29 between the plasmid standard curve and the SSD spiked curve (Suppl. Fig. 4). In comparison, the average SD between the standard curve and the serum samples was 1.61. The parallelism of the curves indicates that the predominant inhibition mechanism in this sample was interference with the template DNA rather than obstruction of polymerase activity. 17
The qPCR using the CFX96 was performed on the combined libraries A and B (library A+B) for a total of 139 samples collected before implementation of the April 2021 testing requirement (Fig. 1A; Table 1). Of those samples, 15.1% tested “detected” by qPCR, consonant with published reports for animals worldwide. 19 A quarter of the “detected” samples carried 86% of the extant viral load, with a “detected” range from below the LOQ up to 8.79 × 10⁶ copies/mL (Fig. 1A). Most contaminated products contained very little viral nucleic acid.
Quantitative real-time PCR (qPCR) and digital PCR (dPCR) results from testing 227 equine serum products for equine parvovirus-hepatitis.
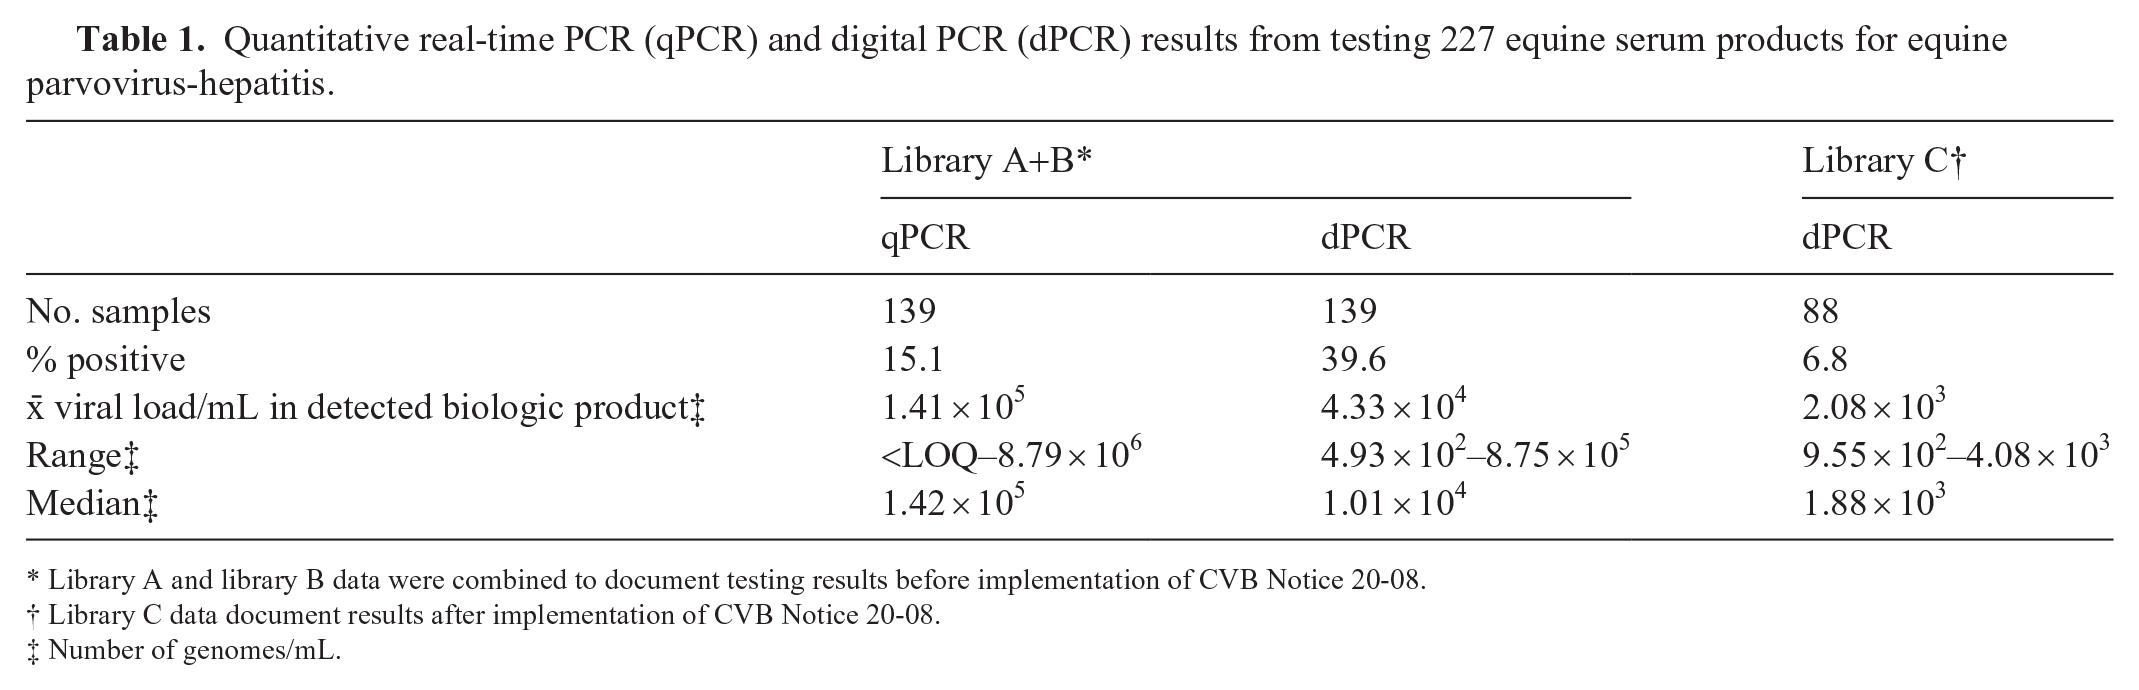
Library A and library B data were combined to document testing results before implementation of CVB Notice 20-08.
Library C data document results after implementation of CVB Notice 20-08.
Number of genomes/mL.
The lowest end of the “detected” range, nominally 3.33 × 10² copies/mL of product, is below the qPCR LOQ as calculated from the standard curve (50 copies/reaction) and thus cannot be interpreted as actual quantification of nucleic acid, only an indication of presence. Therefore, some samples considered “detected” in our study would be deemed satisfactory during normal confirmatory testing of biologic products.
dPCR results
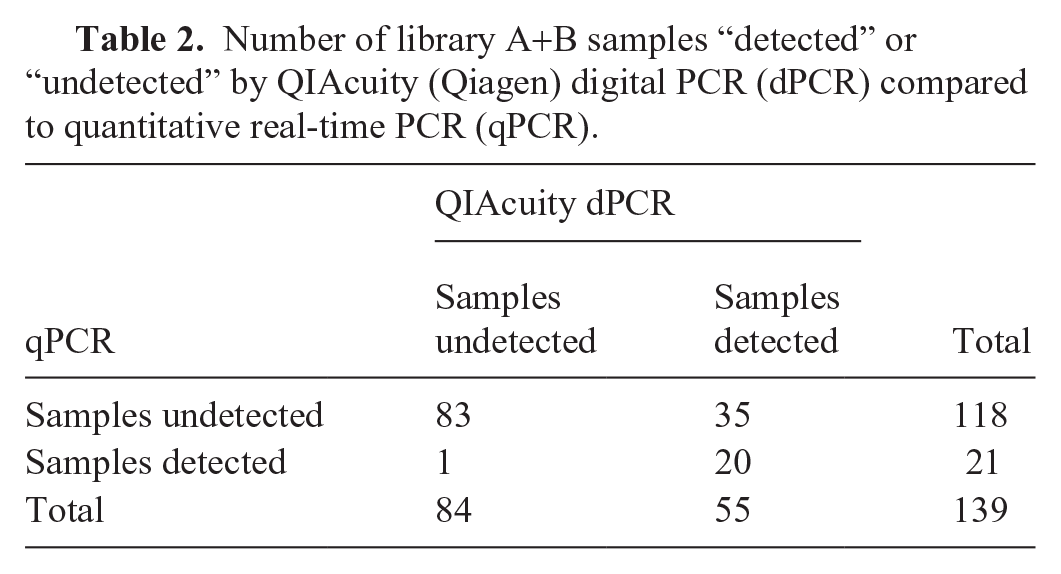
For library A+B, 39.6% of samples were “detected” by dPCR, more than double the number of samples by qPCR (Fig. 1A; Table 1). The average serial viral load identified by dPCR was 4.33 × 10⁴ copies/mL of serum, nearly 1 log lower than that calculated for qPCR and easily within the dynamic range of the QIAcuity (Suppl. Fig. 2). Viral distribution across the samples as detected by the 2 methods was similar; in both cases ~25% of “detected” samples carried ~85% of the extant viral load, hence most of the viral load was carried in a small subset of samples (Fig. 1A). Only one sample deemed “detected” by qPCR was called “undetected” by dPCR. Overall, the 2 PCR methods agreed only 74% of the time (Table 2). Although quantitation between qPCR and dPCR cannot be compared on an absolute basis, we can compare how the 2 methods would rank the samples: their Spearman rank-correlation is 0.52, and their Kendall tau correlation is 0.47. 2 The interpretation of these statistics is somewhat obscured by the fact that the vast majority of qPCR results are negative (Table 2) and represented as zero in the dataset.
Number of library A+B samples “detected” or “undetected” by QIAcuity (Qiagen) digital PCR (dPCR) compared to quantitative real-time PCR (qPCR).
To evaluate the outcome of CVB regulation, library C was tested by dPCR. Library C consisted of 88 convenience-sampled commercial products available after the April 30, 2021 implementation of testing requirements. Compared to the library A+B dPCR results reported above, library C had a positivity rate of only 6.8% with an average of 2.08 × 10³ genomes/mL of serum in the “detected” samples, ~1 log lower than library A+B (Fig. 1B; Table 1). Viral nucleic acid was also more evenly distributed across the “detected” samples, with the top third of “detected” samples supporting only 43% of the viral load in library C.
Discussion
Before our study, qPCR data collected by the CVB laboratory suggested suboptimal detection of low-level EqPV-H contamination in serum products due to amplification inhibition. Comparison of the dPCR and qPCR LOQ sensitivities using purified plasmid in the absence of inhibitors supports our claim of enhanced sensitivity for the dPCR methodology. Inhibitors are resisted in dPCR by collecting fluorescence signal from a single target in a 1-nL volume, effectively concentrating the fluorescence 20,000 times. 4 dPCR is increasingly used for detection purposes because it allows absolute quantification in the absence of an external calibrator, tolerance for suboptimal amplification efficiency, and quantification of rare sequence variants.6,8,12
The presence of amplification inhibitors in template DNA can disrupt qPCR target detection depending on substrate type. This is an intrinsic problem when using the standard curve method for quantification as it assumes that all samples to be tested have been collected and treated identically. 23 For our purpose, testing multiple product types from multiple sources, the generation of an appropriate control for each situation was untenable. PCR amplification inhibition is visible throughout our dataset, as 64% of products “detected” by dPCR failed to generate any fluorescent signal by qPCR, even below the LOQ. Amplification inhibition can affect the qPCR standard curve by either increasing or flattening the slope, leading to either falsely high or low Cq. 26 In our case, when a sample was “detected” by both methods, the calculated dPCR viral load was always less than that quantified by qPCR. This further illustrates that a quantitative comparison between dPCR and qPCR methods is not meaningful.
The importance of amplification inhibition regarding diagnostic accuracy is clear in the case of sample ES261, which was a final product administered to 3 horses that subsequently died due to TD as diagnosed by the treating veterinarian. The CVB laboratory observed EqPV-H amplification in only 3 of 100 qPCR replicates, all below the LOQ (data not shown). In a single dPCR reaction divided into 26,000 partitions, virus was quantified in the serum product at an average of 2,920 copies/mL of serum. Unfortunately, samples from the affected animals were not available for sequencing, so we were unable to directly correlate disease to the virus. These results highlight the ability of dPCR to identify potentially biologically significant, low-level contamination at or below the qPCR limit of detection.
Using dPCR, we compared samples from before and after the CVB implementation of testing. Firms are required to test all candidate animals entering the herd and perform annual testing of each donor animal. 22 In addition, testing all serials of a biologic product for administration to horses, generally consisting of pools of sera from multiple animals, is required prior to distribution, although pooling dilutes virus detection capability. 30 Evaluation by dPCR demonstrated that both the percentage of “detected” and the viral load samples of commercially available serials of biologics was reduced after April 30, 2021. As the samples were not chosen in a statistically randomized manner due to the nature of available samples, inferential statistical analyses such as Student t-test are inappropriate. Rather, a purely descriptive statistical assessment of the data, as presented here, is adequate for purpose. 13 The continued presence of low levels of virus identified in 6.8% of products post regulatory implementation likely results from multiple factors, such as re-infection or recrudescence of detectable virus in a low-level carrier.
qPCR is the currently accepted detection method, but our study indicates that dPCR is less susceptible to false-negatives than qPCR. Implementation of dPCR for testing should further decrease product contamination. Validation factors that still need to be addressed before using dPCR for EqPV-H testing include addition of an internal extraction control to identify random error, such as failed extractions or presence of amplification inhibitors. A stringent analysis of accuracy, uncertainty, and robustness is also needed before use of this method for clinical and serial testing. 3
Given that the regulation requires that products be free of contamination, potential sources of that contamination should be considered. Annual testing of animals indicates that some individuals test positive intermittently. Even with increased sensitivity of dPCR to detect viral nucleic acid, low-level carriers may have sporadic periods with extremely low concentrations of circulating virus, potentially including integration into the host genome. 7 Because long-term low-level carrier states may be common, it is considered good husbandry to permanently remove from biologics production any animals that test positive for EqPV-H nucleic acid. 20
Supplemental Material
sj-pdf-1-vdi-10.1177_10406387241292343 – Supplemental material for Detection of equine parvovirus-hepatitis and efficacy of governmental regulation for equine biologics purity
Supplemental material, sj-pdf-1-vdi-10.1177_10406387241292343 for Detection of equine parvovirus-hepatitis and efficacy of governmental regulation for equine biologics purity by Alexandra J. Scupham and Christopher Tong in Journal of Veterinary Diagnostic Investigation
Footnotes
Declaration of conflicting interests
The authors declared no potential conflicts of interest with respect to the research, authorship, and/or publication of this article.
Funding
This study was funded in part by the USDA Veterinary Services Vision and Science Grassroots Project.
Supplemental material
Supplemental material for this article is available online.
References
Supplementary Material
Please find the following supplemental material available below.
For Open Access articles published under a Creative Commons License, all supplemental material carries the same license as the article it is associated with.
For non-Open Access articles published, all supplemental material carries a non-exclusive license, and permission requests for re-use of supplemental material or any part of supplemental material shall be sent directly to the copyright owner as specified in the copyright notice associated with the article.