
Abstract
The COVID-19 pandemic presents a continued public health challenge. Veterinary diagnostic laboratories in the United States use RT-rtPCR for animal testing, and many laboratories are certified for testing human samples; hence, ensuring that laboratories have sensitive and specific SARS-CoV2 testing methods is a critical component of the pandemic response. In 2020, the FDA Veterinary Laboratory Investigation and Response Network (Vet-LIRN) led an interlaboratory comparison (ILC1) to help laboratories evaluate their existing RT-rtPCR methods for detecting SARS-CoV2. All participating laboratories were able to detect the viral RNA spiked in buffer and PrimeStore molecular transport medium (MTM). With ILC2, Vet-LIRN extended ILC1 by evaluating analytical sensitivity and specificity of the methods used by participating laboratories to detect 3 SARS-CoV2 variants (B.1; B.1.1.7 [Alpha]; B.1.351 [Beta]) at various copy levels. We analyzed 57 sets of results from 45 laboratories qualitatively and quantitatively according to the principles of ISO 16140-2:2016. More than 95% of analysts detected the SARS-CoV2 RNA in MTM at ≥500 copies for all 3 variants. In addition, for nucleocapsid markers N1 and N2, 81% and 92% of the analysts detected ≤20 copies in the assays, respectively. The analytical specificity of the evaluated methods was >99%. Participating laboratories were able to assess their current method performance, identify possible limitations, and recognize method strengths as part of a continuous learning environment to support the critical need for the reliable diagnosis of COVID-19 in potentially infected animals and humans.
Emergence of severe acute respiratory syndrome-related coronavirus (SARS-CoV) in 2003 13 and the Middle East respiratory syndrome-related coronavirus (MERS-CoV) in 2012 4 showed the zoonotic potential of animal coronaviruses. SARS-CoV2 transmission has been documented among animals, from humans to animals, and from animals to humans in the COVID-19 pandemic.2,9,13,14,20,21 SARS-CoV2 has been detected in wild and domestic animals around the world.8,15–18,23–25,28,30 A 2021 U.S. animal surveillance study indicated high prevalence of SARS-CoV2 among domestic and wild free-roaming animals tested on mink farms. 11 Conducting animal surveillance and routine testing with a sensitive and specific SARS-CoV2 detection method is important in outbreak response and prevention. A joint statement from the United Nations Food and Agriculture Organization, World Organisation for Animal Health (WOAH), and World Health Organization also noted the need to promote the monitoring of wildlife known to be potentially susceptible to SARS-CoV2 and reporting of confirmed animal cases of SARS-CoV2 to WOAH, with these actions requiring a sensitive and accurate SARS-CoV2 test.
In response to the spread of SARS-CoV2 in animals, veterinary diagnostic laboratories (VDLs) receive animal specimens for detection of SARS-CoV2. Many VDLs also have Clinical Laboratory Improvement Amendments (https://www.cdc.gov/clia/index.html) certification and test human samples, meaning that they play a critical One Health role in assessing the impact of COVID-19 on both humans and animals. Among the available tests, detection of the viral RNA with reverse-transcription real-time PCR (RT-rtPCR) is the most widely used, sensitive, and specific detection method for SARS-CoV2.
The U.S. FDA Veterinary Laboratory Investigation and Response Network (Vet-LIRN) is a network of VDLs that investigates potential animal food- or drug-related issues. 12 In August 2020, an Inter-Laboratory Comparison Exercise Round 1 (ILC1) was conducted collaboratively by the FDA and other organizations to qualitatively and quantitatively evaluate the SARS-CoV2 RT-rtPCR detection methods used by VDLs 5 ; ILC1 participants detected SARS-CoV2 RNA effectively in molecular transport medium (MTM) with the methods that they used routinely for testing clinical specimens. Two-thirds of the laboratories achieved nearly the theoretical optimum level of detection (LOD) of 3 copies. 5 However, the viral RNA spiking levels used in ILC1 were not low enough to evaluate the method analytical sensitivity, specifically the LOD for each individual participant. Hence, ILC2 was designed to provide more challenging samples from which marginal detection results could be generated for statistical analysis.
New lineages of SARS-CoV2 were reported and quickly became dominant variants in different parts of the world after late 2020 1 (https://covariants.org/), including the Alpha (B.1.1.7) and Beta (B.1.351) variants.7,26 Additional variants of concern such as the Delta (B.1.617) and Omicron (B.1.1.529) variants emerged subsequently. These emerging variants carry various mutations throughout the viral genome, including on the spike (S), envelope (E), nucleocapsid (N), and/or ORF1ab genes. Most participants used assays detecting the N gene in their routine testing, specifically markers N1 and N2, whereas some laboratories used other gene markers, such as ORF1ab, S, or E genes. In ILC2, the variants designated as Alpha (B.1.1.7) and Beta (B.1.351) were used in addition to U.S.B.1, which was the most prevalent lineage in the United States at the end of 2020 and the beginning of 2021. The ILC2 samples were shipped to laboratories in June 2021, and we studied the detection of these variants with the various markers used by participants.
ILC2 was conducted collaboratively by the following: 1) the FDA Center for Veterinary Medicine Vet-LIRN (Laurel, MD, USA); 2) the Moffett Proficiency Testing Laboratory (Bedford Park, IL, USA) located at the Institute for Food Safety and Health at the Illinois Institute of Technology (IIT/IFSH) and the FDA Division of Food Processing Science and Technology; 3) QuoData Quality and Statistics (Dresden, Germany); 4) Cornell University (Ithaca, NY, USA); 5) the U.S. Geological Survey (USGS) National Wildlife Center (Madison, WI, USA); 6) USDA National Veterinary Services Laboratories (NVSL), National Animal Health Laboratory Network (Ames, IA, USA); 7) the Integrated Consortium of Laboratory Networks (Washington, DC, USA); and 8) 45 participating laboratories. The study was a continuation of ILC1 with the following objectives: 1) to evaluate analytical sensitivity (i.e., LOD) of the methods used routinely by participating laboratories to detect SARS-CoV2 variant (B.1) RNA; 2) to evaluate the ability of the participants’ methods to detect SARS-CoV2 variants Alpha (B.1.1.7) and Beta (B.1.351); and 3) to evaluate the methods’ specificity by investigating cross-reactivity with the RNA of feline infectious peritonitis virus (FIPV; Alphacoronavirus 1), a non–SARS-CoV2 animal coronavirus. Our goal was to allow participating laboratories to assess their method performance, including strengths and limitations, to support the reliable diagnosis of COVID-19 in potentially infected animals and humans.
Materials and methods
Determination of SARS-CoV2 RNA concentration
Three synthetic SARS-CoV2 genomic RNA products were purchased from Twist Bioscience for the ILC2 study: B.1 (Twist Control 10), Alpha (B.1.1.7; Twist Control 15), and Beta (B.1.351; Twist Control 16). These single-stranded RNA controls are manufactured by in vitro transcription from 6 non-overlapping 5-kb synthetic gene fragments. According to the manufacturer, the synthetic RNAs cover 99.9% of the bases of the viral genomes that were predominant in the United States, including the U.S.B.1, United Kingdom (Alpha [B.1.1.7]), and South Africa (Beta [B.1.351]) variants, with GISAID names: USA/CA-PC101P/2020, England/205041766/2020, and South Africa/KRISP-EC-K005299/2020, respectively. Droplet digital RT-PCR (RT-ddPCR)-based quantification of these controls was performed by the Cornell University Genomics Facility (QX200 instrument; Bio-Rad). The CDC N1 primers and probe (IDT) were used for this analysis with the 1-step RT-ddPCR advanced kit for probes (Bio-Rad), on duplicate serial dilutions of the templates. The concentrations of the original Twist B.1, Alpha (B.1.1.7), and Beta (B.1.351) controls were determined by RT-ddPCR as 150,000, 345,000, and 300,000 copies/μL, respectively. Serial dilutions of the controls were then made in nucleic acid dilution solution from the VetMAX Xeno internal positive control DNA kit (Applied Biosystems) to levels of 2 × 10⁵ to 2 copies/μL in 10-fold dilutions.
FIPV RNA preparation
A cryopreserved suspension of the culture-adapted Black strain of FIPV was provided by Dr. Gary Whittaker at Cornell University. The culture was grown in Fcwf-4 CU cells as described previously. 19 RNA was extracted and purified (MagMAX viral/pathogen kit; Thermo Fisher). Quantification by RT-ddPCR was performed as described above but with the P009 and P010 primers and P9/P10 probe, 6 which targets the N gene of FIPV.
ILC2 sample stability and homogeneity studies
Acceptable homogeneity, stability, and targeted spike levels were verified in 3 studies. In study 1 at the Moffett Proficiency Testing Laboratory, samples were analyzed by 2 analysts in 2 trials on days 0, 7, 14, and 21 of storage at −80°C (Suppl. Table 1). Eighteen samples (S1–S18) for each set were prepared. S1–S16 were prepared by adding B.1 RNA to PrimeStore MTM (Longhorn Vaccines & Diagnostics) at levels of 0, 10, 20, 50, 100, or 1,000 copies/50 µL. S17 and S18 were prepared by adding Alpha (B.1.1.7) and Beta (B.1.351) to MTM at 1,000 copies/50 µL. The RNA in study 1 samples were isolated (Qiagen RNeasy mini kit; Qiagen) and subsequently analyzed (AgPath-ID one-step RT-PCR kit; Qiagen) using specific primers (i.e., N1 and N2 targeting 2 regions of the viral nucleocapsid gene) and probes for the virus N gene (IDT), according to the CDC 2019-nCoV EUA kit method. 3 RT-PCR was performed on the 7500 fast real-time PCR instrument (Applied Biosystems) with v.2.3 software.
In studies 2 and 3 at Moffett, 2 sets of randomly chosen ILC2 samples (see their preparation below) were analyzed using the procedure described above: the first set (study 2) was analyzed prior to the shipment day, and the second set (study 3) was analyzed 2 d after the shipment day, when the ILC2 participants started to test their samples.
Qualitative data (Suppl. Tables 1A, 1C, 1D) indicated that all samples with RNA concentration ≥50 copies/50 μL were detected; blank samples were not detected. The Ct values were subjected to quantitative analysis. There was no significant difference in the Ct values for the samples after 7, 14 and 21-d storage in study 1 (Suppl. Table 1B), indicating that the samples were stable for 21 d. The sample SD (ssample) and the replicate measurements SD (se) were 0–1.13 and 0.11–1.14, respectively, when they were calculated based on the Ct values. The homogeneity and stability results demonstrated that the trial samples were deemed sufficiently homogeneous and stable, and the inoculation process was suitable to produce the targeted ILC2 samples.
ILC2 sample preparation and pre-shipment tests
The RNA was inoculated into MTM in bulk, and 150-µL aliquots of each sample were transferred into 1.5-mL snap-top microfuge tubes, according to the sample composition in Table 1. All samples were stored at −80°C before shipping. To confirm successful inoculation before shipping, a set of ILC2 samples was tested as described in study 2 above. Another set of ILC2 samples was shipped to Cornell University to confirm the spiking levels by RT-ddPCR, using the procedures described above.
Description of ILC2 samples and associated SARS-CoV2 RNA concentrations.
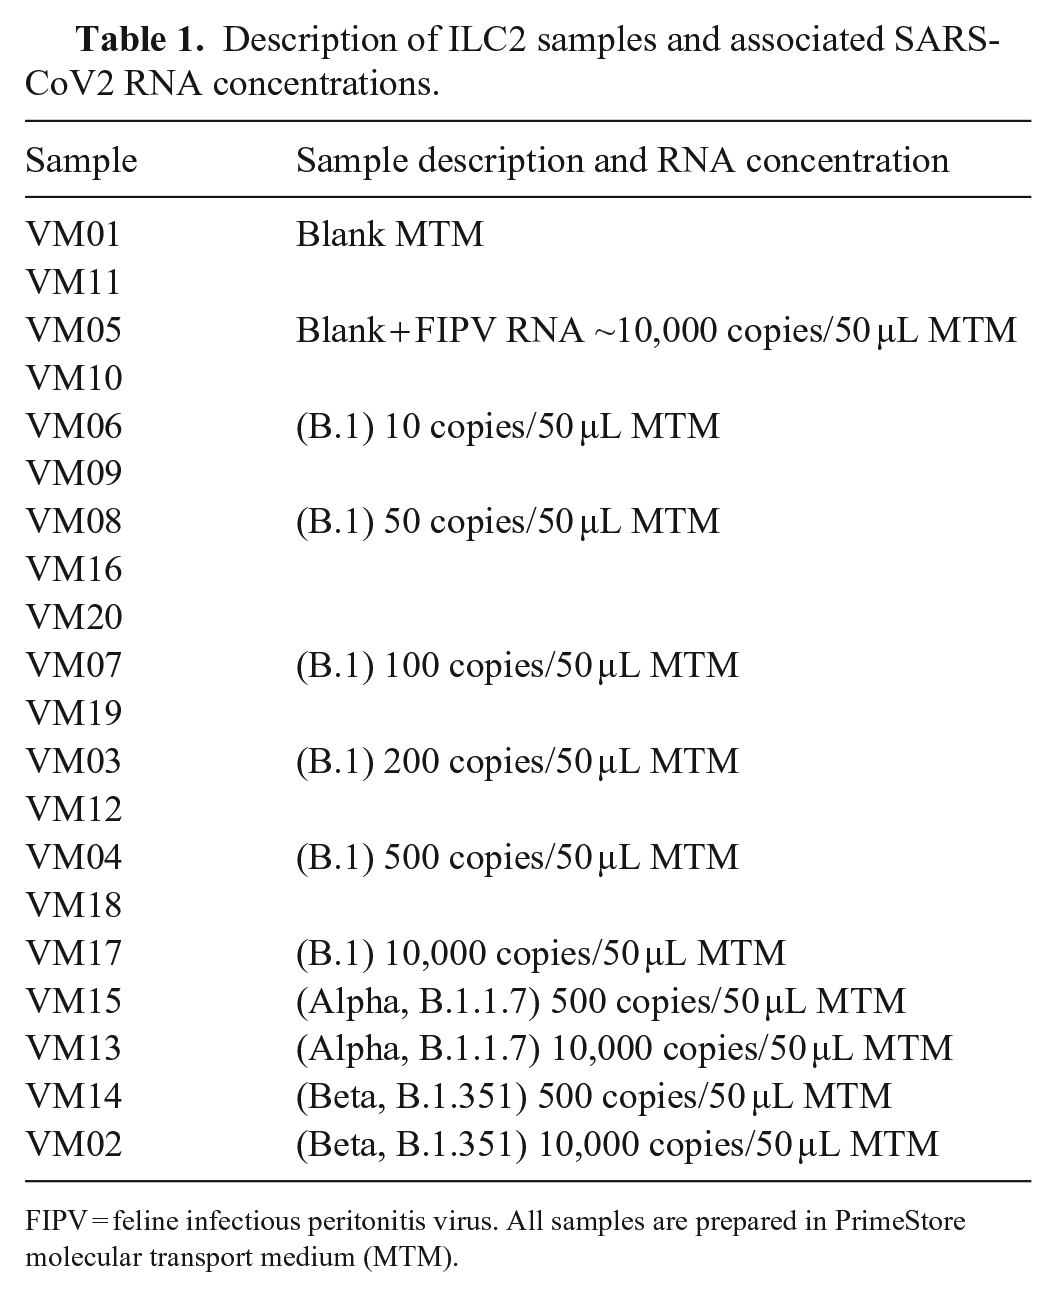
FIPV = feline infectious peritonitis virus. All samples are prepared in PrimeStore molecular transport medium (MTM).
For the pre-shipment temperature trial, the packaging configuration was tested by packaging mock samples in dry ice in a shipping box according to the International Air Transport Association Dangerous Goods Regulations (https://www.iata.org/en/publications/dgr/). After holding the box for 72 h at room temperature, the sample containers were observed and qualitatively assessed as frozen or not. The assessment showed that the packaging configuration kept the primary sample containers frozen for 72 h.
ILC2 sample distribution
The final shipment samples were packaged (STP-320 UN 3373 Category B frozen insulated shipping system; Saf-T-Pak) according to the manufacturer-provided instructions and shipped (Priority Overnight; FedEx). We shipped 59 sets of blind-coded samples on dry ice to the 45 participating laboratories (14 laboratories requested a second set of samples to test 2 methods or to test by 2 analysts). Participants were not aware of spike levels (i.e., analyte concentration) or number of replicates per spike level prepared by the organizers.
Sample analysis and data acquisition
Participants were instructed to use the SARS-CoV2 RNA extraction and detection methods that they used routinely in their laboratories. To facilitate statistical analysis, all analysts used the same input volume (50 μL) for RNA extraction and reported their volumes of eluted RNA and PCR template to the ILC organizer. Before testing began, sample handling and result reporting instructions were discussed with the participants via 2 training sessions. To ensure confidentiality, each analyst was assigned an analyst identification number (AIN). Each analyst reported the results as detected (D), not detected (N), or inconclusive (I) for SARS-CoV2 viral RNA, according to their own laboratory protocols. Participants were also instructed to report Ct values for each PCR marker used, cutoff values, basic method information (e.g., PCR instrument model, extraction kit, and internal controls, as well as extraction, elution, and PCR input volumes), and any modifications to their methods. Detailed methods from each participating laboratory were kept confidential to maintain anonymity. We therefore refer to each assay target as “marker”, consistent with the terminology used in the ILC1 publication. 20
Qualitative and quantitative assessments
Rate of detection (ROD), the number of positive results divided by the total number of results, was calculated for all markers used (i.e., overall detection) and for N1 and N2 markers separately. Inconclusive results were classified as “not detected” for our assessment.
Analytical sensitivity (LOD) was calculated based on a probability of detection (POD) model. The complementary log-log regression model10,27 (i.e., the statistical model that corresponds to the Poisson assumption) was modified to take into consideration the analyst-specific actual copy numbers per well for calculating the marker- and analyst-specific POD curves. The POD curve was calculated based on ROD values obtained from the original (i.e., not rounded) Ct values. From these POD curves, the LOD95 values (the numbers of copies at which a POD of 95% is achieved) were derived. LOD95 was based on the effective volume (i.e., the part of the original sample volume used in the RT-PCR), which was calculated based on 3 volumes (i.e., extraction, elution, PCR input volumes) reported by participants to organizers (hereafter referred to as LOD95eff vol). The adjustment was necessary for meaningful evaluation of method sensitivities for the individual laboratories.
The PCR amplification rate (i.e., efficiency) was calculated separately for each marker based on the nominal copy numbers (equivalent to dilution levels) and the submitted Ct values.
Results
Overall detection results
Fifty-seven datasets submitted from 45 laboratories were collected and analyzed. The analysts submitted qualitative “overall detection” results (Table 2), Ct values for various markers (Suppl. Tables 2–6), Ct cutoff values (Table 3), and basic method information. The analysts targeted different markers for SARS-CoV2 RNA testing. The overall detection results and Ct cutoff values reported are based on criteria selected by individual analysts according to their internal protocols. Comparative evaluation of qualitative overall detection results, reported Ct values, and the Ct cutoff values revealed that individual analysts used different decision-making criteria during interpretation of their datasets (Table 2). Specifically, some analysts reported detected (D), whereas other analysts reported not detected (N) or inconclusive (I) when some, but not all, targeted markers were detected (i.e., 1 of 2 targeted markers was detected, or 3 of 4 targeted markers were detected).
The results for overall detection of SARS-CoV2 submitted by all participants for ILC2 samples.
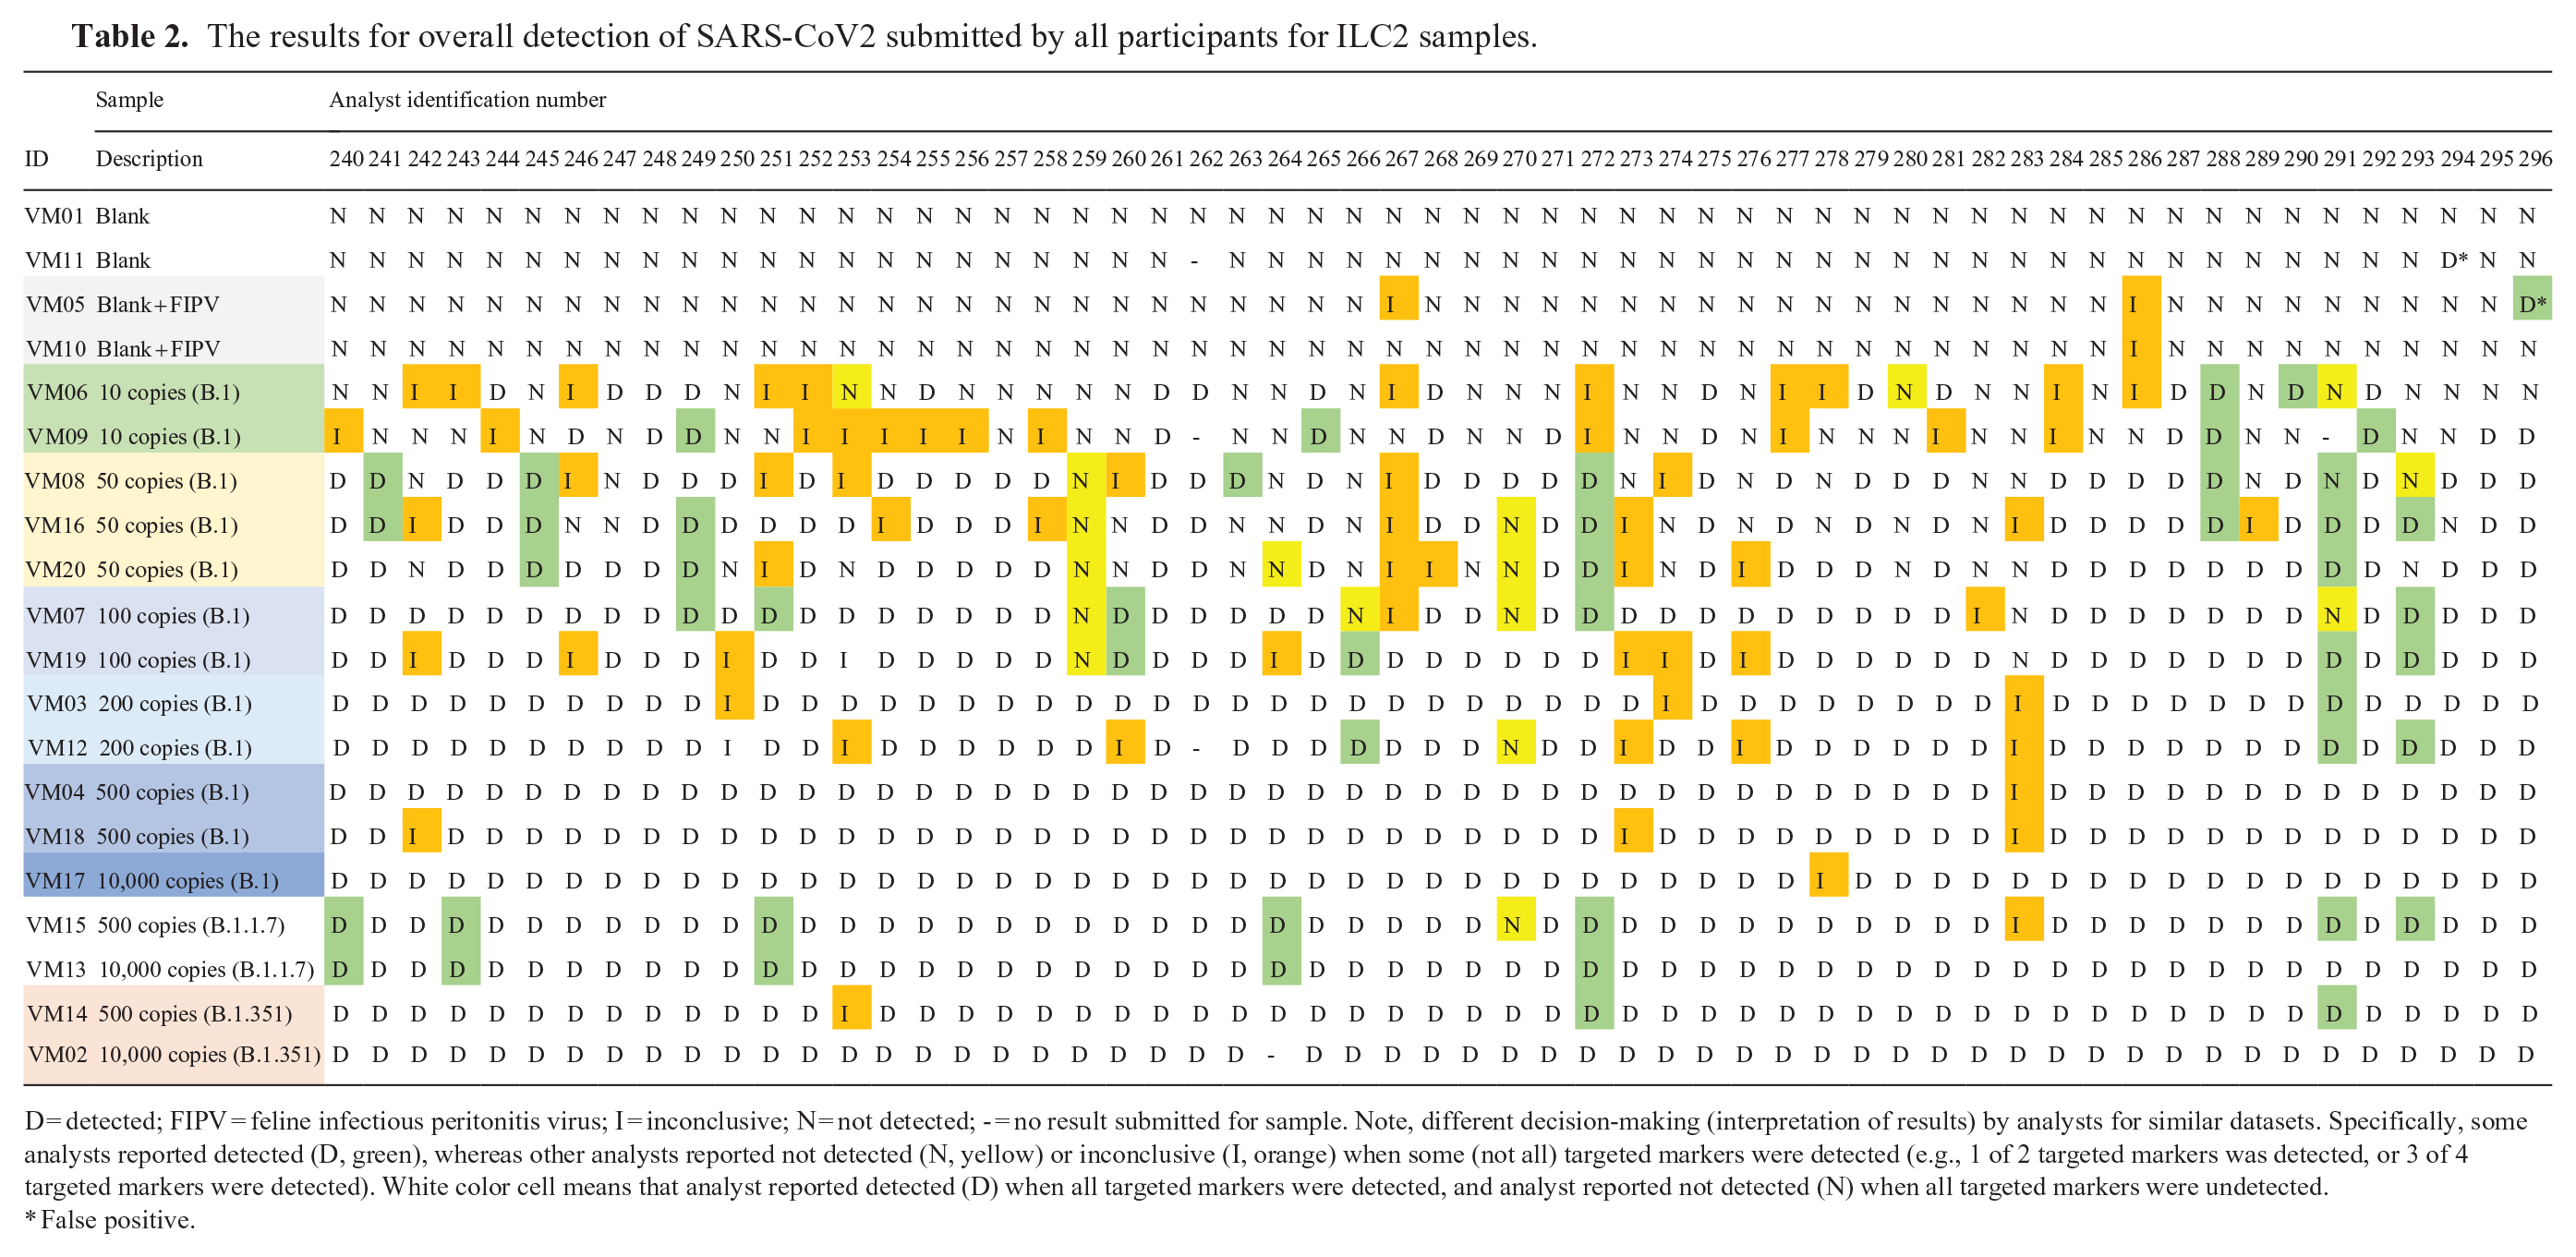
D = detected; FIPV = feline infectious peritonitis virus; I = inconclusive; N = not detected; - = no result submitted for sample. Note, different decision-making (interpretation of results) by analysts for similar datasets. Specifically, some analysts reported detected (D, green), whereas other analysts reported not detected (N, yellow) or inconclusive (I, orange) when some (not all) targeted markers were detected (e.g., 1 of 2 targeted markers was detected, or 3 of 4 targeted markers were detected). White color cell means that analyst reported detected (D) when all targeted markers were detected, and analyst reported not detected (N) when all targeted markers were undetected.
False positive.
Level of detection at 95% probability based on the effective volume (LOD95eff vol) and PCR efficiency for each marker.
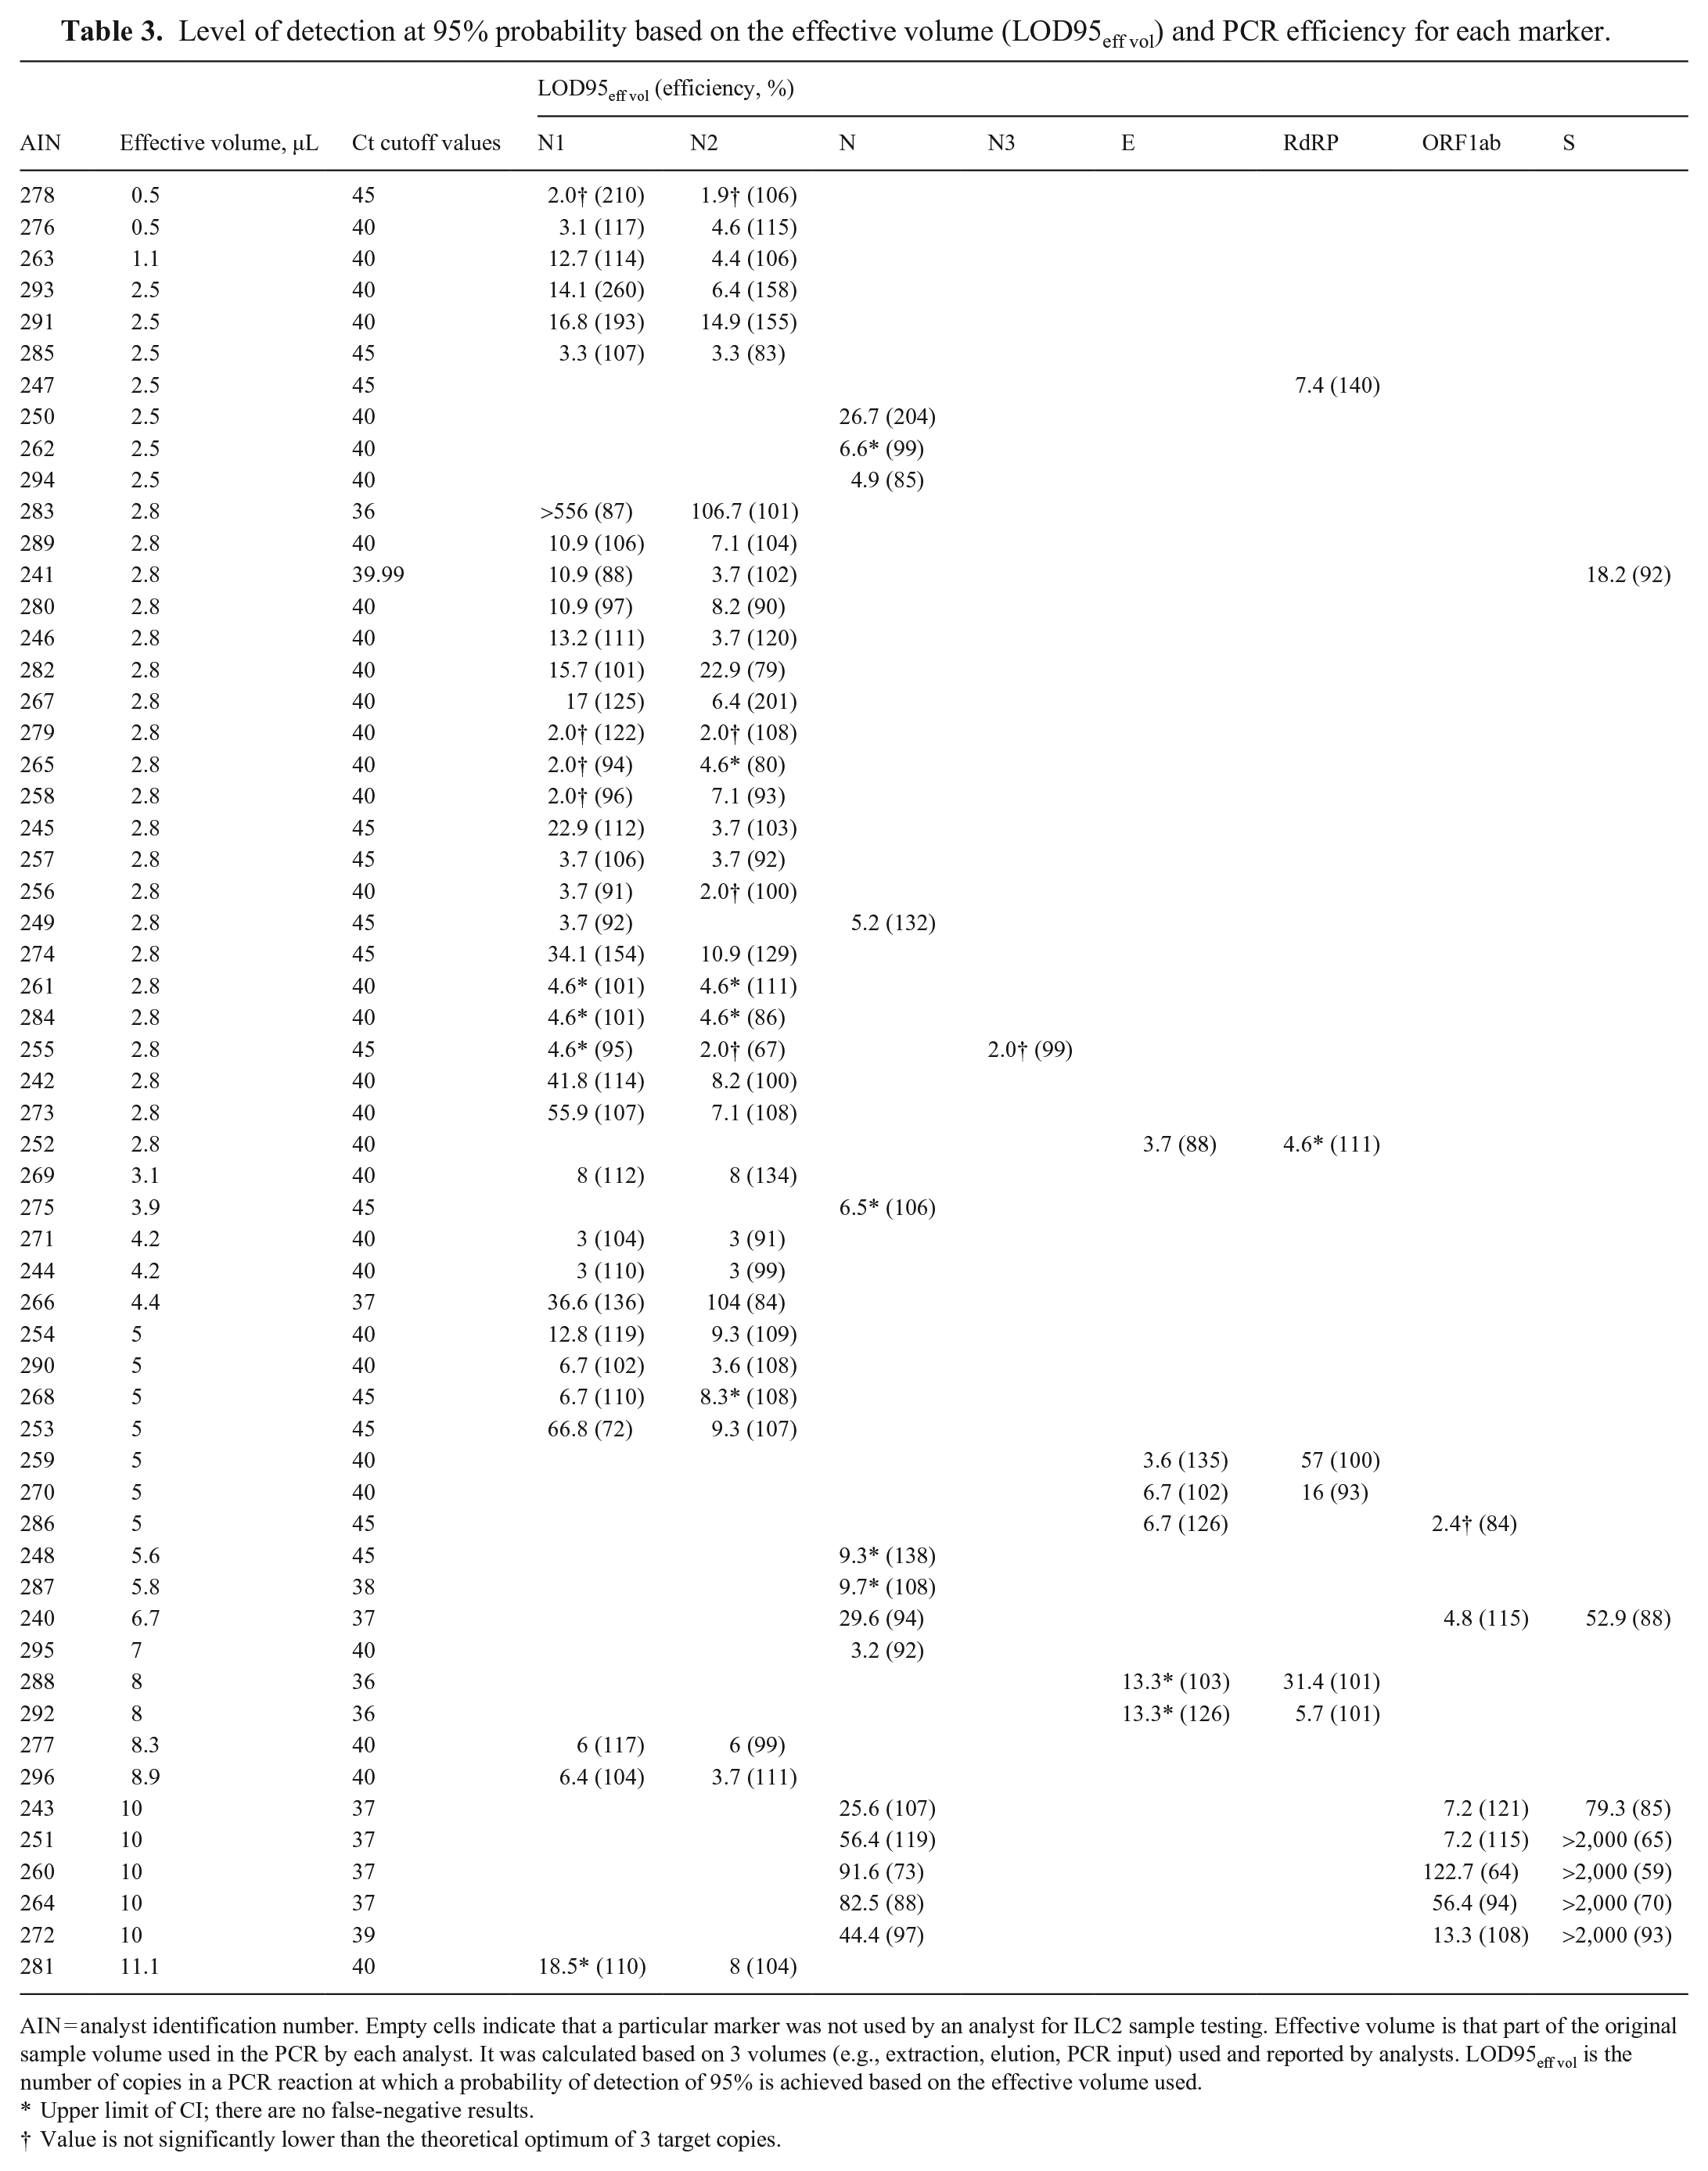
AIN = analyst identification number. Empty cells indicate that a particular marker was not used by an analyst for ILC2 sample testing. Effective volume is that part of the original sample volume used in the PCR by each analyst. It was calculated based on 3 volumes (e.g., extraction, elution, PCR input) used and reported by analysts. LOD95eff vol is the number of copies in a PCR reaction at which a probability of detection of 95% is achieved based on the effective volume used.
Upper limit of CI; there are no false-negative results.
Value is not significantly lower than the theoretical optimum of 3 target copies.
The ROD was calculated and summarized at each spike level (Table 4). For the overall detection as well as for the 2 most common markers (N1 and N2), the ROD values increased with increasing copy numbers as expected, consistently achieving ROD values >95% at 500 copies/50 µL. At 100 copies/50 µL, overall detection was 85%. Lower copy levels were also included to help assess levels of detection, and at the lowest spike level of 10 copies/50 µL, 26% of samples were still identified as positive for SARS-CoV2. One exception was observed for B.1 samples at 10,000 copies/50 µL; the ROD for N2 marker was <100% (i.e., 97%). This was the result of one false-negative result submitted at this high level, which also affected the calculated value of LOD95eff vol for the analyst (AIN 278).
Rate of detection (ROD) calculated for all analysts based on their overall detection and for those who used N1 and N2 markers.
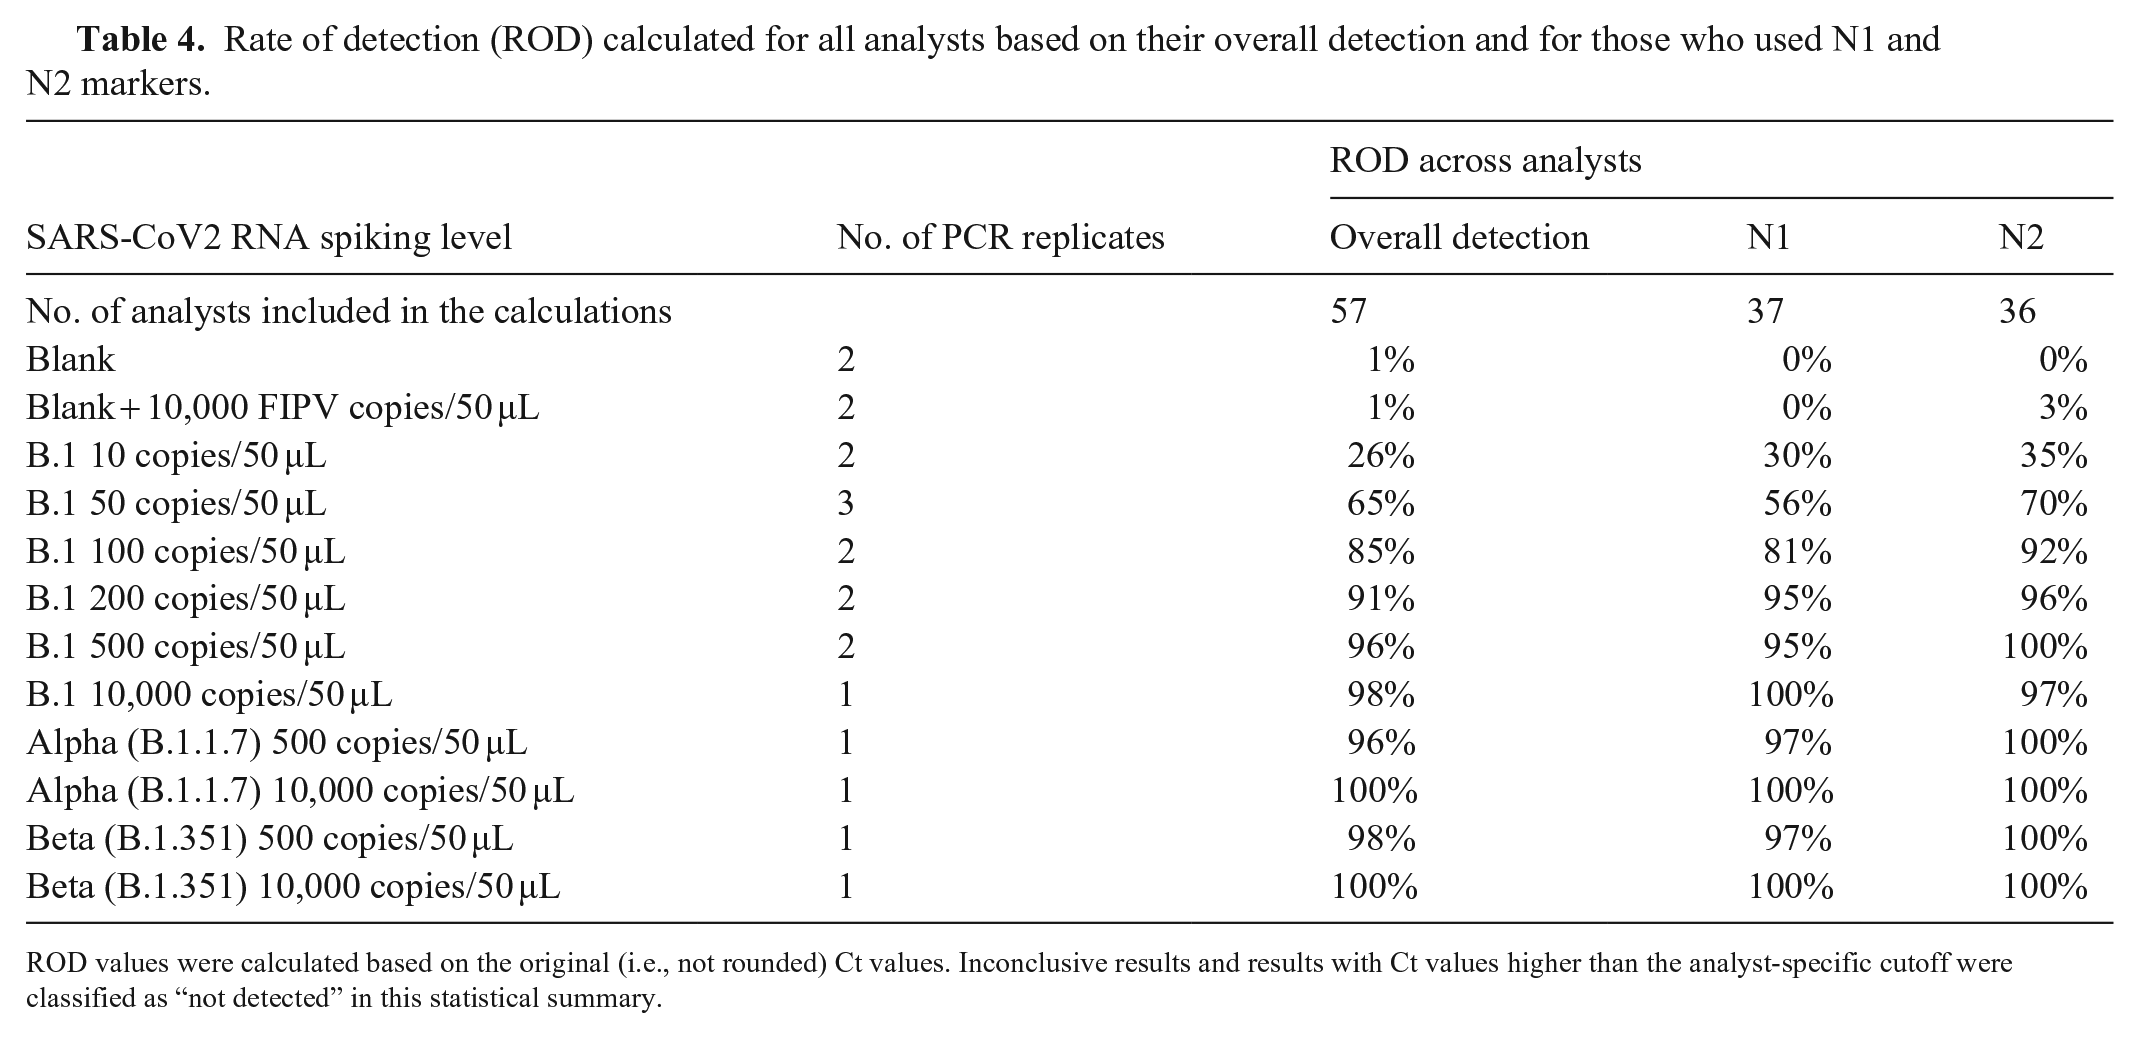
ROD values were calculated based on the original (i.e., not rounded) Ct values. Inconclusive results and results with Ct values higher than the analyst-specific cutoff were classified as “not detected” in this statistical summary.
We also sought to determine whether ROD varied for different SARS-CoV2 variants. For the Alpha (B.1.1.7) and Beta (B.1.351) variants, ROD values for N1, N2, and overall detection were nearly identical to the results from B.1, indicating that laboratories were able to detect SARS-CoV2 regardless of the variant. Among blank samples, there was only 1 false-positive (AIN 294), indicating a false-positive rate of <1% for all participants.
Analytical specificity of methods
The analytical specificity of the methods was evaluated by including the FIPV RNA as a confounder. Only 1 analyst (AIN 296) reported 1 false-positive for 1 of the 2 “Blank + FIPV” samples (Table 2). Importantly, this analyst detected the N2 marker, but not the N1 marker for this sample (Suppl. Table 2) and thus reported the sample as “detected” according to their internal protocols. Similarly, 2 other analysts (AINs 267, 286) detected the “Blank + FIPV” samples with only one of the markers (Suppl. Tables 2, 5); however, they reported the sample as “inconclusive” according to their internal protocols. Overall, ILC2 results revealed that the participants’ methods are specific to SARS-CoV2 and do not routinely yield false-positive results as a result of detection of FIPV RNA.
Analytical sensitivity and efficiency of methods
Analytical sensitivity was evaluated with LOD95eff vol (Table 3), which was calculated based on the actual RNA copy number added to the PCR for each analyst (i.e., effective volume for each spiking level). The 0.5–11.1-µL effective volumes tested varied by a factor of 22 among analysts (Table 3). The LOD95eff vol values varied greatly among participants and the markers they used. Sensitivities for N1 and N2 markers were summarized (Table 5), including LOD95 eff vol values calculated for AINs 283 and 266, which may be considered outliers. Specifically, AINs 283 and 266 reported Ct values for samples at low spike levels (≤200 copies; Suppl. Table 2). However, those values were counted as not detected because they were higher than the Ct cutoff values established by the analysts. Hence, the methods used in these 2 laboratories are likely sufficiently sensitive to detect more samples at lower spike levels, but established Ct cutoff values were too stringent (i.e., unoptimized), resulting in more false-negative results (Table 2) affecting LODs in these 2 laboratories. Thus, LOD95eff vol calculations with these 2 laboratories (AINs 283 and 266, for N1 and N2) are shown in Table 5; however, LOD95eff vol with these 2 laboratories excluded are interpreted below.
Comparative summary of sensitivity (number of false negative and LOD95eff vol) of each marker.
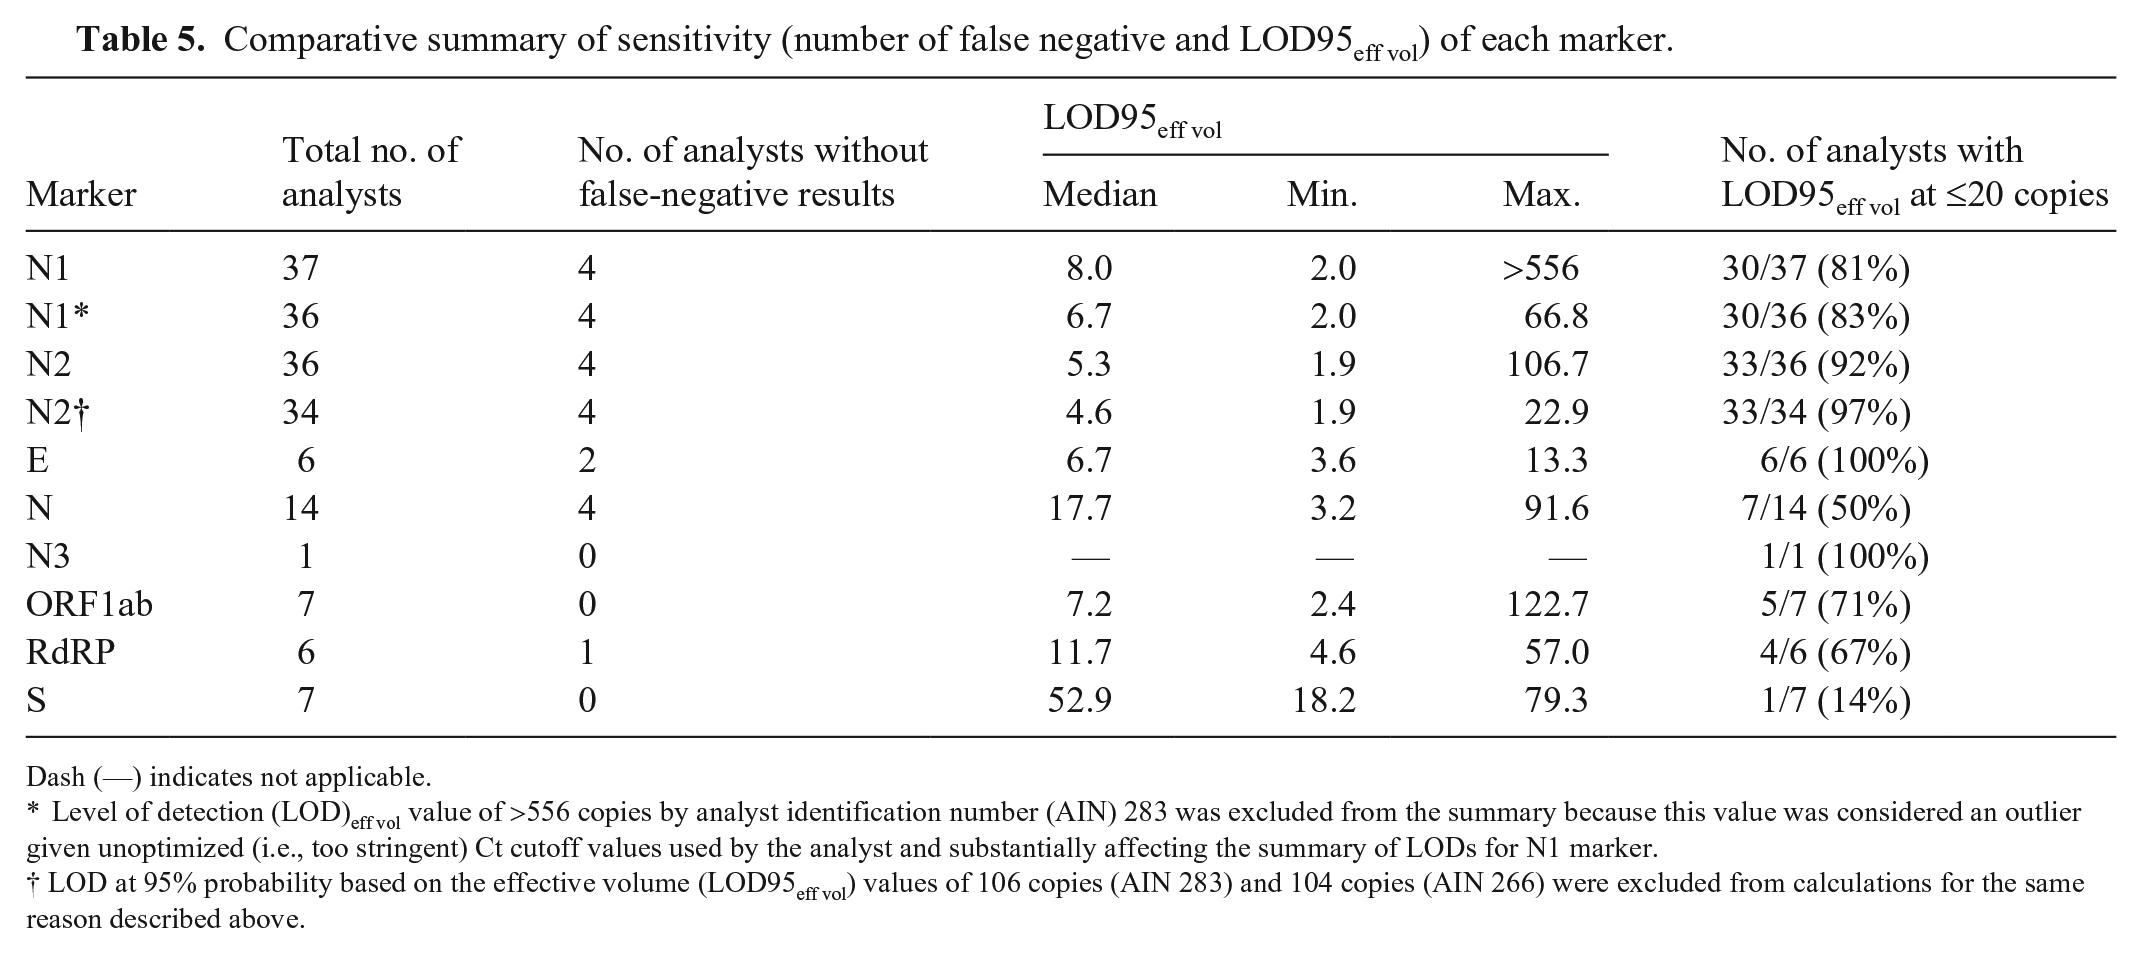
Dash (—) indicates not applicable.
Level of detection (LOD)eff vol value of >556 copies by analyst identification number (AIN) 283 was excluded from the summary because this value was considered an outlier given unoptimized (i.e., too stringent) Ct cutoff values used by the analyst and substantially affecting the summary of LODs for N1 marker.
LOD at 95% probability based on the effective volume (LOD95eff vol) values of 106 copies (AIN 283) and 104 copies (AIN 266) were excluded from calculations for the same reason described above.
As mentioned above, LOD95eff vol values from participants were combined for each marker and their median, minimum, and maximum LOD95eff vol values for comparative evaluation (Table 5). The LOD95eff vol values were 2.0–66.8 for the N1 marker, with a median of 6.7. This corresponded to a factor of ~30 between the lowest and highest values; although some analysts detected every copy of SARS-CoV2 RNA, others detected <10% of the copies. For the N2 marker, the LOD95 eff vol values were 1.9–22.9 with the median of 4.6 copies, indicating that methods based on the N2 marker were the most sensitive in ILC2. An ideal LOD95eff vol is calculated to be 3 copies per PCR reaction based on a hypothetical POD curve. 27 Given random variation, LOD95eff vol values <3 may be observed. For the N1 marker, 30 of 36 (83%) analysts had an LOD95eff vol value ≤20 copies, and 20 of 37 (54%) analysts had an LOD95eff vol value not statistically significantly >3 (meaning that the LOD95eff vol is within the margin of error of the best possible value). For the N2 marker, 33 of 34 (97%) analysts had an LOD95eff vol value ≤20 copies, and 27 of 36 (75%) analysts had an LOD95eff vol value not statistically significantly >3. For the E and N3 markers, all analysts (100%) had LOD95eff vol values at ≤20 copies. For the N, ORF1ab, and RdRP markers, only half of the analysts had LOD95eff vol near or equal to the best possible LOD—theoretical minimum of 3 copies. For the S marker, none of the analysts had LOD95eff vol near or equal to the best possible value of 3 copies, and only 1 of 7 (14%) analysts had an LOD95eff vol of ≤20 copies.
Calculated efficiency varied greatly among participants and markers that they used, as well (Table 3). In general, a PCR efficiency of 100% indicates that the target sequence of interest doubles during each cycle. If the Ct values change <3.3 cycles between 10-fold dilutions of the PCR template, efficiency values were >100%. Some of the calculated efficiencies are indeed >100%, which could be interpreted as an indication of problems in the amplification process. On the other hand, it should be noted that the calculation of efficiencies is associated with considerable statistical uncertainty as a result of unavoidable random fluctuations in the Ct values. This is especially true when, as in the present case, the underlying dilution levels differ by only a few orders of magnitude.
Discussion
The ILC2 provides insight into the performance of methods to detect SARS-CoV2 RNA in MTM. ILC2 demonstrated that most participants have relatively sensitive and specific methods to detect 3 SARS-CoV2 variants.
The analysts participating in ILC2 were instructed to follow their routine SARS-CoV2 detection procedure; hence, the testing methods varied between laboratories. The laboratories’ Ct cutoff values also varied, which resulted in some inconsistency in interpretations among analysts. For a study such as ILC2 in which various extraction and detection methods were involved, applying a universal Ct cutoff value for each marker to provide a score for each individual analyst is not realistic, even though it would simplify result interpretation. Method information provided by each analyst allowed the ILC2 organizers to statistically identify possible correlations with result variability. Analyst-specific results broken down by Ct values for different markers and with extraction and PCR methods annotated were summarized and provided to the analysts in an ILC2 report. These data are not shown here to protect the confidentiality of participants, particularly those who were using methods unique to their laboratory.
Most of the participating laboratories used the CDC N1 and N2 assays to detect SARS-CoV2 RNA. Research has reported one marker as more sensitive than the other or vice versa.22,29 In ILC1, 5 differences in ROD values between the 2 markers were very minor. In ILC2, the ROD values were higher for N2 than for N1, especially for 50–100 copies/50 µL for the B.1 variant. The LOD95eff vol values generated for the N1 and N2 markers indicated that 81% and 92% of ILC2 analysts, respectively, demonstrated an LOD95eff vol value of ≤20 copies. Other markers, such as E, N, N3, ORF1ab, RdRP, or S were used in the non-CDC assays. The number of analysts who used these markers, the LOD95eff vol values, and the sensitivity for each marker are also summarized in Table 5. All 6 analysts using the E marker were able to achieve an LOD95eff vol value of ≤20 copies; those using the S marker demonstrated the lowest sensitivity with only 1 of 7 analysts meeting this threshold. Importantly, all analysts using the S gene marker also had N and ORF1ab markers as part of their multiplex PCR assays.
The relationship between the effective volumes used and the observed LOD95eff vol values was not significant. Although we cannot rule out that high effective volumes make it more difficult to detect all copies, the observed LOD95eff vol values also depend on other factors. These factors may include extraction kit, PCR kit, reagents, model, or type of equipment, such as PCR machine, centrifuges, and pipettes, level of analyst’s experience, current quality control system in laboratory, multiplex versus singleplex approaches, and others. Information on some of these factors was provided in the confidential report for the participants. The variability in Ct values observed for particular analysts is also informative and can point to potential issues with methods that may affect success of analysts in future exercises.
ILC2 demonstrated a successful collaboration involving government agencies, universities, and private industry. By using a larger range of SARS-CoV2 RNA spiking levels, including lower concentrations, we evaluated the LOD95 eff vol values of the methods used by participating analysts more accurately than in ILC1. The laboratories were able to detect Alpha and Beta variants of SARS-COV2 with their current methods. The method specificity was confirmed by using FIPV RNA as a confounder and reached over 99%.
ILC2 was a success in meeting the stated objectives. The exercise allowed organizers not only to characterize important parameters of participants’ method performance (e.g., analytical sensitivity and specificity, efficiency, and suitability for different variants) but also allowed participants to compare their performance to each other. Organizers processed the submitted data using various statistical approaches that allowed them to not only identify possible weaknesses and strengths of methods used but to offer suggestions on improving participants’ performance in the future. Specifically, an important finding of the ILC2 is that individual analysts used different decision-making criteria during interpretation of similar datasets. This indicates a need for laboratories to review data from ILC2 and potentially reassess their decision-making criteria during interpretation of Ct values when using multiple markers. Our ILC2 study also indicates that the false-negative rate and sensitivity of some methods can be improved if Ct cutoff values used are re-evaluated (e.g., on a test that a too-stringent Ct cutoff value was originally used) and optimized by analysts accordingly.
In the current era of rapidly developing methodology and lack of international standards, participation in ILCs such as our study is very beneficial. Further exercises will be important to ensure continued detection of emerging SARS-CoV2 variants. In contrast to other types of proficiency testing exercises that only aim to assess which results are correct or incorrect, our ILC revealed much more about the methods used and assisted participants in continuous efforts to improve their performance.
Supplemental Material
sj-pdf-1-vdi-10.1177_10406387221115702 – Supplemental material for Second round of an interlaboratory comparison of SARS-CoV2 molecular detection assays used by 45 veterinary diagnostic laboratories in the United States
Supplemental material, sj-pdf-1-vdi-10.1177_10406387221115702 for Second round of an interlaboratory comparison of SARS-CoV2 molecular detection assays used by 45 veterinary diagnostic laboratories in the United States by Kaiping Deng, Steffen Uhlig, Laura B. Goodman, Hon S. Ip, Mary Lea Killian, Sarah M. Nemser, Jodie Ulaszek, Shannon Kiener, Matthew Kmet, Kirstin Frost, Karina Hettwer, Bertrand Colson, Kapil Nichani, Anja Schlierf, Andriy Tkachenko, Mothomang Mlalazi-Oyinloye, Andrew Scott, Ravinder Reddy and Gregory H. Tyson in Journal of Veterinary Diagnostic Investigation
Footnotes
Acknowledgements
We acknowledge the diligence and hard work of the laboratory scientists who developed SARS-CoV2 assays rapidly for animals and participated in our collaborative study. We acknowledge the following individuals for technical assistance and administrative support: Angelica Jones, Olgica Ceric, Ellen Hart, and Dave Rotstein from FDA; Joseph Flint from Cornell University; and Mia Torchetti and Christina Loiacono from USDA. We also thank Kirsten Simon from QuoData for supporting and facilitating this work. The Genomics Facility of the Biotechnology Resource Center at the Cornell University Institute of Biotechnology assisted with copy number quantification, and we thank Peter Schweitzer for this facilitation. We also thank Robert Newkirk from the FDA CFSAN Proficiency Team for sample shipment assistance.
Disclaimer
The views expressed in this article are those of the authors and do not necessarily reflect the official policy of the Department of Health and Human Services, the U.S. Food and Drug Administration, or the U.S. Government. The use of trade, firm, or product names is for descriptive purposes only and does not imply endorsement by the U.S. Government.
Declaration of conflicting interests
The authors declared no potential conflicts of interest with respect to the research, authorship, and/or publication of this article.
Funding
ILC2 was funded by the FDA Vet-LIRN program, and laboratories were not charged to participate in this exercise. Vet-LIRN laboratories may have also used infrastructure grant funds provided via Vet-LIRN funding opportunity PAR-17-141 to cover the cost of supplies.
Supplemental material
Supplemental material for this article is available online.
References
Supplementary Material
Please find the following supplemental material available below.
For Open Access articles published under a Creative Commons License, all supplemental material carries the same license as the article it is associated with.
For non-Open Access articles published, all supplemental material carries a non-exclusive license, and permission requests for re-use of supplemental material or any part of supplemental material shall be sent directly to the copyright owner as specified in the copyright notice associated with the article.