
Abstract
Accurate and timely results of diagnostic investigations and laboratory testing guide clinical interventions for the continuous improvement of animal health and welfare. Infectious diseases can severely limit the health, welfare, and productivity of populations of animals. Livestock veterinarians submit thousands of samples daily to veterinary diagnostic laboratories (VDLs) for disease diagnosis, pathogen monitoring, and surveillance. Individual diagnostic laboratory reports are immediately useful; however, aggregated historical laboratory data are increasingly valued by clinicians and decision-makers to identify changes in the health status of various animal populations over time and geographical space. The value of this historical information is enhanced by visualization of trends of agent detection, disease diagnosis, or both, which helps focus time and resources on the most significant pathogens and fosters more effective communication between livestock producers, veterinarians, and VDL professionals. Advances in data visualization tools allow quick, efficient, and often real-time scanning and analysis of databases to inform, guide, and modify animal health intervention algorithms. Value is derived at the farm, production system, or regional level. Visualization tools allow client-specific analyses, benchmarking, formulation of research questions, and monitoring the effects of disease management and precision farming practices. We present here the approach taken to visualize trends of disease occurrence using porcine disease diagnostic code data for the period 2010 to 2019. Our semi-automatic standardized creation of a visualization platform allowed the transformation of diagnostic report data into aggregated information to visualize and monitor disease diagnosis.
Introduction
Each year, U.S. veterinary diagnostic laboratories perform millions of tests on samples submitted from individual animals or animal populations for disease diagnosis, agent surveillance, monitoring status or exposure, and for regulatory purposes. In population medicine, production animal veterinarians are charged with diagnosis and monitoring of diseases and agents of disease that are often endemic, yet dynamic, within herds and flocks. Clinicians and producers often devote considerable effort and expense to the collection, collation, and interpretation of veterinary diagnostic laboratory (VDL) information to inform strategies to mitigate disease impacts on health, productivity, or animal welfare.
The objectives of laboratory testing are usually to confirm the presence of a suspected disease or to elucidate cause(s) of clinical disease for immediate intervention decisions, or for surveillance and monitoring for the presence or absence of exotic or endemic agents that may be present subclinically in a population. Laboratory submissions for the latter usually require larger numbers of samples, often randomly selected. Analysis of aggregated qualitative results of tests (i.e., positive or negative) for specific agents in various sample types can be highly informative and has particular value to veterinarians who have the responsibility of managing health decisions for various groups of animals within a production system. The aggregated results of laboratory testing by PCR, bacterial culture, serologic testing, or gene sequencing is useful to understand epidemiologic patterns, and depends on sample type, test type, test results, or geospatial distributions over time for identifying trends in analyte detection,12,13,16 but cannot be directly used to estimate prevalence or incidence, given that sampling and submissions are not random across broad populations.
With computerized laboratory information management systems (LIMS), most laboratories can easily aggregate and summarize test results by analyte, sample type, test type, and test result in cases submitted over time and geographical location using available sample demographic information. However, test result data alone do not confirm the biological relevance or role of a detected analyte in the clinical disease specified in the case definition provided by the attending veterinarian. Detection of a pathogen not previously known to be present can be suggestive for disease diagnosis; however, the detection of an agent endemic in a population, particularly with highly sensitive testing methods, does not provide sufficient evidence to confirm a role in disease. A specific disease diagnosis relies on the detection of pathogens or analytes coupled with compatible clinical and pathologic observations obtained through rigorous examination. 4 In population medicine, the purpose and context of sampling, test selection, test results, and interpretation are critical factors that must be considered before offering a definitive diagnosis of disease presence and causative agent(s).
The management of swine production systems provides a very appropriate model for combining aspects of epidemiology and agent detection with disease expression. Swine veterinarians are charged with improving the health and welfare of the entire swine herd, which is often made up of thousands of individual animals in age-segregated groups constantly flowing through the production system. As population medicine experts, herd veterinarians can use VDL data to monitor analytes, disease, and intervention efficacy with statistical tools to predict health or disease in various groups of animals moving through time. The value of VDL data for historical analysis is recognized but has been difficult to achieve consistently or in real-time. Moreover, the use of near-real-time data in statistical monitoring models can stimulate actionable interventions that may be used to stave off epidemics or losses to various infectious and noninfectious diseases. At the Iowa State University Veterinary Diagnostic Laboratory (ISU-VDL), a disease diagnostic coding system (Dx code) has been implemented to capture components of confirmed disease presence in individual animals or animal groups of any species. 6 This coding system provides a simple 4-component summary (Table 1) of the diseases confirmed present in a case submission. At the ISU-VDL, disease confirmation by pathologists is based on 2 or more lines of evidence for a specific disease, often through the serial application of laboratory tests. 4 Briefly, Dx code(s) are assigned at the conclusion of each diagnostic investigation for each case evaluated by a diagnostic pathologist. Codes are selected from a menu, filtered by species, and are chosen based on history, clinical context, pathologic changes, and laboratory testing evidence. The disease Dx code system has 4 components: (1) Body system, (2) Insult type, (3) Lesion/tissue type, and (4) Disease name, etiology, or analyte (Table 1). 6 This system of Dx codes provides a platform for retrospective searching for cases with specific disease conditions, insult types, or body systems affected over time and geographical area, along with associated demographic parameters. It is designed to provide anonymity, yet be universally applicable to stakeholders including diagnosticians, submitting clinicians, researchers, educators, and others interested in the frequency of diagnosis of specific disease conditions.
Examples of Dx code(s), customized by animal species, applied by diagnostic pathologists based on available history, pathology examination, and laboratory testing. Each Dx code has 4 components: system (9 choices), insult type (13 choices), lesion/tissue (many options), and etiology/disease (many options).
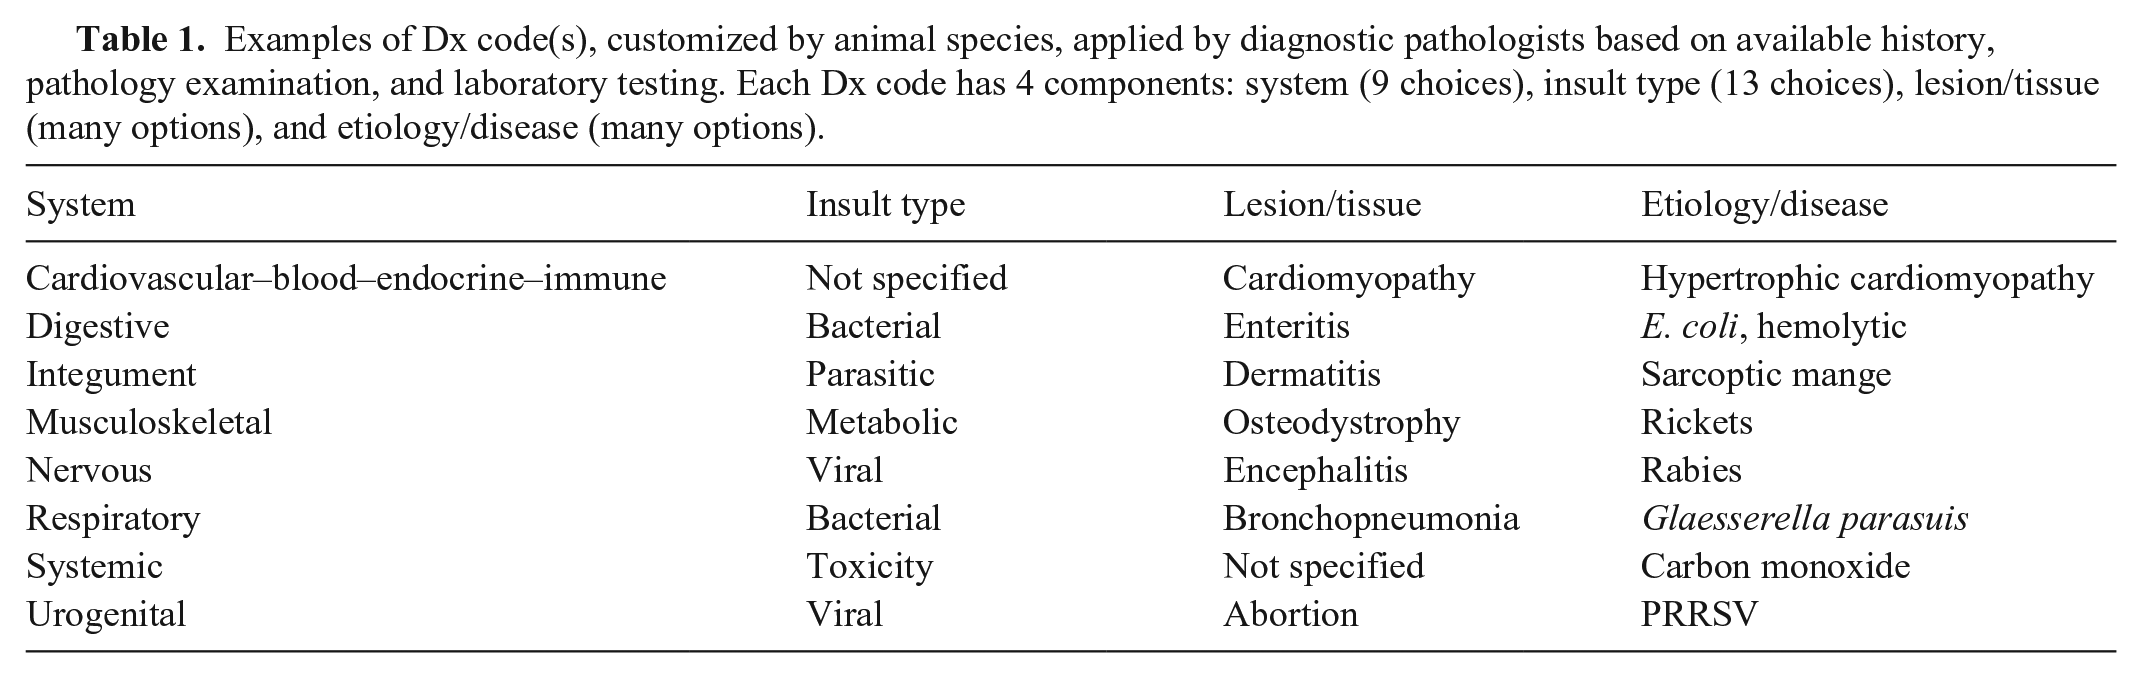
There are cases in which evidence or clinical context do not warrant a specific code for each of the 4 components of the Dx code, in which case the code “not specified” is applied (e.g., inadequate submission data or clinical history; appropriate testing is not requested by the submitting veterinarian, economic constraints, proper samples are not available; or a suspected etiologic agent is simply not detected because of prior medication or the stage of disease at sampling). Importantly, the specific details and nuances of each case remain available by review of the original case report. In addition, the results of all laboratory tests performed for each case can be obtained by query of a test-result database using the accession numbers of cases of interest.
The application of appropriate information technology (IT) tools is necessary to translate data into information and to create visual capabilities. Assuring data integrity and standardization is the first step, as well as creating database platforms that recognize and transmit data in a standardized format. To use data precisely, it is imperative that the information is captured and organized accurately including geospatial, temporal, species, signalment, demographic, and clinical information to provide context to the data output. Much of this process can be automated or captured electronically with web submissions. However, the capabilities available in the LIMS are critical to allow data communication and leverage between VDLs or other data-integration platforms. Once these data are archived in a “clean” data warehouse (“collated”), 14 then additional tools are useful to begin the analysis. Data in the form of lists and tables are useful but do not always offer the ability to “visualize” data and trends. Visualization with clarity and minimal distortion or bias is the key to identifying potential problems. Ideal tools can facilitate exploration and analysis of data, improve the ability to collaborate with others, allow users to ask researchable questions, and provide a platform to monitor the effects of applied interventions. Implementation of continuous feedback loops improves the accuracy and utility of VDL data and its implications for animal health or disease. The step-by-step approach presented here is but one way to serve the needs of a subset of stakeholders for porcine disease diagnosis. The systems presented here are intentionally flexible and nimble, thus able to adapt to the needs of myriad stakeholders who may benefit from insights that VDL data visualization can provide.
Materials and methods
Data structure and data collection
Based on the 4 Dx code components currently in use at ISU-VDL (Table 1), all qualifying porcine accessions (i.e., cases, submissions) were recovered from the LIMS in a comma-separated value (CSV) format. Qualifying accessions for these queries are only those that contain samples that allow macroscopic and/or microscopic pathology examination performed by a pathologist as part of the diagnostic investigation.
In addition to the 4 Dx code components, also recovered from case data were accession ID, received date, age, age unit, farm type, and reason for submission. All information was summarized to reflect the status at the accession or herd level, which is the preference of swine veterinarians and health professionals charged with providing herd-level, data-driven recommendations. Herd diagnosis is usually based on the diagnosis in selected individuals from the herd, site, barn, or room, the results of which are then extrapolated to the entire population at risk. Data were grouped at the accession level using the unique identifier (accession ID) as the identifier at the time of submission. The date of receipt at the ISU-VDL was used as the timeline reference. The state in which samples were collected was used as a geographic identifier.
The data recovered in a CSV format was uploaded to SAS (v.9.4; SAS Institute) to be cleaned, organized, and prepared to a collated format for connection to a data visualization tool (Power BI [Power Business Intelligence]; Microsoft), to build a disease diagnosis visualization platform. Power BI desktop built-in add-in features were used to construct charts that were later uploaded online at the Power BI Pro (Fig. 1). Based on the Dx code components, entry errors that were identified as non-porcine were removed. Additionally, only samples collected in the United States based on the column “site state” were retained. Three levels of information were explored: (1) the overall disease diagnosis, (2) the frequency of diagnosis by etiology/disease, and (3) the frequency of diagnosis by systems and, when applied, the combination of respective etiologies by a system. For levels 2 and 3, removal criteria were implemented to retain only porcine cases routinely submitted to the ISU-VDL for disease diagnosis, removing those that were performed for research purposes (based on Dx code “System-Research” or “reason for submission-Research” (Fig. 1).

Flowchart for data visualization and monitoring of porcine disease diagnosis.
Preparing data for overall Dx code visualization
Downloaded data in a CSV format from the LIMS was imported into SAS. Accessions were permitted to have more than one unique Dx code. Prepared data were exported from SAS in a CSV format to be connected with Power BI.
Preparing data for the component “etiology/disease” visualization
Given that more than one Dx code could be entered for each different system and/or each different animal sampled and evaluated, duplicates for the field “etiology” occur. A SAS DATA step script and SQL procedure were implemented to remove duplicates for the field “etiology/disease”. For accessions in which more than one Dx code was assigned reporting the same component for “etiology/disease,” a data procedure was implemented to organize and report the combination of systems. For example, if the Dx code “nervous, viral, encephalitis, PRRSV” and the Dx code “respiratory, viral, pneumonia, PRRSV” where reported concomitantly, the organized final data would report “etiology-PRRSV”, “system-respiratory nervous”.
Preparing data for the component “system” visualization
Several different Dx codes can potentially be assigned to a particular system when 2 or more “etiology/disease” codes are diagnosed in combination affecting that system. To report the most frequent combinations of “etiology/disease” within a “system,” an additional DATA step and SQL SAS script was written and implemented to manage the data and prepare the “etiology/disease” field. This step allows the visualization tool to report the combinations of co-diagnoses by the particular “system” and by the submission level. As an example, if Dx code “respiratory, viral, pneumonia, PRRSV” and the Dx Code “respiratory, viral, bronchiolitis, influenza A” were concomitantly recorded to the respiratory system, the organized final data would report both etiologies “PRRSV and influenza A virus” as a single record under the respiratory system.
To facilitate and simplify data visualization, the “etiology/disease” records that represent < 3% of all assigned Dx code within each “system” were grouped as “other” in the field “etiology/disease”. “Not specified” was deleted as an “etiology/disease” code if multiple etiology/disease codes were assigned to a single system. As an example, if Dx codes “respiratory, bacterial, pneumonia, Actinobacillus pleuropneumoniae” and the Dx codes “respiratory, viral, interstitial pneumonia, not specified” were assigned, the final organized data would report only “system = respiratory”, “etiology = Actinobacillus pleuropneumoniae”.
Data connection and visualization
The 3 datasets (overall Dx code, etiology/disease, and system), thus prepared for visualization, were exported from SAS in a CSV format and then connected to the Power BI desktop to construct dynamic dashboards using the built-in add-in Power BI features. Constructed dashboards were uploaded online in Power BI Pro, securely shared on the web, and embedded in a password-protected website making them available to stakeholders through an internet connection. Built-in capabilities of Power BI were used in the dashboards to provide clickable options (e.g., buttons) for dividing and grouping the information, according to predefined fields. Power BI also has built-in features to schedule weekly refreshing and importation of newly generated data into the visualization platform. Additionally, the Windows Task Scheduler tool allowed scheduling of weekly runs of the SAS scripts to process newly received data, integrate with the historical data, and export it in the structured format to connect with Power BI.
Monitoring disease diagnosis
A capability to monitor the number of unique Dx codes entered each week was implemented to identify significant weekly changes in the frequency of diagnoses that may warrant further investigation. Every week, 3 levels of monitoring were assessed: 1) the overall number of submissions with disease diagnoses, 2) the number of diagnoses by a system, and 3) the number of diagnoses by an etiology/disease. Changes in the number of diagnoses above the expected were assessed by using the EARS C1 model. 5 Weekly total counts for the total number of submissions by a “system” and by an “etiology/disease” were implemented in R v.4.0.0 (https://www.r-project.org/). To assess the weekly changes, the EARS C1 method takes a 7-wk sliding baseline, whereby the previous 7-wk total number of cases is used to calculate a mean baseline and the SD from the mean. On the EARS C1 method, a one-side cumulative sum (CUSUM) equation scans the expected mean and is used to predict the above-expected number of diagnoses in the upcoming week. 5 When the observed number of diagnoses exceeds the expected by 3 SDs from the observed mean in the sliding baseline, the algorithm pinpoints an alarm signal. 5 Weekly counts of the number of diagnoses and the EARS C1 algorithm were implemented using R package surveillance, 7 and an EARS C1 script written previously. 9
A hierarchical scale of monitoring and investigation was adopted by first looking at the total number of submissions for porcine disease diagnosis, followed by the number of diagnoses by body system, and then by the etiology/disease agent. Given that data were collected passively from samples submitted to the ISU-VDL, identified significant weekly changes in the number of diagnoses may be unduly influenced by a single submitter intensively investigating a particular etiology thereby creating a significant number of false-positive signals of the number of diagnoses for an etiology/disease. As a method to minimize a submitter-specific effect on the etiology/disease level, a signal was only considered when 2 signals in a 4-wk interval were pinpointed. All body systems were monitored. Only agents with 800 or more diagnoses in the summarized period were included in the monitoring script.
Results
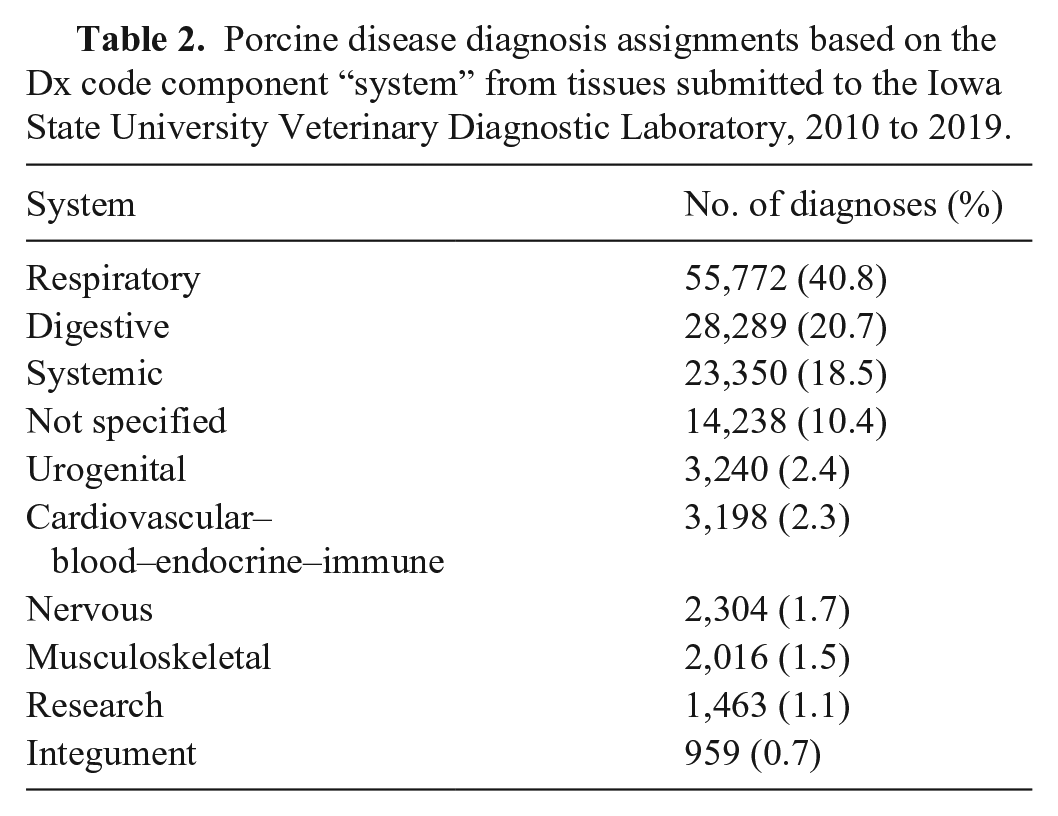
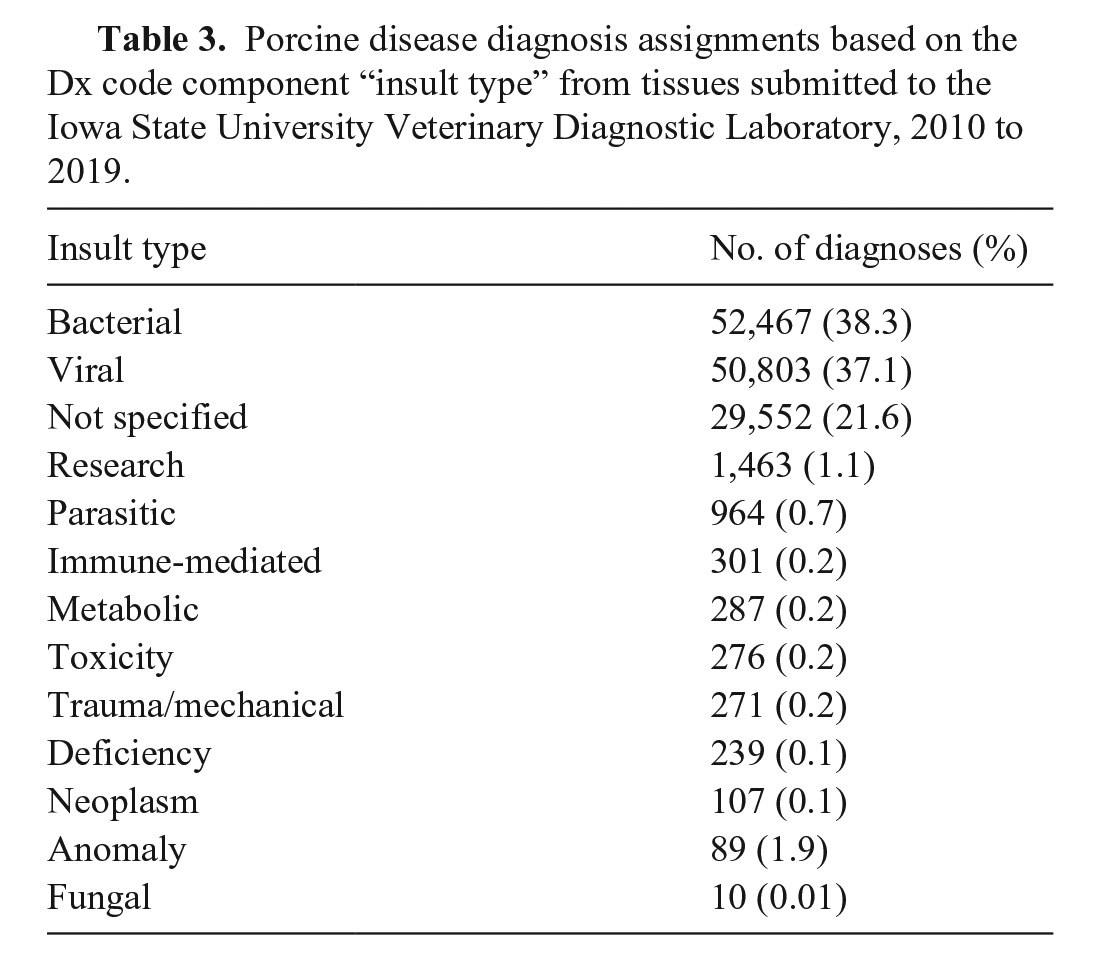
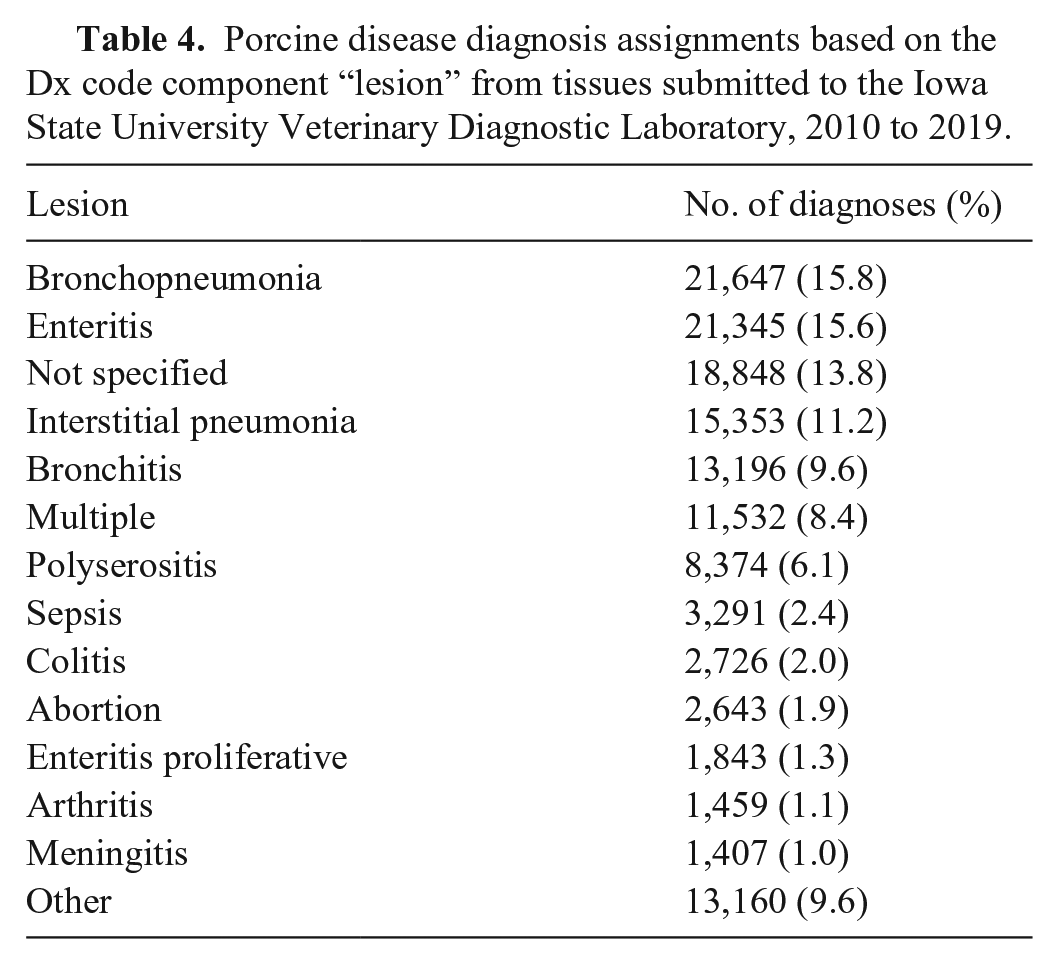
We retrieved from the ISU-VDL LIMS and included in our analysis summarized information from 93,216 porcine accessions, evaluated by ISU-VDL pathologists between 2010 and 2019. Although our initial data search was intended to retrieve only porcine cases, preliminary data cleaning identified 7 entry errors (i.e., submissions that were non-porcine) and 169 accessions that originated from outside the United States, and these data were removed (Fig. 1). The remaining 93,040 accessions had one or more Dx code assigned, for a total of 136,829 Dx code assignments. In summary, accessions with confirmed disease by system were mostly for respiratory, digestive, and systemic systems (Table 2). When summarized by “insult type”, bacterial and viral were most frequent, followed by cases that had an “insult type” as “not specified” (Table 3). Of the applied Dx codes, bronchopneumonia and enteritis were the lesions identified most frequently (Table 4, Suppl. Fig. 1).
Porcine disease diagnosis assignments based on the Dx code component “system” from tissues submitted to the Iowa State University Veterinary Diagnostic Laboratory, 2010 to 2019.
Porcine disease diagnosis assignments based on the Dx code component “insult type” from tissues submitted to the Iowa State University Veterinary Diagnostic Laboratory, 2010 to 2019.
Porcine disease diagnosis assignments based on the Dx code component “lesion” from tissues submitted to the Iowa State University Veterinary Diagnostic Laboratory, 2010 to 2019.
Etiology visualization
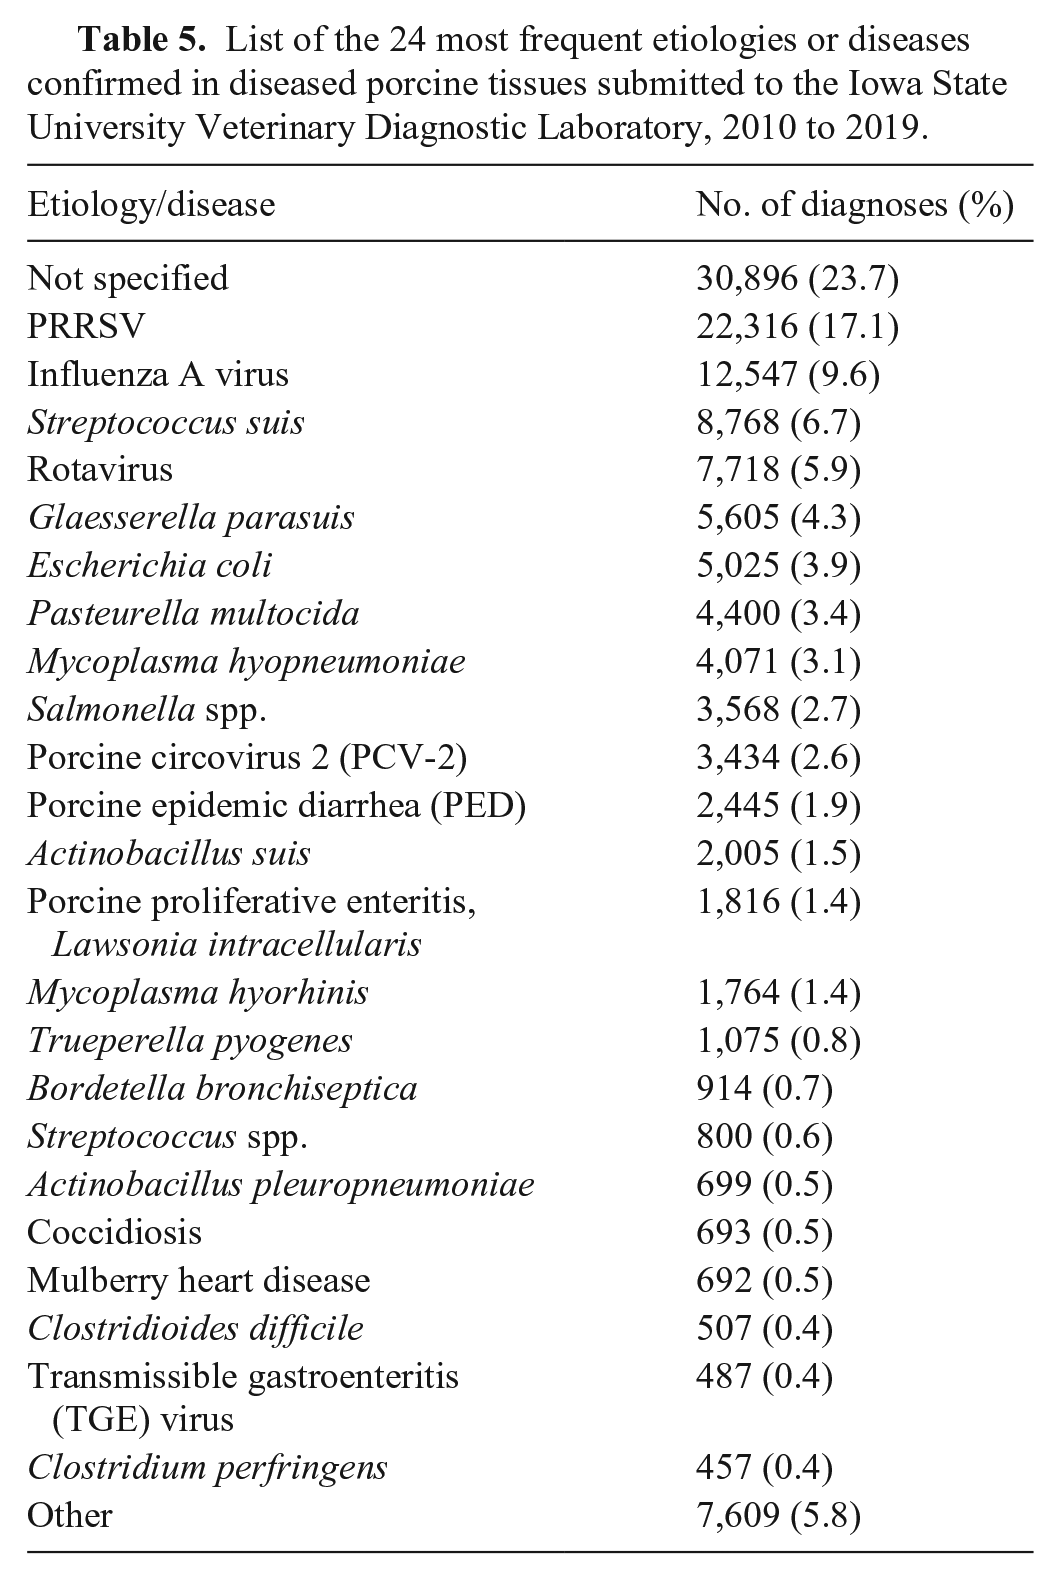
After removing 1,873 accessions coded as research, 91,167 accessions were retained for visualizing diagnoses by the “etiology/disease” and “system” component (Fig. 1). Of the remaining accessions, 130,311 unique etiology assignments were identified at an accession level; 23.7% had no “etiology” confirmed. Porcine reproductive and respiratory syndrome virus (PRRSV), influenza A virus, and Streptococcus suis were the 3 etiologies that were identified most frequently (Table 5).
List of the 24 most frequent etiologies or diseases confirmed in diseased porcine tissues submitted to the Iowa State University Veterinary Diagnostic Laboratory, 2010 to 2019.
System visualization
Visualization of disease diagnosis by “system” allows insight into trends over time and geographic area. The 2 most frequent systems, respiratory and digestive, along with the etiology/disease component of respective Dx codes, can be used to demonstrate utility. In both the respiratory and digestive systems, the samples submitted for diagnoses came from 45 of 50 U.S. states. There was a repetitive pattern of respiratory diagnoses, with most cases occurring during the fourth quarter of the year (October–December; Fig. 2). Influenza and PRRS were the 2 respiratory diseases confirmed most frequently and were the major co-diagnoses at a submission level (Fig. 2).
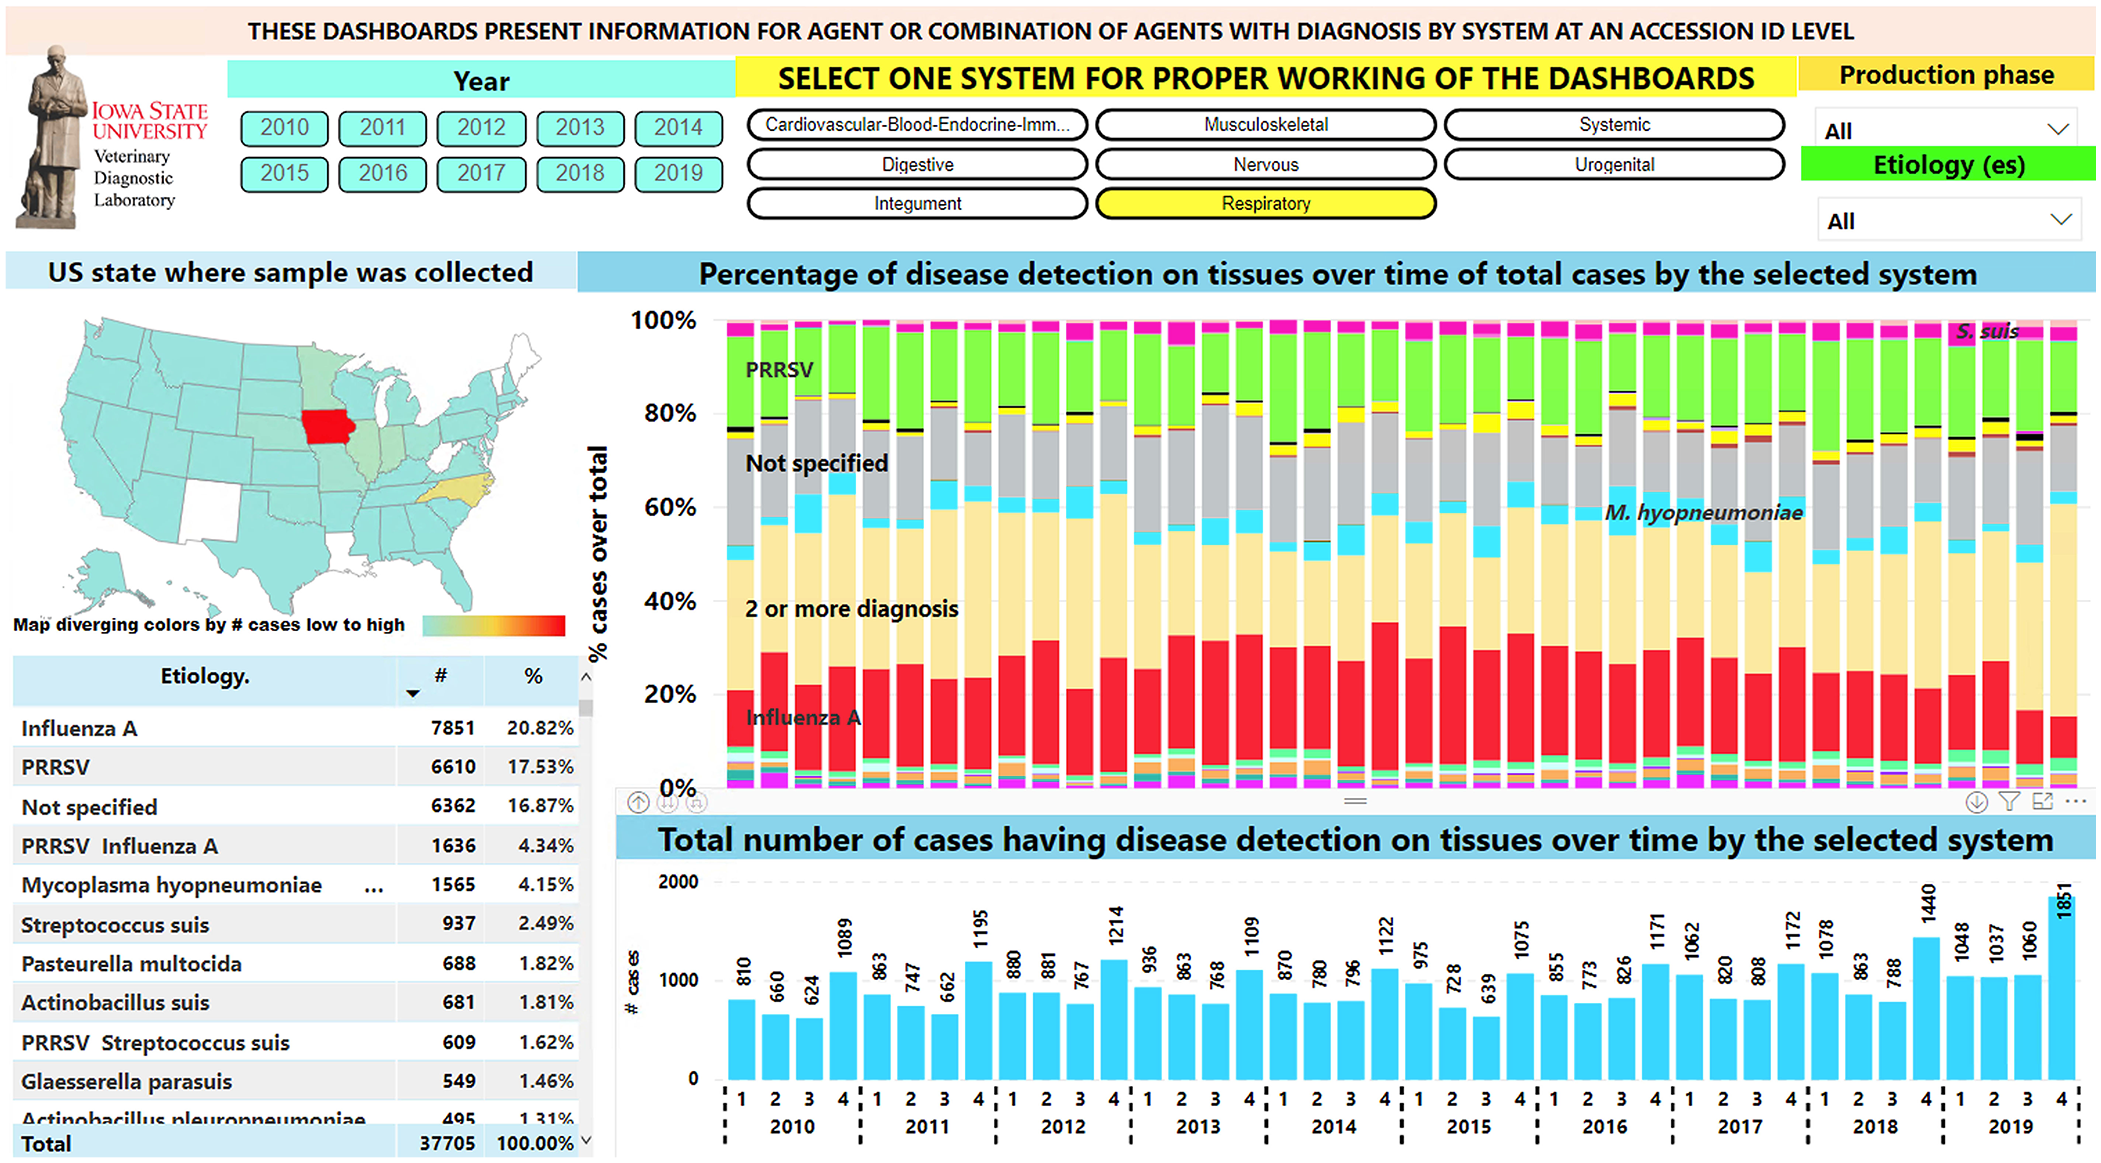
Respiratory disease diagnosis over time. Top filters can be used in the dashboard to slice the data. Left middle, map: geographic state in which samples were collected. Right middle: bar chart with proportion of diagnoses by etiology. Most frequently detected etiologies are indicated overlaid on the respective color bar. Bottom right: bar chart with total respiratory cases per year and quarter. Bottom left: table for etiology, number of cases, and proportion of total respiratory cases.
Rotaviral enteritis and colibacillosis were the diseases implicated most frequently in digestive Dx code data and formed the most frequent co-diagnosis (Fig. 3). The number of digestive diagnoses on a quarterly basis before 2013 and after the 2nd quarter of 2014 was similar. During 2013 and 2014, the increased number of diagnoses was likely a result of the porcine epidemic diarrhea epidemic (Fig. 3). Only 7 accessions with a transmissible gastroenteritis diagnosis were recorded after 2013. Additionally, after 2013, the largest number of porcine proliferative enteritis cases assigned to Lawsonia intracellularis within a year were identified during the 3rd quarter of the year (July–September; Fig. 3).
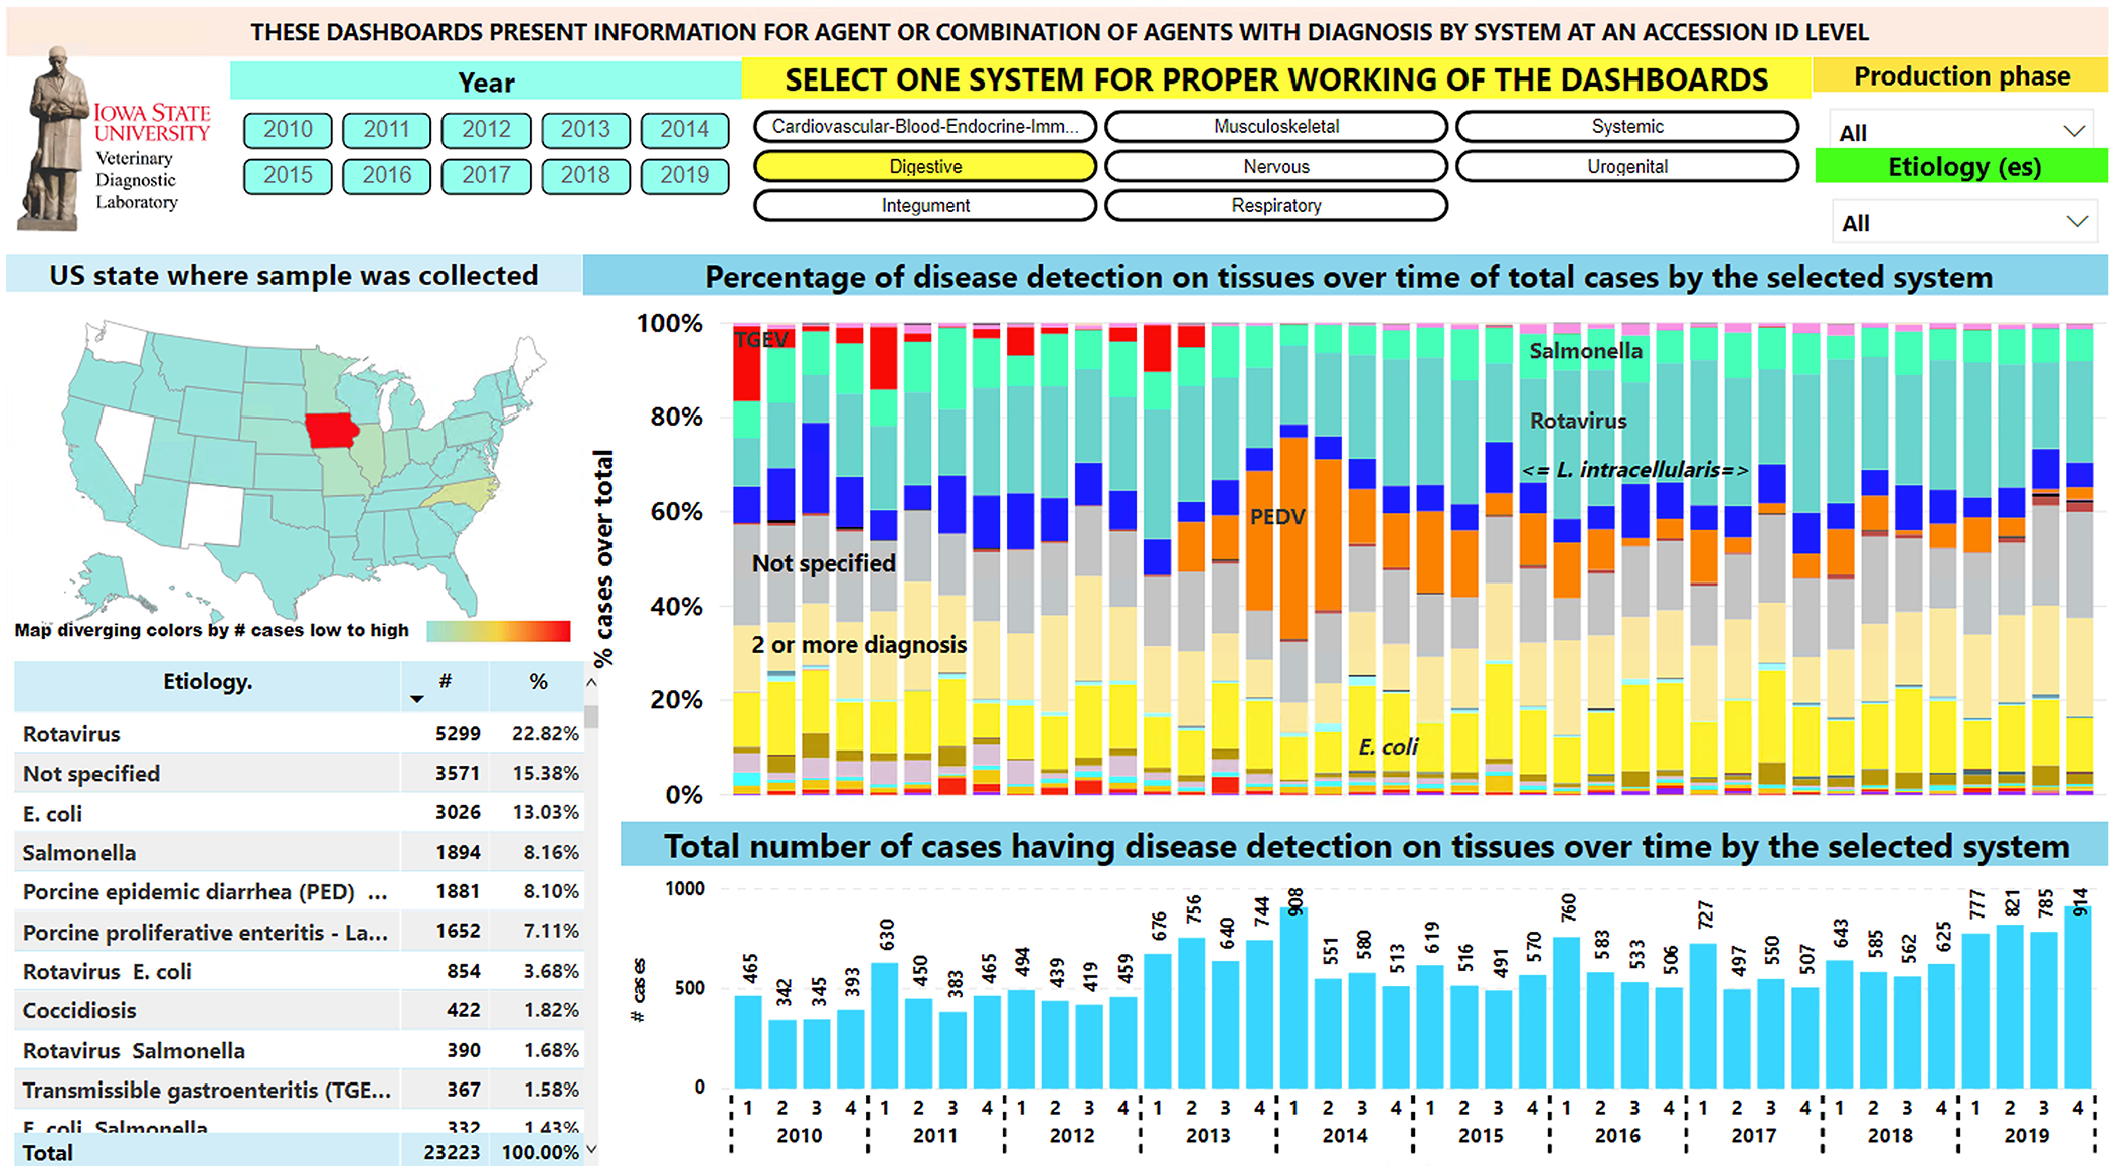
Digestive disease diagnoses over time. Top filters can be used in the dashboard to slice the data. Left middle, map: geographic state in which samples were collected. Right middle: bar chart with proportion of diagnoses by etiologies. Most frequently diagnosed etiologies are indicated overlaid on the respective color bar. Bottom right: bar chart with total digestive cases per year and quarter. Bottom left: table for etiology, number of cases, and proportion of total digestive cases.
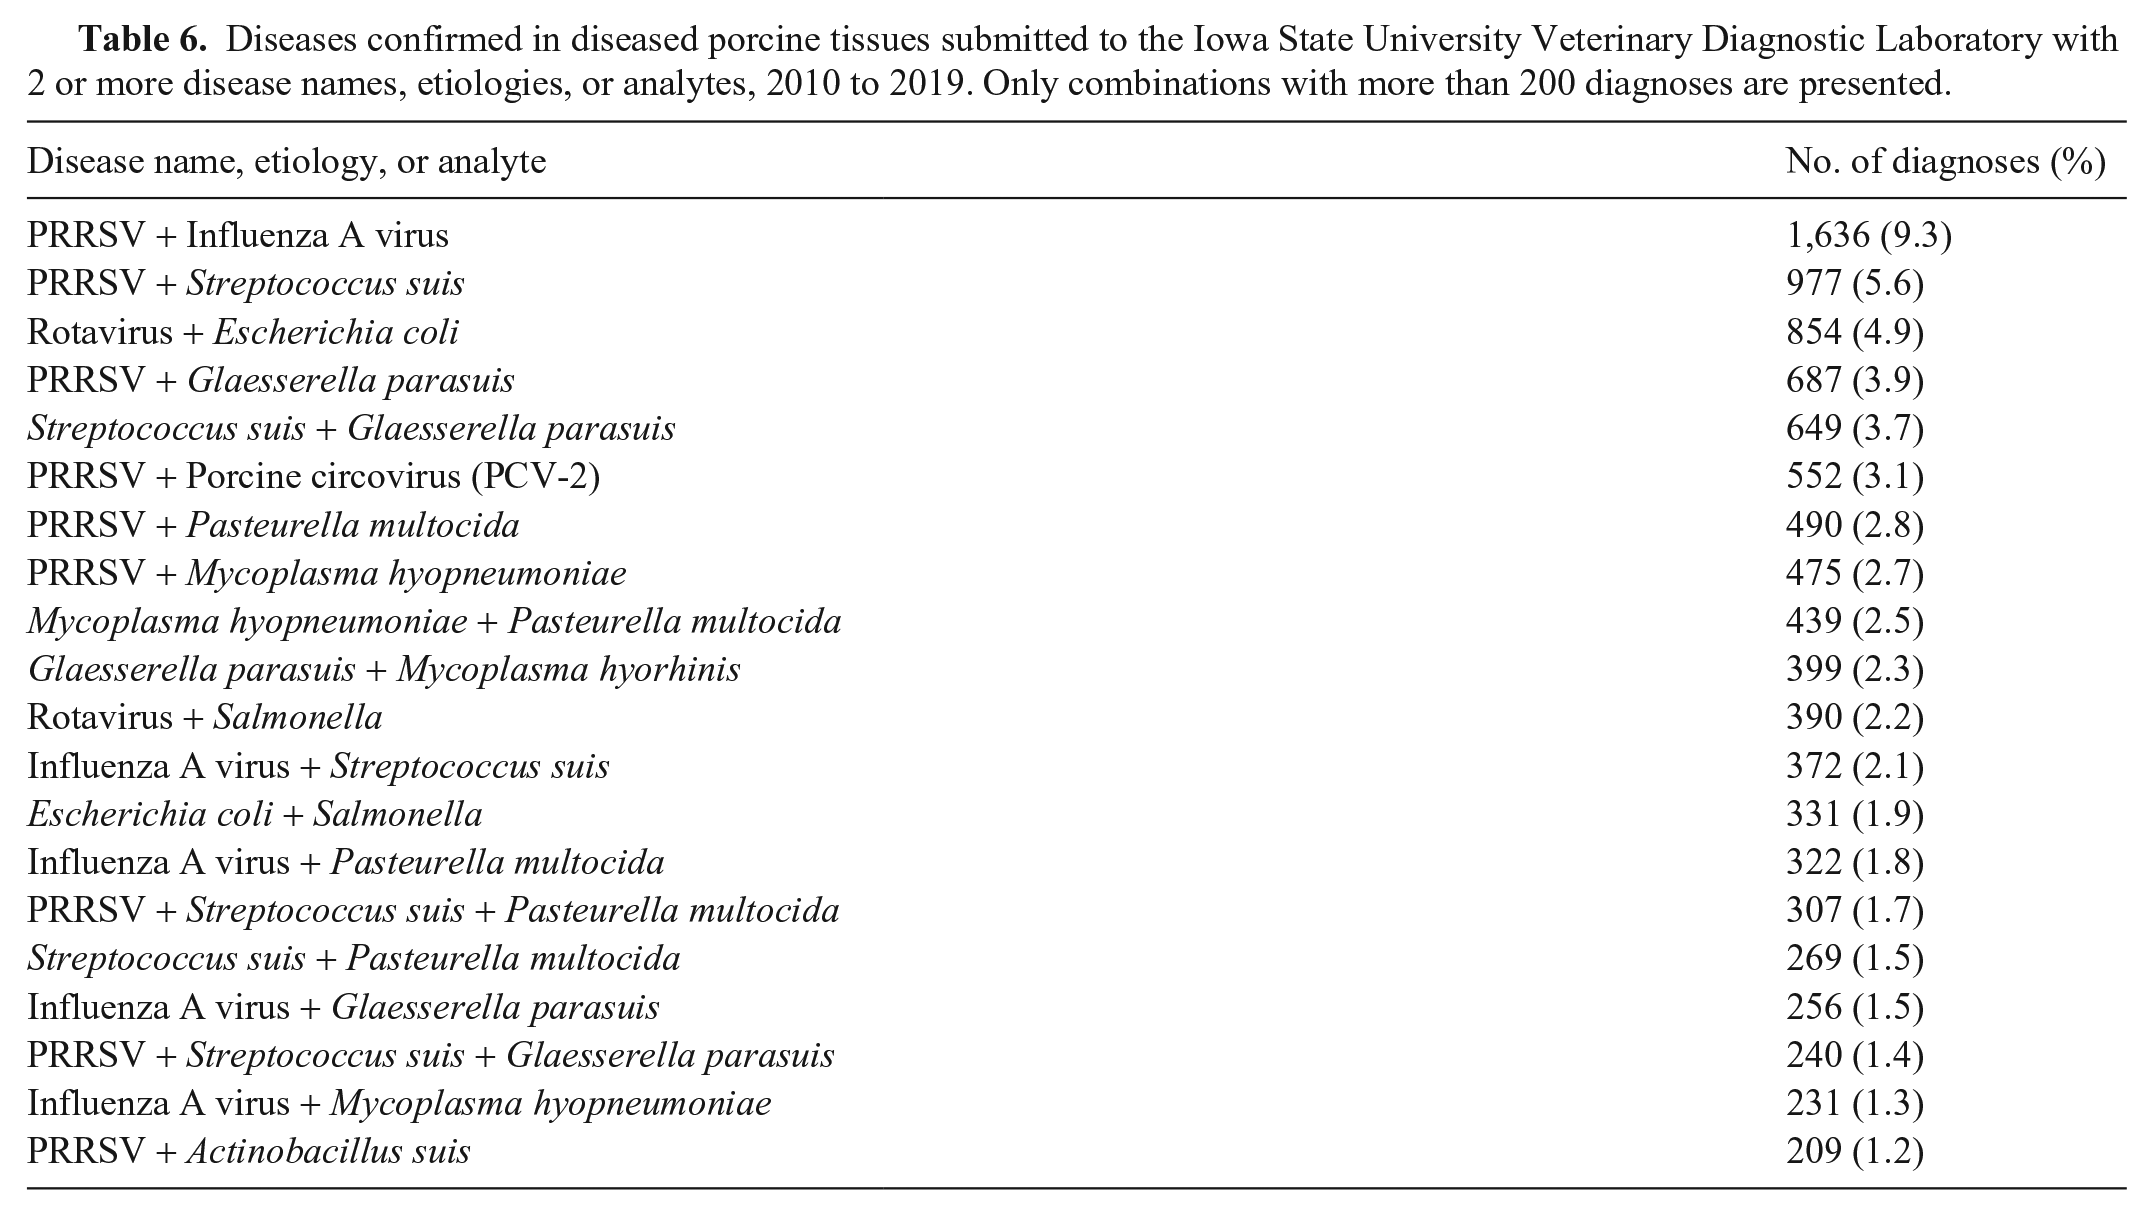
Co-diagnosis represented 18.4% (16,737 of 91,167) of the evaluated submissions (Table 6, Suppl. Fig. 2). A refinement of the Dx code process occurred during 2019 at the ISU-VDL, therefore abrupt changes in frequency or trends in Dx codes during this period may occur and may require modifications in interpretation.
Diseases confirmed in diseased porcine tissues submitted to the Iowa State University Veterinary Diagnostic Laboratory with 2 or more disease names, etiologies, or analytes, 2010 to 2019. Only combinations with more than 200 diagnoses are presented.
The visualization platform is useful, adding quick and meaningful insight into trends in disease diagnoses. An EARS C1 algorithm was successfully implemented to monitor statistically the weekly number of diagnoses by system and etiology. The respiratory signals pinpointed from August 24 to October 10, 2019, coincides with signals for increased etiologies (e.g., PRRSV, influenza A virus). For digestive diagnoses, 5 signals were identified during 2019; the signal for October 4 to 10 coincides with a signal for rotavirus. Given that Escherichia coli signals were farther from each other, we could not conclude that there were changes in the number of diagnoses for this agent during 2019 (Fig. 4).
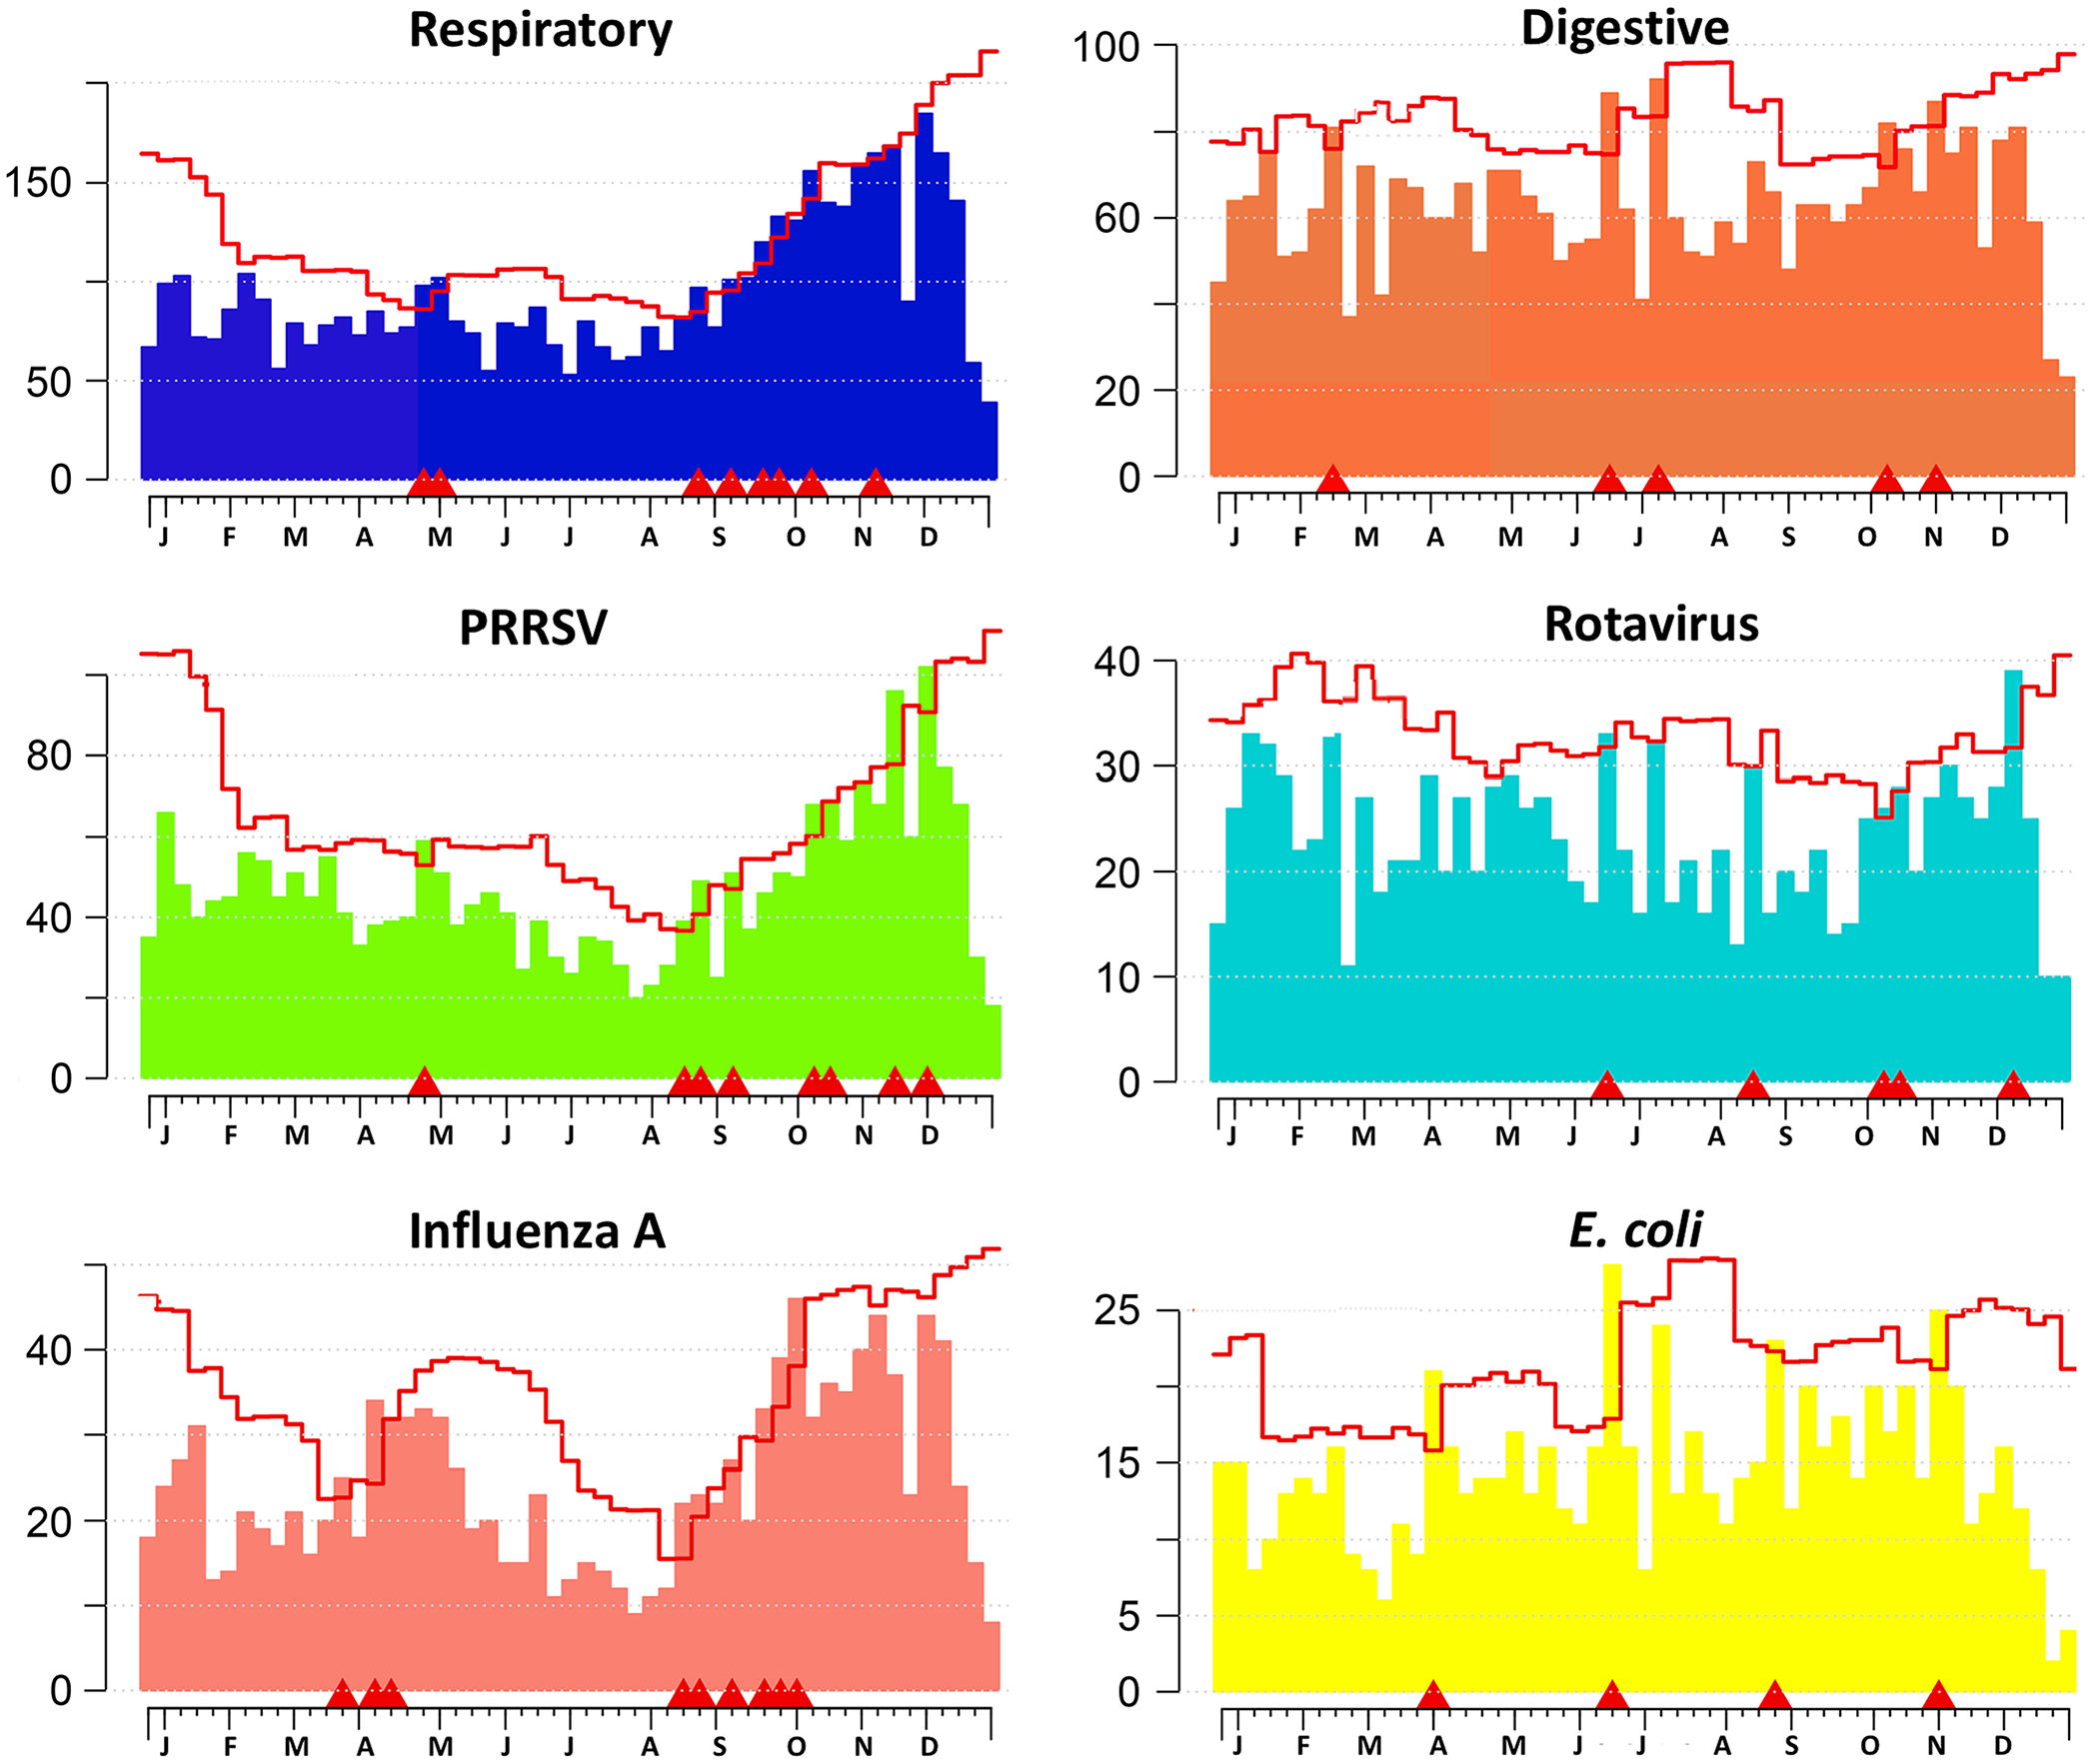
Weekly monitoring of diagnosis counts by system and identified etiology using the EARS C1 algorithm during 2019. Each chart represents a monitored system or etiology/disease. x-axis = week of the year. Letters represent the first letter of the month where the week had the first Monday for the month. y-axis = number of diagnoses or detections. Bars = weekly number of diagnoses. Line = upper threshold for the expected weekly number of diagnoses considering 3 SDs from the mean baseline formed from data from the previous 7 wk.
Discussion
Visualizing aggregated data can provide insight into the diagnostic process, motivate further investigations, and justify the development and support of researchable questions. The diagnostic data from porcine cases submitted to the ISU-VDL are used here as an example of disease diagnosis visualization and monitoring in populations, but the visualization tools and concepts have application across all species of animals and, potentially, across laboratories. Our specific objective was the development of a visualization tool capable of using aggregated data derived from an innovative Dx code system to visualize disease diagnosis trends and comorbidities over time. An additional step was taken to incorporate an automated algorithm to scan the database and spot weekly changes in the number of diagnoses by system and identified etiology/disease to guide the initiation of further exploration of the information.
In contrast to common reporting of analyte detection with a typical binary outcome (i.e., detected or not detected), Dx codes integrate all available evidence, including submission information, test results, and macroscopic and microscopic findings, to summarize the actual disease processes identified. Scripts for data wrangling were written, and collated data was connected to a visualization tool for improved ways to measure, analyze, and interpret the Dx code information in the context of allied demographic and geospatial data. Data visualization is valuable to different stakeholders in different ways. For example, the system allows for storage and recovery of data related to specific lesions and tissues, which is a feature that is particularly useful for diagnostic pathologists, teaching faculty, and researchers. Alternatively, data can be first filtered by body system affected and/or the insult type, which is particularly useful for clinicians managing production systems. Finally, the etiology/disease component of the Dx code, which reflects actual disease rather than colonization or mere detection, adds credibility and granularity to those tasked with proposing and implementing interventions for specific disease conditions. It also is an important resource for researchers and teachers.
Adaptations, improved accuracy of usage, and insights for the refinement of the Dx code system are expected for continuous improvement of the system. This tool is applicable across all species because allowed Dx codes are customized and/or filtered by animal species; the coding and visualization tools have the flexibility to be as general or granular as is warranted by stakeholders. ISU-VDL receives a large volume of submissions from swine production systems; hence, we developed a versatile visualization tool initially for porcine disease diagnosis, but it is applicable for other species. For example, the data visualization platform for poultry/avian accessions is currently in place, and the system can be used to visualize individual or companion animal disease trends as well.
A better understanding of the frequency of diagnoses as well as the various permutations of coinfections, and the order in which coinfections affect a group, flock, or herd, is desired to better manage disease agents present. In this illustration, 18.4% (16,737 of 91,167) of the submissions had more than one Dx code registered. This is a reminder that often more than one etiologic agent may affect a specified animal population simultaneously, and that causation of clinical disease or disease complexes is often multifactorial. Understanding the frequency of coinfection may aid understanding of ecology, interactions, and herd immunity of disease agents found in groups in a production system. Designing interventions and treatment strategies that target only one etiology, missing others, can lead to poor response or treatment failure. Further studies are needed to understand the occurrence and impact of coinfections with endemic agents in a herd. A promising next step already in progress is the generation of methods to link diagnostic data and production data, such as close-out information to assess production impacts of coinfections.
The Dx code is passively collected directly from the ISU-VDL database and summarized at a high level. Although these summaries generate informative insights, these data should not be interpreted as indicators of disease incidence or prevalence, nor as an actual reflection of relative frequency or economic impact of disease in the field. Sampling is not random at the state, farm, site, or pen level, and sample types and stage of disease vary considerably, with the size of the animal population at risk generally not available. However, the data summarized with these tools may guide further investigation of disease diagnoses in a region or production system. With appropriate confidentiality applied, client-specific analyses using visualization tools can be integrated with mapping platforms to manage large production systems.
The ability to automatically update, monitor, and detect changes in the frequency of veterinary diagnostic data can provide useful animal health information. 8 The incorporation of the EARS C1 algorithm allows a quick, timely, and efficient manner of scanning the database for changes in disease diagnoses. The algorithm quickly scans the database and generates a sequential number of plots signaling an increased number of weekly diagnoses, which is a process that requires a mere 2 min/wk for plot analysis. The monitoring tool can direct the attention of pathologists and research personnel to the system(s) or etiology(ies) having an increased number of diagnoses to initiate further investigation.
The current Dx code system has the flexibility to accommodate refinements or additions that allow capture and visualization of specific data of interest, including trends when monitoring for new, emerging, or zoonotic diseases or unique lesions of unknown cause. Recent examples of newly diagnosed porcine diseases at the ISU-VDL that were easily accommodated into the Dx code and visualization system include porcine epidemic diarrhea virus, 11 Brachyspira hampsonii, 15 porcine astrovirus 3, 1 porcine sapelovirus, 3 porcine circovirus 3, 2 and Streptococcus equi subsp. zooepidemicus. 10 The ability to internally validate Dx code alignment is possible. For example, respiratory and digestive systems represented 61.4% of the overall Dx code assignments; body system can be automatically implied or can have additional validation by confirming the presence of compatible lesion codes such as bronchopneumonia or enteritis, both of which are encountered commonly. This visualization tool model and Dx code system can be easily modified, customized, or expanded to incorporate information for disease diagnosis from other production animal species or to track companion animal disease diagnosis at an individual animal level. Connecting companion animal disease diagnosis with small animal hospital treatment outcomes could be useful to improve both the diagnosis and treatment options. Additionally, companion animal diagnosis could be useful in public health to surveil and monitor zoonotic diseases.
For this data visualization service, we used SAS and R for data preparation and monitoring and Power BI for data visualization. These 3 tools are just examples of a variety of tools, commercial or in-house developed, that are available for data processing, analysis, and visualization. Any tool selected should offer an output language that can be easily understood and reproduced by data analysts or by personnel who have an intermediate level of knowledge of data organization practices. In addition, visualization platforms should have an intuitive user-friendly interface, preferably using click-and-play buttons, to slice, view, interpret, and gain insights from the information. Pathologists and veterinarians possess advanced training and knowledge of the nature of diseases and the diagnostic process, yet should be able to gain additional valuable insights from the information if aggregated data are presented in a structured format through a visualization platform. Insights gleaned from data visualization can be used to refine and improve the diagnostic process and help to guide and monitor interventions for improved animal health.
Supplemental Material
sj-pdf-1-vdi-10.1177_1040638721995782 – Supplemental material for Visualization and application of disease diagnosis codes for population health management using porcine diseases as a model
Supplemental material, sj-pdf-1-vdi-10.1177_1040638721995782 for Visualization and application of disease diagnosis codes for population health management using porcine diseases as a model by Giovani Trevisan, Kent J. Schwartz, Eric R. Burrough, Bailey Arruda, Rachel J. Derscheid, Michael C. Rahe, Edison de Souza Magalhães, Marcelo N. Almeida, Rodger G. Main and Daniel C. L. Linhares in Journal of Veterinary Diagnostic Investigation
Footnotes
Acknowledgements
We thank VDL clients for submitting samples for testing.
Declaration of conflicting interests
The authors declared no potential conflicts of interest with respect to the research, authorship, and/or publication of this article.
Funding
Our project was co-funded by the Iowa Pork Producers Association award 18-192 to Rodger G. Main, by the Swine Health Information Center (SHIC) awards 17-210 and 19-155 SHIC, and by the USDA National Institute of Food and Agriculture Animal Health and Disease Research Capacity Funds project 1017372 to Daniel C. L. Linhares.
Availability of data and materials
Supplementary material
Supplementary material for this article is available online.
References
Supplementary Material
Please find the following supplemental material available below.
For Open Access articles published under a Creative Commons License, all supplemental material carries the same license as the article it is associated with.
For non-Open Access articles published, all supplemental material carries a non-exclusive license, and permission requests for re-use of supplemental material or any part of supplemental material shall be sent directly to the copyright owner as specified in the copyright notice associated with the article.