
Abstract
The management of diabetes mellitus mandates measurement of blood glucose. Saliva offers an alternative to blood sampling, but measurement of the salivary glucose concentration is difficult, and the blood-to-saliva glucose time lag is uncertain. We aimed to determine the serum–saliva glucose time lag in the saliva of healthy dogs. The combined duct of the mandibular and sublingual salivary glands of 6 dogs was cannulated to collect saliva and prevent glucose degradation by oral bacteria. Following a 0.25 g/kg IV bolus of dextrose, paired serum–saliva samples were collected at baseline and in twelve 5-min blocks over 60 min. Serum and salivary glucose levels were analyzed with a linear mixed model for repeated measures with a compound symmetry error structure. Mean (±SD) saliva production was 10.3 ± 2.9 µL/kg/min, and the area under the curve (AUCglucose)saliva/serum ratio was 0.006, which highlights the magnitude of the large difference in glucose concentration between the 2 compartments. The serum–saliva glucose time lag was 30–40 min.
Diabetes mellitus is a common endocrinopathy of dogs. 5 Diagnosing and managing the diabetic patient sometimes requires repeated sampling of blood to determine blood glucose concentrations. Saliva is a readily accessible matrix in which glucose could be measured noninvasively. Studies in healthy and diabetic people found high correlations between salivary and blood glucose when paired samples were taken at the fasted and postprandial phases, and at random. 7 However, knowing the serum–saliva glucose time lag is crucial following abrupt changes in glucose levels, for example in diabetic ketoacidosis. The inherently low concentrations of glucose in saliva and its lability caused by oral glucose-degrading bacterial enzymes 11 complicate the assessment of glucose in archived saliva samples. We aimed to determine the serum–saliva glucose time lag in healthy dogs following an abrupt increase in blood glucose using a sensitive glucose assay and an acquisition technique that mitigated the effect of oral bacteria on salivary glucose. We anticipated that the serum–saliva glucose time lag would be ~30 min,2,9 and that serum and salivary glucose would be correlated, 2 similar to findings in people and dogs.
The Institutional Animal Care and Use Committee at the University of Illinois approved our study (protocol 19233). After providing informed consent, 6 healthy staff or student-owned dogs were enrolled in the study, and included 3 castrated males, 2 spayed females, and 1 intact female with mean (±SD) ages of 5.8 ± 1.9 y and bodyweights of 24.2 ± 10.3 kg. The dogs included 1 Poodle, 1 Beagle, 1 German Shepherd, 1 Golden Retriever, and 2 mixed-breed dogs. Dogs were deemed healthy based on history, physical examination, complete blood count, serum biochemistry profile, and urinalysis. After an overnight fast of ~16 h, dogs were premedicated with hydromorphone (0.1 mg/kg IM), sedated with ketamine (5 mg/kg) and midazolam (0.25 mg/kg IV), and maintained on constant rate infusions of ketamine (5–10 mg/kg/h) and midazolam (0.25–0.5 mg/kg/h) titrated to maintain adequate sedation. This specific combination of drugs was selected to minimize xerostomia.
The combined duct of the mandibular and sublingual salivary glands was cannulated with a 22–24G intravenous catheter using DeBakey forceps and 3.5× surgical loupes to provide magnification and aid visualization. The catheters were secured to the sublingual tissue with a single encircling suture of 4-0 poliglecaprone-25. A 7Fr × 60 cm dual lumen indwelling IV catheter (MILA International) was placed in the lateral saphenous vein. To augment saliva production, the rostrodorsal surface of the tongue was wetted with 5 drops of freshly squeezed lemon juice at the beginning of each 5-min block. Following a bolus of dextrose (0.25 g/kg IV) given over 30 s, paired serum–saliva samples were taken at baseline and in 5-min blocks over 60 min. Blood samples were placed into serum tubes (BD Vacutainer), allowed to clot over 10 min at room temperature, then kept on ice until centrifuged. Saliva samples were collected into ice-chilled Eppendorf tubes (Thermo Fisher) and kept on ice until centrifuged. Serum was harvested following centrifugation of blood samples at 1,000 × g for 10 min, transferred immediately into cryovials (Thermo Fisher), and stored at –80°C. The aqueous part of the saliva was harvested following centrifugation at 10,000 × g for 1 min, transferred immediately into cryovials, and stored at –80°C. At the end of the study (10 and 2 d from collection of samples from the first and last dog, respectively), the blood and saliva samples were thawed on ice at the same time and the volume of each saliva sample was measured.
Serum glucose was assayed with a hexokinase-based glucose colorimetric assay (AU680 analyzer, Beckman Coulter; intra-assay CV of 0.4% and inter-assay CV of 0.5%). Salivary glucose was assayed with a glucose oxidase–based glucose colorimetric assay (EIAGLUC; Invitrogen). Absorbance was read at 560 nm (SpectraMax iD3; Molecular Devices). For assay validation, 1,000 µL of 3.552 mmol/L D-glucose stock solution (6.4 mg D-glucose [DX0145-1]; MilliporeSigma) in 10 mL of 0.9% saline (B Braun Medical) was mixed with an equal volume of pooled canine saliva to 1.776 mmol/L, and serially diluted in saline to 0.888, 0.444, 0.222, 0.111, 0.056, 0.028, 0.014, 0.007, 0.003, and 0 mmol/L. The standard curve was fitted by a third-order polynomial equation (adjusted R2 = 0.99) with Prism v.9.0.2 for Mac (GraphPad). All samples were assayed in duplicate, and the observed versus expected salivary glucose concentrations were graphed to assess the linear range of the assay.
Intra-assay CV was calculated from 10 replicates of a single sample (0.222 mmol/L) in a single assay run. Inter-assay CVs were calculated by evaluating duplicates from aliquots of 3 salivary samples with high (1.776 mmol/L), moderate (0.444 mmol/L), and low (0.111 mmol/L) glucose concentrations on 5 different days. The lowest dilution of salivary glucose that could be distinguished from the mean + 2SD of 10 replicate measurements of a blank was considered the lower limit of detection. Recovery was calculated by dividing the observed by the expected salivary glucose values.
Statistical analyses of the dependent variables, serum glucose, salivary glucose, and saliva volume were performed with a statistical package (v.9.4; SAS Institute). Data were assessed for normal distribution, and the normally distributed data were described by mean and SD. Analyses of variance of the dependent variables were analyzed with the MIXED procedure using a linear mixed model for repeated measures. The model included the fixed effect of time, and as covariates, the linear effect of saliva volume and the linear and quadratic effect of storage duration. Repeated measures on the same dog were modeled with a compound symmetry error structure to account for heterogeneous variance over time. The least-squares means (LSM) and standard errors (SE) of the dependent variables were estimated for each 5-min block over the 60-min duration of the experiment. Effects of time on the means of dependent variables were analyzed by the Fisher least significant difference test with Dunnett post-hoc correction as implemented in the LSMEANS option to compare the means with the mean at time zero. Fifth-order polynomial trendlines best fit the regression of salivary and serum glucose means on time and were used to estimate the serum–saliva glucose time lag. The CORR procedure was used to obtain the Pearson correlation coefficients between different combinations of serum and salivary glucose over time. The AUC for serum and salivary glucose were calculated with Prism v.9. The significance level for all analyses was ≤0.05.
The salivary glucose assay was linear (0.028–0.888 mmol/L; R2 = 0.991; p < 0.001; Fig. 1). Intra-assay CV based on 10 replicates was 4%. Inter-assay CVs were 26% (1.776 mmol/L), 14% (0.444 mmol/L), and 21% (0.111 mmol/L). Recovery within the linear range was 0.78–1.29. The lowest dilution of salivary glucose that could be distinguished from 0 mmol/L was 0.007 mmol/L.
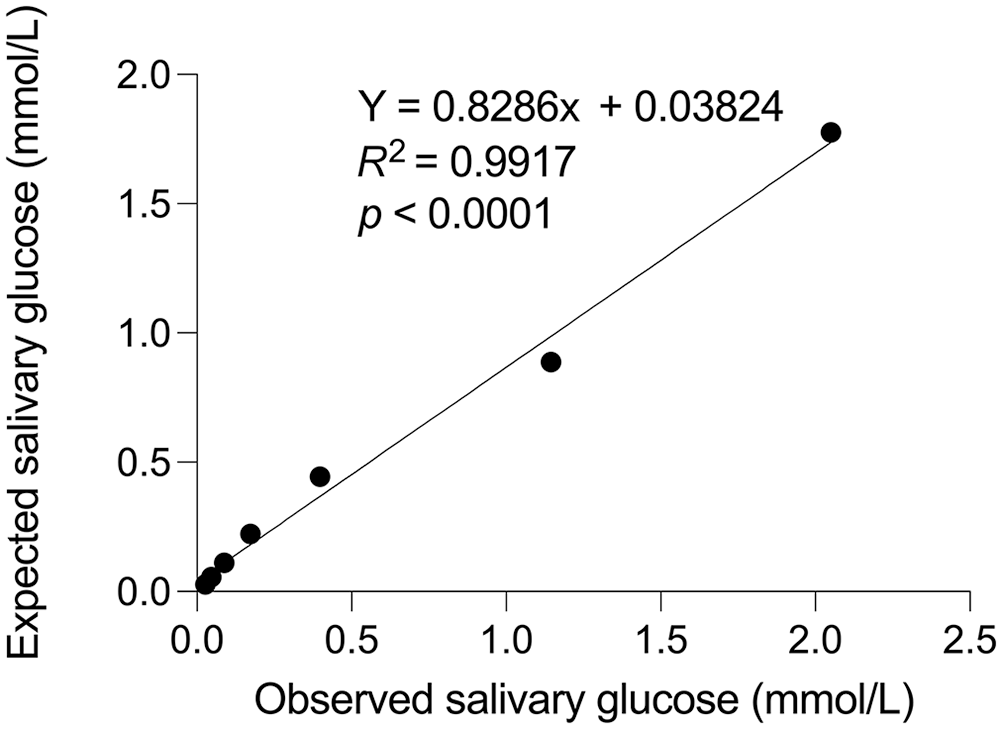
Salivary glucose assay validation. Results of serial dilutions of spiked pooled canine saliva were fitted by a third-order polynomial equation to assess the linear range of the assay.
The mean (±SD) saliva production was 10.3 ± 2.9 µL/kg/min (CV = 28.5%); salivary glucose increased by 16.7 ± 5.6 nmol/L for every 1 µL increase in saliva volume (p = 0.012). The AUC of serum and salivary glucose were 572 mmol/L/h and 3.4 mmol/L/h, respectively, and the (AUCglucose)saliva/serum ratio was 0.006, highlighting the magnitude of the large difference in glucose concentration between the 2 compartments. The storage duration at –80°C had a significant linear and quadratic effect on salivary glucose (p = 0.003); this means that the rate of reduction in salivary glucose concentration diminished over time. The storage duration also significantly reduced serum glucose in a linear manner (p = 0.008). Serum glucose peaked 5 min post-dextrose bolus and did not significantly differ from baseline level between 45–60 min (p > 0.05; Fig. 2). Salivary glucose peaked 30–40 min post-dextrose bolus and did not differ from baseline levels at any time (p > 0.05). The blood–saliva glucose time lag, determined from the fifth-order polynomial trendlines, was 30–40 min. A high correlation was present between serum glucose at 20 min and salivary glucose at 50 min (r = 0.95, p = 0.047). High correlations were also present between serum glucose at 20 min and salivary glucose at 45 min (r = 0.82) and 55 min (r = 0.85); however, these were not statistically significant (p = 0.09 and p = 0.066, respectively), likely because of the small sample size.
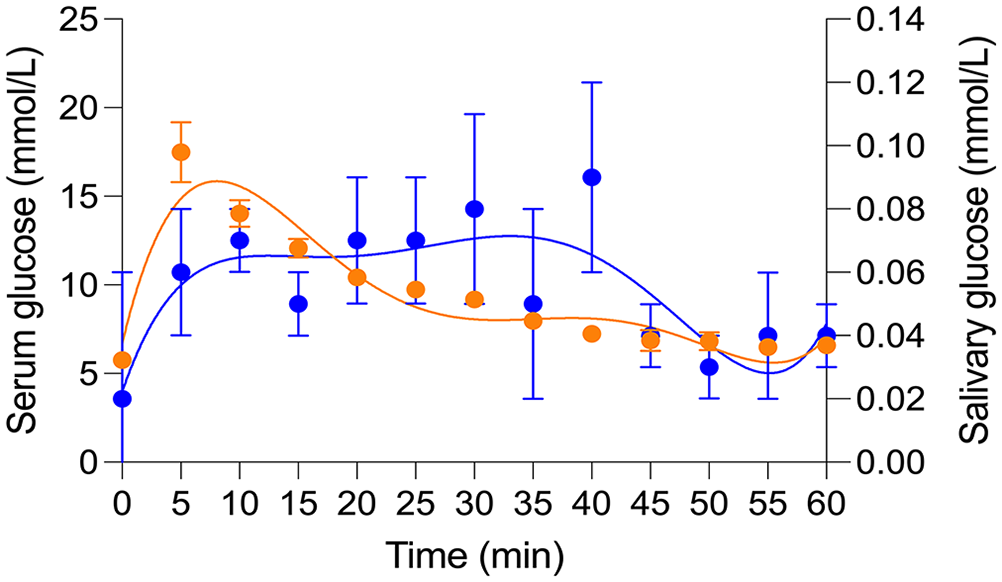
Kinetics of serum and saliva glucose levels following an intravenous bolus of dextrose (0.25 g/kg IV) in 6 dogs. Data are presented as least-squares mean (±SE) derived from a linear mixed model for repeated measures. Blue dots = salivary glucose; blue line = fifth-order polynomial trendline fitting the regression of salivary glucose; orange dots = serum glucose; orange line = fifth-order polynomial trendline fitting the regression of serum glucose.
In dogs, blood glucose passively diffuses into the saliva across the intralobular ductular epithelium. 8 However, in diabetic people, pathologic changes to the microvasculature of salivary glands may be an additional source of glucose leakage from the blood. 10 We propose that the pattern of glucose kinetics in the saliva could be explained by a delay in glucose distribution between blood and saliva, a slow rate of glucose transfer into saliva compared to the rate of elimination from the blood, or as a result of a low glucose elimination rate from the saliva. Also, when observing the trendlines in Figure 2, a blood–saliva glucose time lag of 30–40 min can be estimated from the corresponding patterns of change in salivary and serum glucose. A similar blood–saliva glucose time lag has been reported in dogs 9 and humans. 2 The times of high correlation between salivary and serum glucose levels (i.e., serum T20 and salivary T45-T55) corresponded to the above serum–salivary glucose time lag. We contend that the small sample size and high variability in salivary glucose levels within and between dogs are likely the reason for the absence of significant differences in salivary glucose between the study sampling times. Despite a lack of statistical significance, changes in salivary glucose levels are unlikely to be random because of 1) the corresponding trendline patterns of serum and salivary glucose; 2) the serum–salivary glucose time lag, which is similar to that reported previously; and 3) the serum–salivary glucose time lag that corresponds to the points of high correlation between serum and salivary glucose.
The dogs in our study produced saliva at a low rate (10.3 ± 2.9 µL/kg/min) despite the stimulation of saliva production with lemon juice and a sedative protocol with a limited effect on saliva production. Only a few reports have quantified saliva volume in dogs; these studies vary in their designs with respect to methods of saliva stimulation, collection, and whether anesthesia was induced. These factors have a profound effect on saliva volume. For example, maximal saliva stimulation by citric acid in conscious dogs was ~2.2 mL/kg/min, 4 whereas, saliva production in electrically versus bethanechol-stimulated anesthetized dogs were 69–180 µL/kg/min and 11–110 µL/kg/min, respectively. 12 The stimulation of saliva production in dogs increases salivary glucose levels. 8 Although we also found that salivary glucose levels increased as salivary volume increased, this effect had only a negligible clinical diagnostic impact on saliva glucose concentration (0.0167 ± 0.0056 µmol/L for every 1 µL increase in saliva volume). Nevertheless, it is unknown whether higher rates of saliva production will result in a diagnostically significant elevation in salivary glucose levels.
When accounting in the mixed-effect statistical model for the effect of “storage duration” on serum and salivary glucose levels, we found that storage affected both levels. A storage-mediated lowering effect as early as 24 h, with up to 10% decrease from initial plasma glucose concentration, was reported previously.1,6 In contrast, other studies demonstrated that glucose was stable for at least 3 mo at –80°C.3,13 Our study was not designed to assess the effect of storage, and we suggest considering the questionable stability of glucose during storage at –80°C when designing future studies that would entail measurements of glucose from archived frozen serum or saliva samples.
Several reasons could explain why some of the results between our study and a previous study with a similar design differed. 9 These include 1) differences between the salivary glucose assays; 2) differences in the source of salivary glucose 14 (mandibular and sublingual salivary glands vs. predominantly the parotid salivary gland in the previous study); 3) method of collection (directly from the salivary duct avoiding contamination by glucose-degrading bacterial products vs. from the oral cavity via sponges in the previous study); 4) differences in glucose bolus administered intravenously (0.25 mg/kg vs. 0.5 mg/kg in the previous study); and 5) analyses of the correlation between any blood–salivary times versus paired blood–salivary times.
From our preliminary study, we suggest that the blood–saliva time lag for glucose in healthy euglycemic dogs is 30–40 min and that this is the timeframe that serum and salivary glucose correlate well after an abrupt change in serum glucose. Despite saliva being an attractive matrix for noninvasive glucose quantification, glucose measurements in saliva pose challenges that necessitate development of sensitive glucose measurement methodologies to account for very low salivary glucose concentrations that cannot be assessed by portable glucometers and routine laboratory biochemical analyzers. This would require the development and validation of mathematical algorithms that would predict blood glucose levels based on the intrinsically low salivary glucose. An additional challenge is to overcome the issue of salivary glucose stability secondary to rapid degradation by oral bacterial enzymes. 11 Such real-time, patient bedside, portable, solid-phase chemical colorimetric or electrical-based methodologies for the measurement of salivary glucose would also need to overcome the effect of salivary viscosity (i.e., the mucous fraction of saliva) on the analytical methodology because centrifugation of saliva would not be possible. The effects of storage on serum and salivary glucose levels warrant further investigation. The utility of salivary glucose in monitoring glucose in diabetic patients remains to be determined.
Footnotes
Declaration of conflicting interests
The authors declared no potential conflicts of interest with respect to the research, authorship, and/or publication of this article.
Funding
Our study was funded by the Wayne and Josephine Spangler Fund at the University of Illinois at Urbana-Champaign.