
Abstract
We compared measurements of blood glucose concentrations in 30 healthy adult White New Zealand rabbits using 2 commercial portable glucometers (PGM1 and PGM2) and a laboratory chemical analyzer. Results were analyzed with Pearson correlation, Passing–Bablok regression analysis, Bland–Altman analysis, and a modified error grid. Measurements with PGM1 were significantly correlated (r = 0.37) with those obtained from the laboratory reference method (RM); Bland–Altman and Passing–Bablok analyses indicated no significant systematic or proportional differences (mean difference of −0.26, 95% CI of mean difference of −0.54 to 0.01, and LOA of −1.70 to 1.17); and error grid resulted in 100% of measurements in zone A. No significant correlation (r = −0.05) was detected between PGM2 and RM; Bland–Altman and Passing–Bablok analyses results indicated a mean difference of 2.14, 95% CI of mean difference of 1.67–2.60, and limit of agreement of −0.32 to 4.59, which overestimated blood glucose concentration, with 53% of glucose measurements in error grid zone A and 47% in zone B. PGM1 was considered accurate in normoglycemic rabbits, whereas the use of PGM2 could result in overestimations of glycemia.
Blood glucose measurements can be used as prognostic factors for rabbits, especially in critical states, for example in cases of severe hyperglycemia observed in rabbits with gastrointestinal obstruction and enterotoxemia. A poor prognosis is associated with blood glucose values >20 mmol/L in rabbits. 10 In addition, hypoglycemia has been observed in rabbits with sepsis or anorexia. 10
Portable glucometers (PGMs) are used extensively for the monitoring of diabetes mellitus in human patients, including neonates and pregnant women.1,13,15 Several studies have shown the effectiveness of different PGMs for small animals.4,8,18 Identification of cases of hypoglycemia (caused by sepsis, insulinomas, hypoadrenocorticism, liver failure, among other factors)4,18 and hyperglycemia (caused by diabetes mellitus, hyperadrenocorticism, stress, among other factors)4,8 using a PGM is essential for prompt assessment of the health status and prognosis of the patient. PGMs are accessible, fast, and practical, and thus are good options for routine use given that results are immediate and require only small blood samples, which increases efficiency and reduces the potential harm of collecting multiple samples over short time intervals. 9
Verifying the effectiveness of human PGMs for veterinary patients is essential because previous studies have reported variations in results among different PGMs, leading to recommendations against the use of some PGMs for veterinary use.5,11 However, little research has focused on testing PGMs specifically in rabbits.16,17 One study showed that a portable clinical analyzer underestimated blood value concentrations of rabbits, rendering this PGM unsuitable for rabbit blood glucose measurements. 17 A second study, in which the relative effectiveness of a human and 2 animal PGMs were compared, suggested that the portable animal glucometers were not reliable for analyzing rabbit blood glucose levels whereas the human PGM provided accurate measurements. 16 An additional complication to such assays is that reference intervals (RIs) for blood glucose concentration in rabbits vary among studies, especially for maximum blood glucose levels; for example, values were 4.2–7.8 mmol/L 19 in one study and 4.2–8.3 mmol/L in another. 7 Research involving comparisons between different species is also important, in light of the results of a study showing that one PGM was found to be clinically acceptable for cats 11 but not for rabbits. 16
Because various PGMs are available, we measured blood glucose concentrations in healthy adult White New Zealand rabbits with 2 commercial human PGMs commonly used in veterinary clinics in Brazil and compared these results to those from a reference laboratory chemistry analyzer. Our study was approved by the Animal Use Committee of Pontifícia Universidade Católica do Paraná (PUCPR). Experiments were conducted in the rabbitry of the University experimental farm in Fazenda Rio Grande, Paraná, Brazil, in June and July of 2019.
We used 30 adult White New Zealand rabbits (12 males, 18 females), considered healthy based on anamnesis and physical examination by a veterinarian. The rabbits were given free access to commercial feed, hay, and water, and were housed individually in suspended wire cages with automatic water dispensers, manual feeders, and hay racks. The mean weight of all rabbits was 5.2 ± 0.4 kg (range: 4.3–6.5 kg); the mean weight of does was 5.3 ± 0.4 kg (range: 4.9–6.5 kg) and the mean weight of bucks was 5.0 ± 0.4 kg (range: 4.3–5.5 kg). The mean age of all rabbits was 16 ± 8 mo (range: 8–48 mo).
Lidocaine cream (4%; Dermomax; Aché Laboratórios Farmacêuticos) was applied to a 0.5 cm area around the site of venipuncture 30 min prior to blood collection. Whole blood was obtained by lateral auricular venipuncture using a sterile 23- or 24-ga needle and a 1-mL heparinized syringe; blood was then placed into a 0.5-mL sodium fluoride tube (Labor Import). Following each blood draw, 0.1 mL of blood from the heparinized syringe was placed on test strips set within each PGM. Sodium fluoride tubes containing blood samples were then stored in a Styrofoam box with a reusable ice pack for use in laboratory analyses within 3 h of blood collection. Plasma was acquired via centrifugation (3,000 × g, 5 min), then submitted for colorimetric method endpoint analysis via glucose oxidase reaction using a laboratory chemical analyzer (Labmax Plenno; Labtest). The laboratory chemical analyzer was considered the reference method (RM), and RM results were compared with PGM results. All procedures were performed in accordance with the manufacturer’s instructions. Two of the authors conducted the PGM trials, and trained technicians performed the RM measurements.
We used 2 different types of PGMs in our study: PGM1 (Accu-Chek Active; Roche Diabetes Care) and PGM2 (G-Tech Lite; Infopia). These PGMs were specifically chosen because they are commonly used in Brazil for measuring human blood glucose concentrations, and because they differ in price and design. Both PGMs carry out measurements using the enzyme glucose dehydrogenase. The detection method of PGM1 is based on reflectance photometry via the pyrroloquinoline quinone–glucose dehydrogenase reaction, whereas that of PGM2 is based on amperometry via the flavin adenine dinucleotide–glucose dehydrogenase reaction. The PGM instructions specify that, for humans, the minimum blood volume for PGM1 is 1 µL, and the test range is 0.6–33.3 mmol/L; the minimum blood volume for PGM2 is 0.5 µL, with a test range of 1.1–33.3 mmol/L. Both detect blood glucose concentrations in molarity, with blood glucose measurements reported as plasma equivalent values. In our study, 1 blood sample from each rabbit was used in each of the 2 PGMs, with values then compared to those generated by the RM. Operation of both PGMs was performed under similar environmental temperature and humidity conditions and in accordance with the manufacturer’s instructions.
Normality of data was tested using the D’Agostino–Pearson normality analysis. Pearson correlation coefficients (r) were calculated between the results obtained using the PGMs and the RM. Finally, Bland–Altman plots and Passing–Bablok regression were used to test the accuracy of the values generated by the PGMs. The Bland–Altman plot was used to assess differences between results obtained with PGMs and the RM, 2 with differences of ≤20% between the means of results obtained with each PGM and the RM considered acceptable. 11 PGM concentration values were considered accurate if 95% of PGM measurements satisfied this criterion.
Because PGMs had r < 0.99, Passing–Bablok regressions were used to determine constant and proportional differences between concentrations measured by the PGMs and the RM. 14 A scatter plot, slope (95% CI), intercept (95% CI), and residual plot were calculated. Range of intercepts corresponding to the 95% CI intercept that include zero indicate no systematic differences between the 2 methods. Range slopes for the 95% CI that include 1 indicate no proportional differences between the 2 methods. Finally, if the tested method has no systematic and proportional bias, it can be assumed that x = y and that both methods can be used interchangeably.
A modified version of the Clarke error grid analysis described in a previous study on rabbits was performed to assess the clinical relevance of errors between measurements using the PGMs and the RM. 16 The grid system compares glucose concentrations measured by PGMs to those measured by the RM and classifies them into 4 zones (A–D). Zone A comprises values that produce clinically accurate measurements, and include PGM blood glucose concentrations that deviate from the RM-derived value by <20%, or cases in which both PGM- and RM-derived measurements were in the RI of 4.2–8.3 mmol/L. 7 Zone B includes samples for which measurements by PGMs yielded glucose concentrations out of the RI but for which RM-derived concentrations were within the 4.2–8.3 mmol/L RI. Zone C includes samples for which both RM and PGM measurements yield values out of the RI. Zone D includes PGM and RM measurements that suggest contrary treatment decisions and yield opposing states of hyperglycemia and hypoglycemia (or vice versa). Measurements produced by a PGM were considered clinically acceptable if ≥95% of measurements appeared in Zone A. Microsoft Excel 2010 and MedCalc v.19.0.5 were used to perform statistical analyses.
All blood glucose concentrations measured using the RM fell within the RI (4.2–8.3 mmol/L 7 ; Table 1). Data were found to be normally distributed. Pearson correlation analysis produced r values of 0.37 (p = 0.0428) for PGM1 and −0.05 (p = 0.7955) for PGM2. Passing–Bablok linear regression analysis comparing PGM1 and PGM2 with RM determined no systematic or proportional differences between PGM1 and the RM (Table 2) and yielded a slope of 1.25 (95% CI: 0.7–2.0) and an intercept of −1.80 (95% CI: −6.3 to 1.6), whereas PGM2 exhibited a proportional bias, a slope of 3.43 (95% CI: 1.2–17.5), and an intercept of −12.57 (95% CI: −96.5 to 0.9). PGM1 measurements slightly underestimated blood glucose concentrations of the rabbits, whereas PGM2 measurements overestimated blood glucose concentrations (Fig. 1). Differences in glucose estimation between the PGMs and traditional laboratory methods have been reported previously in other species. 5
Blood glucose concentrations (mmol/L) of 30 healthy White New Zealand rabbits measured using the reference method, portable glucometer 1, and portable glucometer 2.
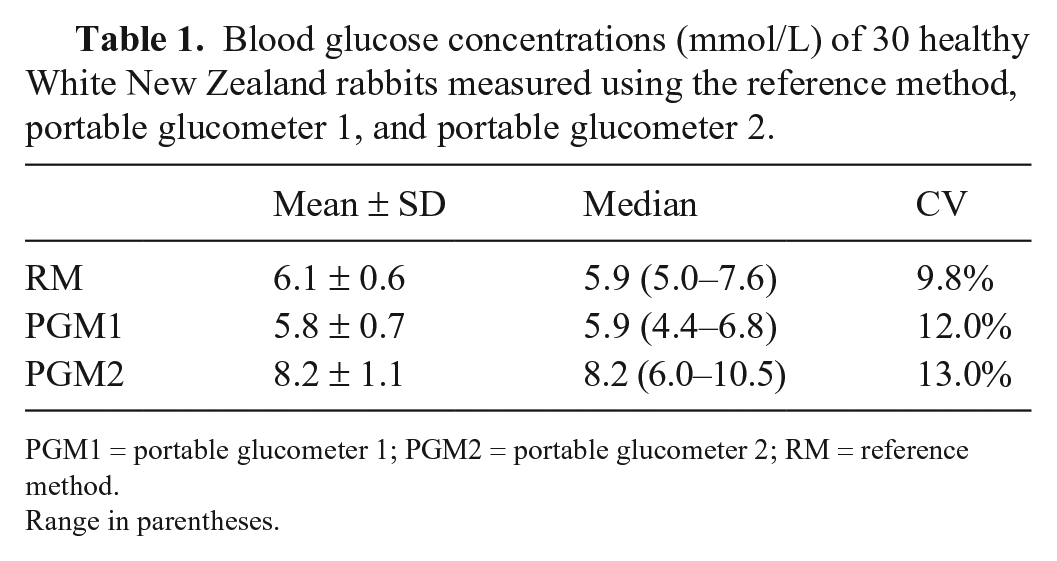
PGM1 = portable glucometer 1; PGM2 = portable glucometer 2; RM = reference method.
Range in parentheses.
Results of Bland–Altman and Passing–Bablok analyses of accuracy of human portable glucometers in blood samples from healthy White New Zealand rabbits.
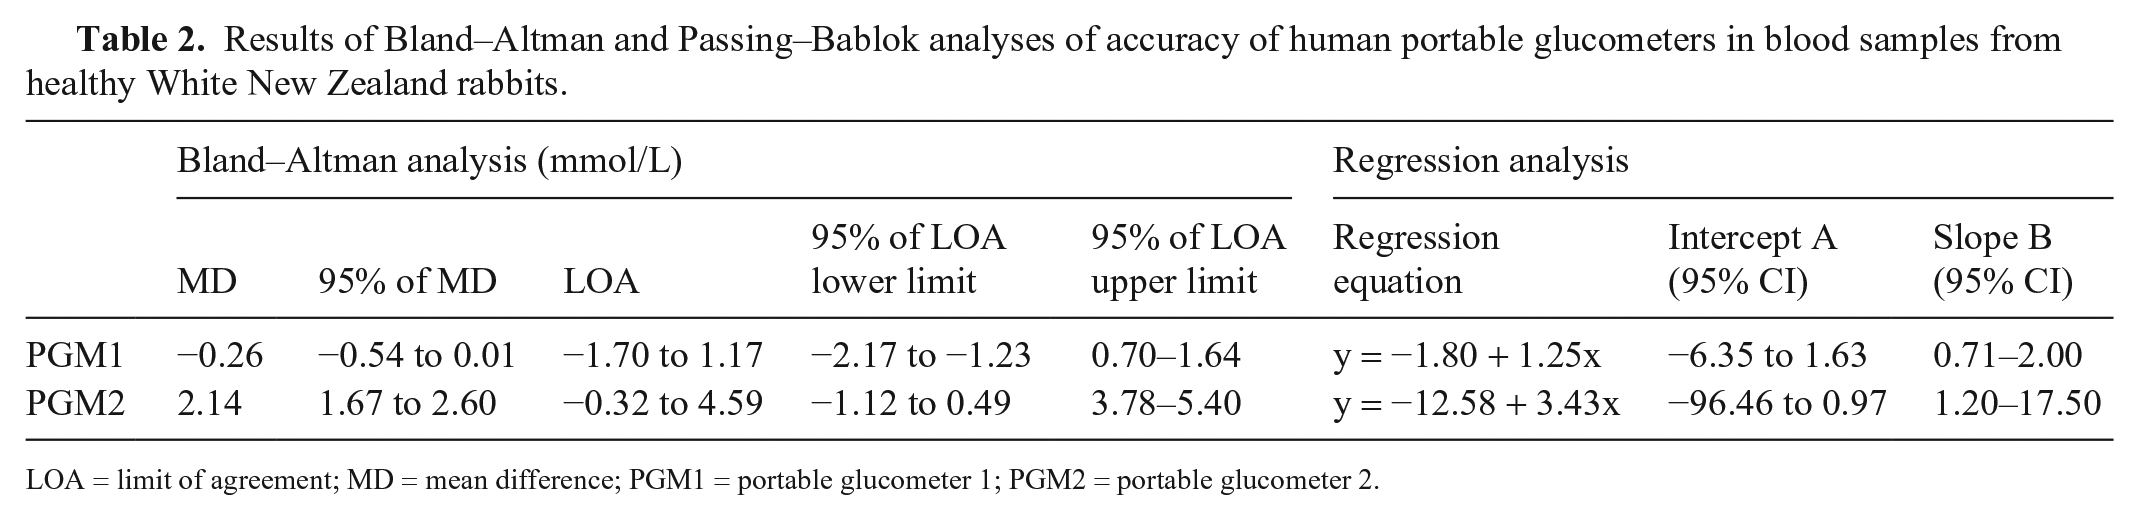
LOA = limit of agreement; MD = mean difference; PGM1 = portable glucometer 1; PGM2 = portable glucometer 2.
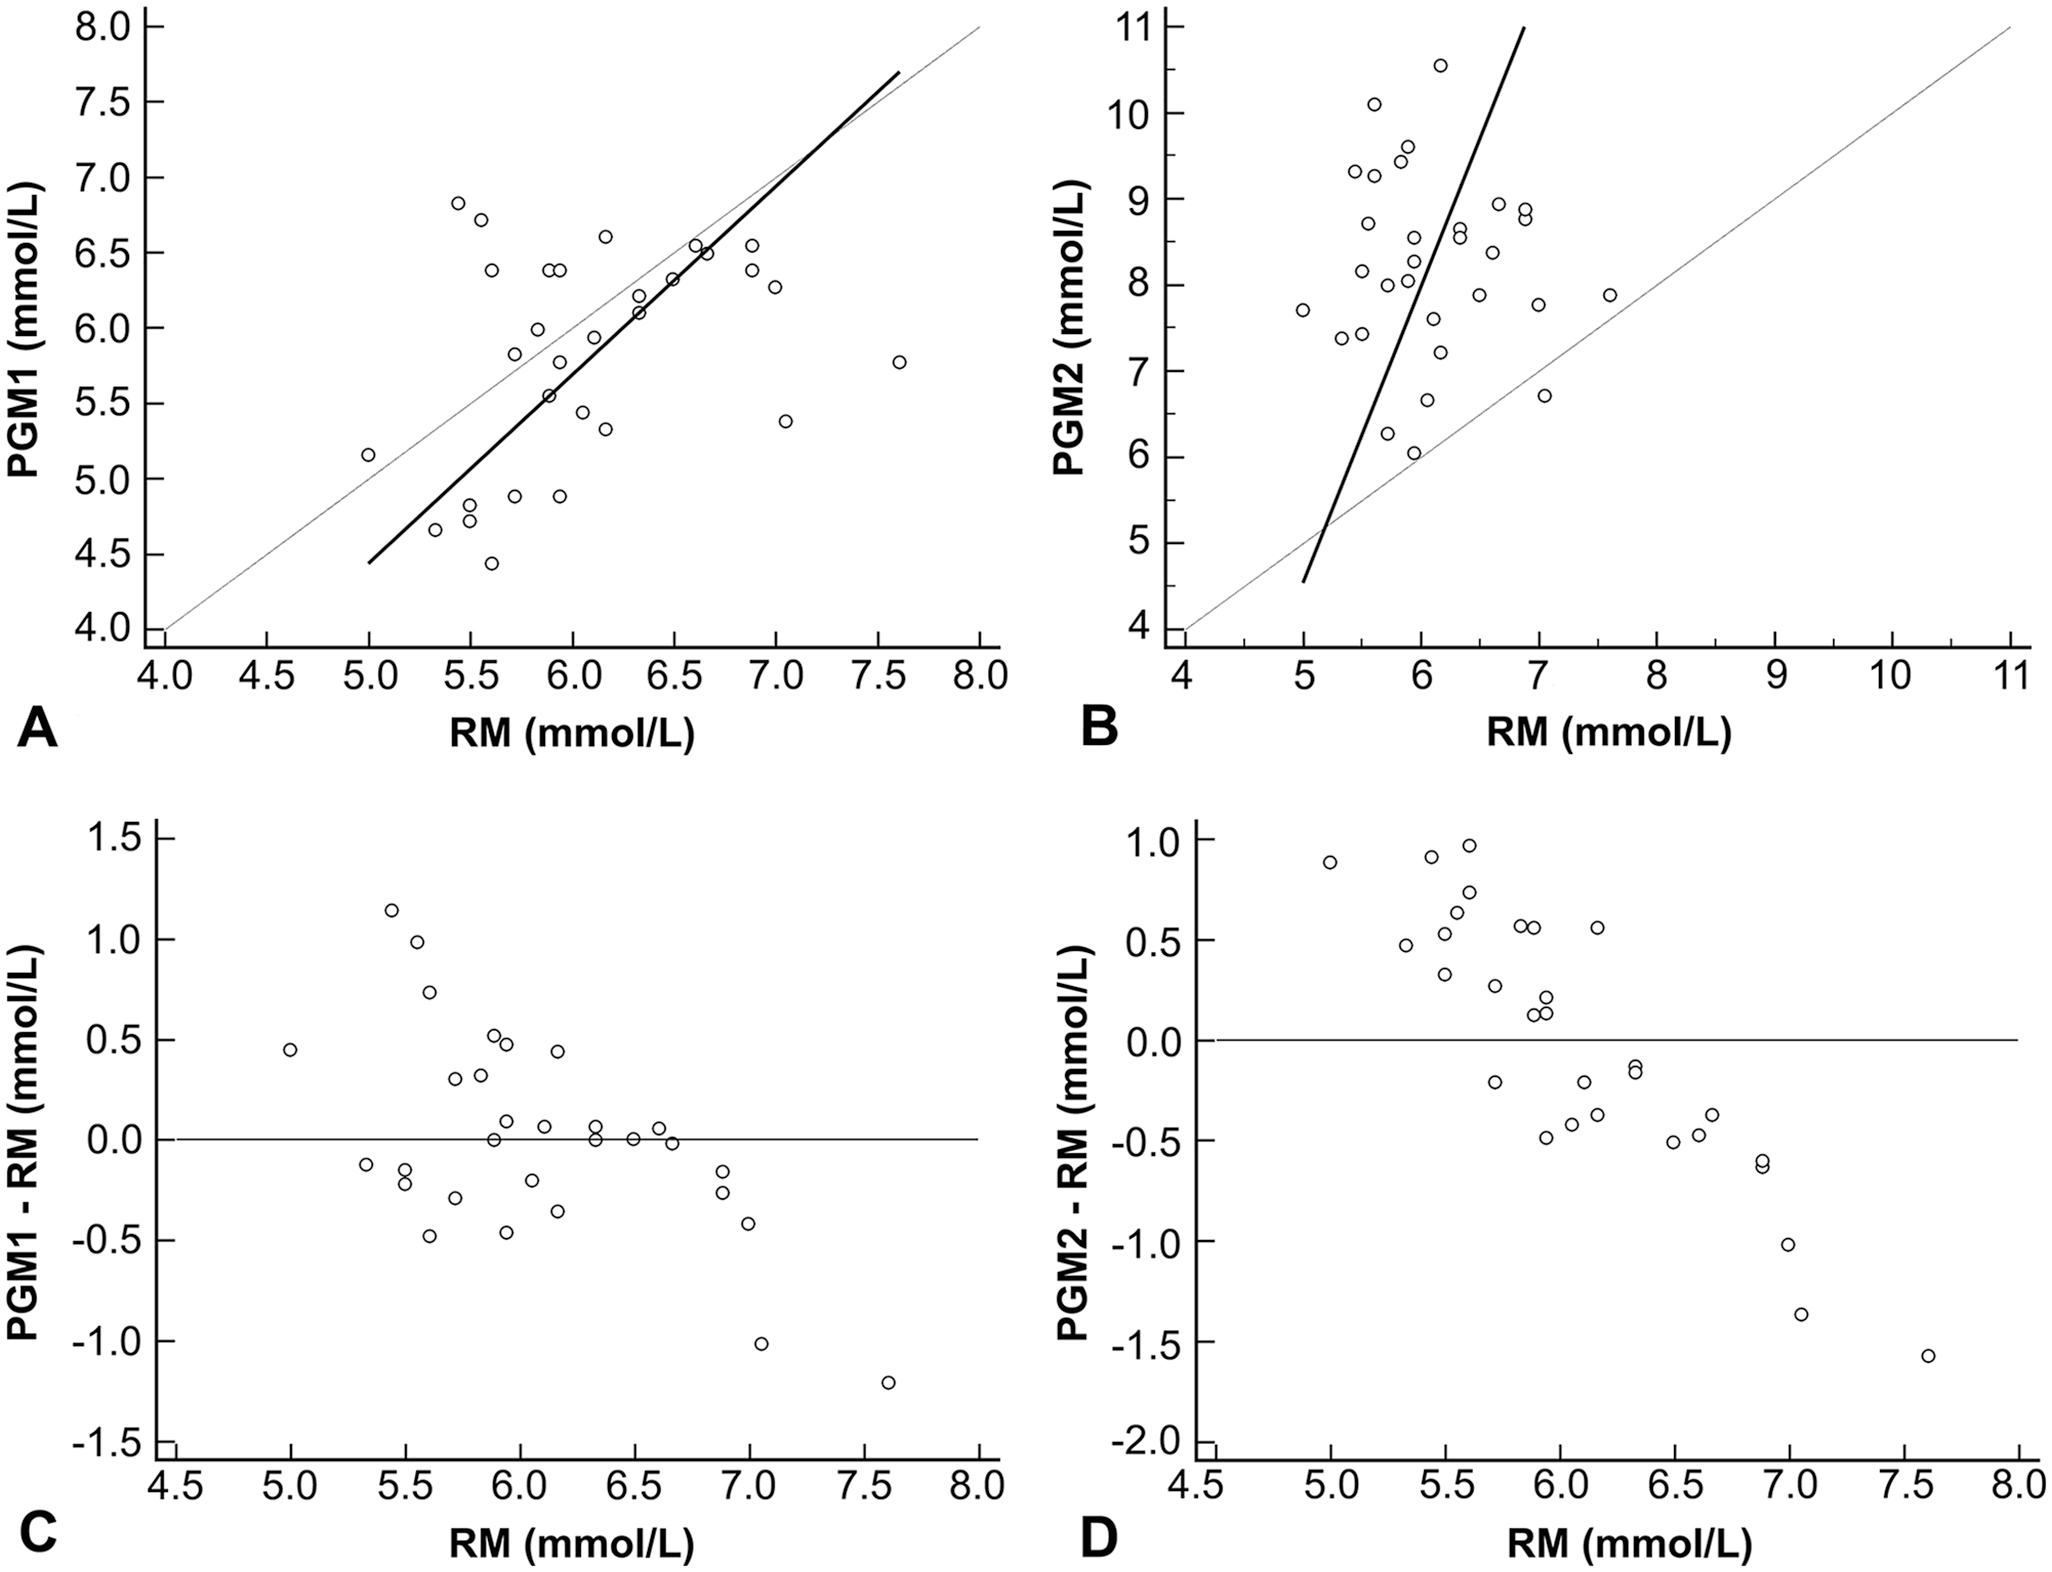
Passing–Bablok regression analyses comparing measurements of blood glucose concentrations in 30 rabbits using 2 portable glucometers (PGM1, PGM2) and a reference method (RM).
Underestimation of blood glucose concentrations, as occurred in our study when using PGM1, was observed in 5 of 6 PGMs tested using blood samples from dogs, with the sixth PGM reporting higher values than the laboratory method, as occurred in our study with PGM2. 5 Such differences in estimation values between PGMs could result from differences in their glucose detection reactions. Contrary to the observed values generated by a similar PGM (i.e., same brand but different model) used in dogs, 11 the PGM1 used in our study did not exhibit any bias when compared to the RM; this may be a result of the inclusion of only healthy rabbits in our study, or to physiologic variations between different species, as has been observed for dogs and cats. 11
The Bland–Altman plot of PGM1 indicated no systematic differences (line of equality between 95% CI of the mean), a lower mean (0.26 mmol/L), and underestimation of blood glucose concentrations <5.6 mmol/L (Fig. 2A), although the latter was not statistically significant (p = 0.0590). Agreement between the limits and the PGM1 results was 86.7% (Fig. 2B). PGM2 exhibited a systematic difference from the RM and overestimated blood glucose concentrations (line of equality out of 95% CI of the mean), with a highly significant (p = 0.0001) mean (2.1 mmol/L; Fig. 2C). Only 26.7% of the measurements performed using PGM2 fell within the defined limits of agreement (Fig. 2D). Veterinary PGMs have shown the same tendency of PGM2 to overestimate blood glucose concentrations in rabbits. 16
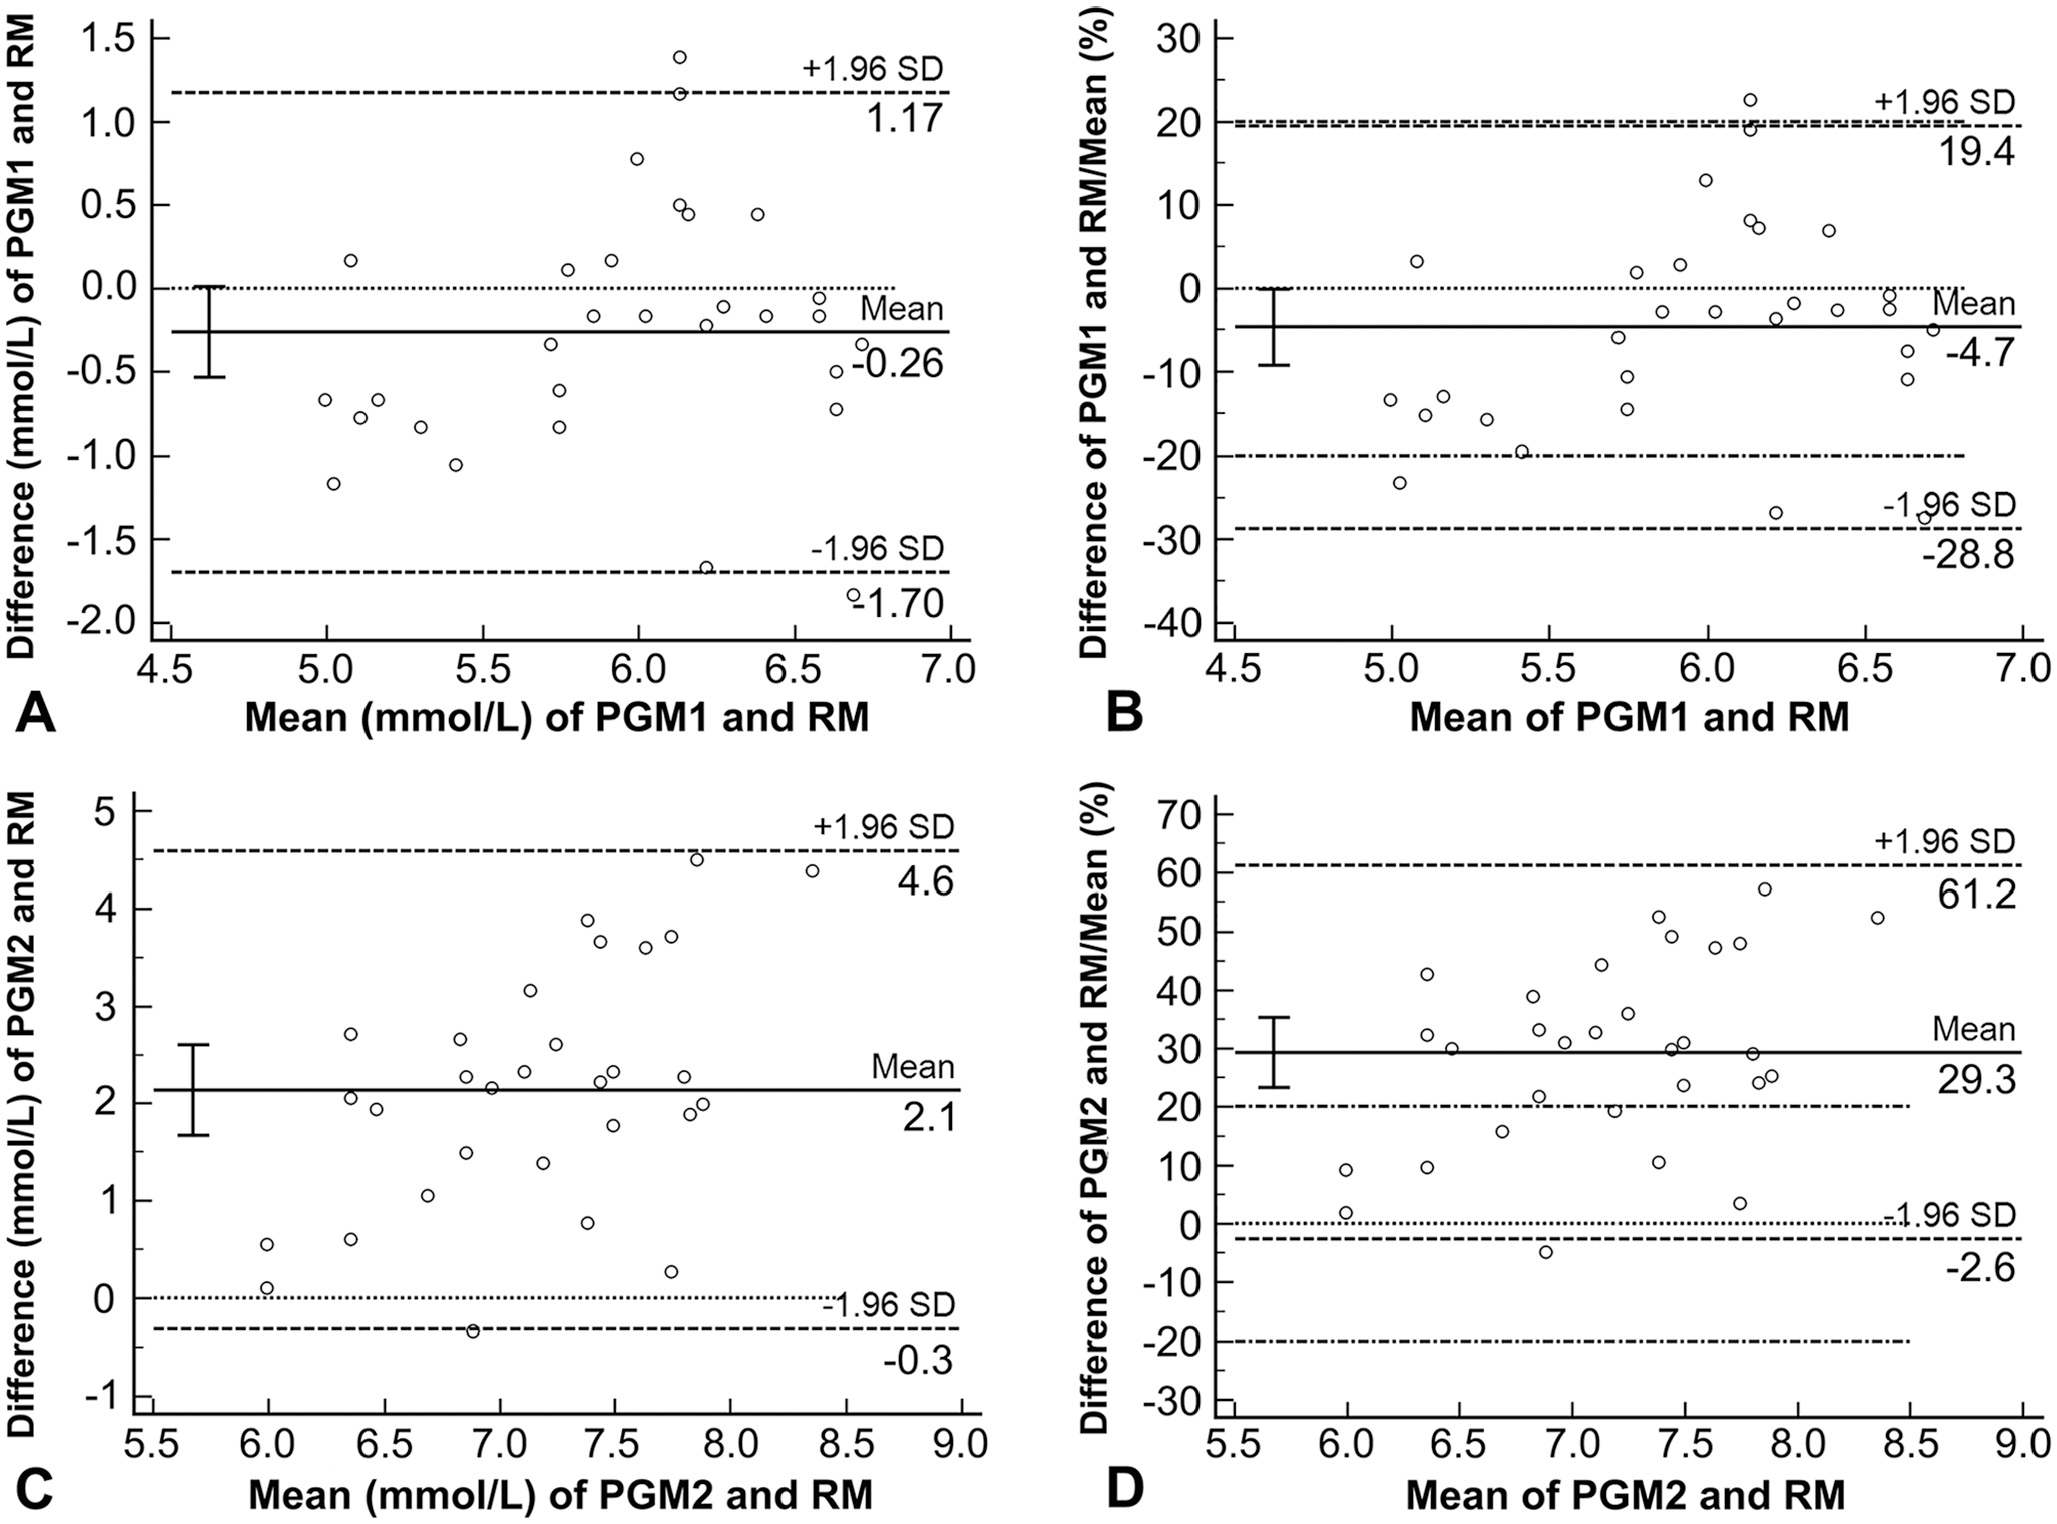
Bland–Altman plot to assess agreement between glucose concentrations of 30 rabbits determined using 2 portable glucometers (PGM1, PGM2) and the reference method (RM). Circles represent individual measurements. The solid horizontal line represents the mean difference between pairs of measurements. The upper and lower horizontal dashed lines represent the 95% limits of agreement. The dotted line is the line of equality. The error bar represents the 95% CI of the mean. The upper and lower dashed-dotted lines represent the mean of the adopted limits of acceptance of 20% (C and D).
All PGM1 measurements and 53% of PGM2 results were classified as Zone A, with the remaining 47% of PGM2 results classified as Zone B; no results were classified as Zones C or D (Table 3). All results generated by PGM2 that were classified in Zone B produced overestimations of blood glucose concentrations compared to the RM. A previous analysis of blood glucose concentrations in dogs found that 33% and 44% of values produced by 2 veterinary PGMs were classified as Zone A; the authors recommended that those 2 PGMs not be used for dogs 6 ; in addition, other glucometer models made by the manufacturer of PGM1 were found to be acceptable for use with rabbits.10,16
Error grid analysis (%) of blood glucose concentrations of 30 healthy White New Zealand rabbits read by portable glucometers.
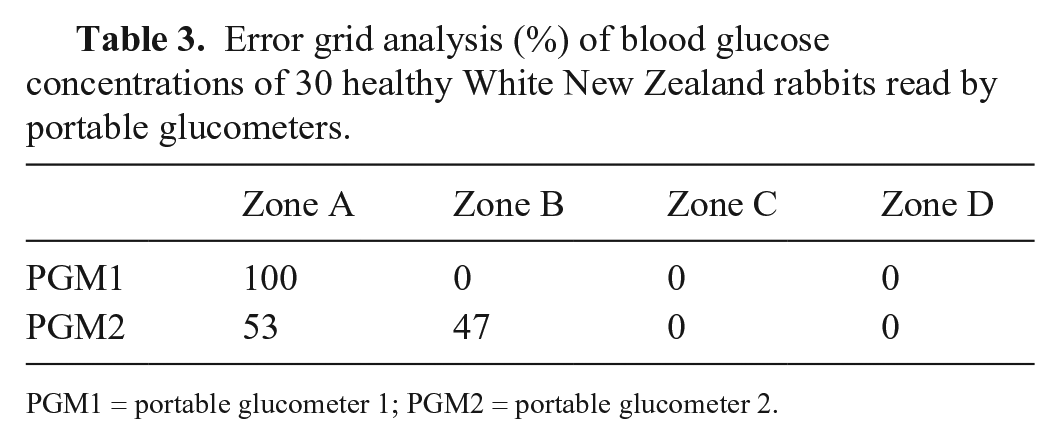
PGM1 = portable glucometer 1; PGM2 = portable glucometer 2.
Some additional characteristics of the PGMs were observed during our experiments. PGM1 requires a smaller quantity of blood for a complete measurement, and features an ergonomic design that allows for a firm handhold; blood placement is more straightforward with the PGM2 model because it uses a capillary method to collect the sample and relies on a simpler hands-free mechanism for removing used strips. PGM2 would therefore be a better choice than PGM1 if ease-of-use was a primary consideration.
Limitations of our study were that only healthy and normoglycemic rabbits were tested, under the assumption that a PGM that produces unreliable results for normoglycemic samples would disqualify it for future testing of hypoglycemic or hyperglycemic rabbits. The lack of comparison of hematocrit levels is another limitation, given that the underestimation of blood glucose levels measured with a human PGM was reported in rabbits with increased hematocrit levels. 16 Although the number of animals included in our study was below that recommended by American Society for Veterinary Clinical Pathology guidelines, 9 our sample size was comparable with published data for pet rabbits. 17 Finally, the absence of a coefficient of variation for the analyzers was a further limitation. For PGM use in rabbits, the evaluation of blood glucose of a whole blood sample directly from a puncture site is common. 10 In our study, all PGM samples were from blood from a heparinized syringe, whereas the RM used blood preserved in sodium fluoride. 12 To avoid rapid clotting, heparinized syringes are commonly used for collection of rabbit blood. 19 Heparin does not influence the results of blood glucose analysis, and sodium fluoride is used to inhibit the glycolytic enzyme enolase. 3 A possible difference between PGM results and the reference method caused by anticoagulants in rabbits needs further study. Future research should focus on how these factors influence the outputs of different PGMs. Studies with hypoglycemic and hyperglycemic rabbits are needed to confirm the accuracy of this PGM prior to its inclusion in rabbit clinical practices.
Footnotes
Acknowledgements
We thank the rabbitry staff (Nicolas Magnus and Gustavo da Costa) for support during rabbit blood collection.
Declaration of conflicts of interests
The authors declared no potential conflicts of interest with respect to the research, authorship, and/or publication of this article.
Funding
This study was financed in part by the Coordenação de Aperfeiçoamento de Pessoal de Nível Superior–Brazil (CAPES)–Finance Code 001.