
Abstract
Control of Brucella ovis infection in sheep flocks in the United States depends on early detection of B. ovis antibodies via serologic testing. We used 2,276 sheep sera and various cutoff values to compare seroprevalence and agreement between 2 ELISAs: the National Veterinary Services Laboratories (NVSL) B. ovis indirect ELISA and the IDEXX B. ovis ELISA kit. A subset of 295 sera was used to compare agreement and evaluate relative sensitivity and specificity of the 2 ELISAs with an agar gel immunodiffusion (AGID) test kit. There was no significant difference in B. ovis seroprevalence between the ELISAs; however, there was poor agreement between them. When the AGID test was used as the reference test, the IDEXX ELISA with a moderate cutoff value (S/P ratio = 45%) had the highest relative sensitivity of 38.1% and specificity of 92.0%. The NVSL ELISA with a lax cutoff value (S/P ratio = 0.75) had relative sensitivity of 19.1% and specificity of 94.6%. Receiver operating characteristic analysis revealed that optimal cutoff values for the NVSL and IDEXX ELISAs were 0.091 and 16.5%, respectively. This results in sensitivity and specificity of 85.7% and 31.8% for the NVSL ELISA, and sensitivity and specificity of 81.0% and 53.6% for the IDEXX ELISA, respectively.
Brucella ovis is the causative agent of a sexually transmitted, infectious disease that causes clinical or subclinical chronic disease in domestic sheep. 13 Ovine brucellosis is characterized by genital lesions and epididymitis in rams, placentitis and rare abortions in ewes, and premature lambs or lambs with low birth weights.3,10,13 Interference with serologic tests by vaccines limits the use of a vaccine in some countries, and antimicrobial treatment is not financially feasible; hence, a test-and-slaughter management strategy is recommended for eliminating B. ovis infection in flocks in the United States. 1
Detection of B. ovis exposure depends mainly on serologic testing; the complement fixation test (CFT), agar gel immunodiffusion (AGID) test, and ELISAs are the primary assays used to detect B. ovis antibodies in serum.1,13 In the United States, the National Veterinary Services Laboratories (NVSL) B. ovis indirect ELISA (APHIS-NVSL) is the only ELISA used for detection of B. ovis antibodies in sheep and goat serum. 13 Although the antigen and controls are purchased from NVSL, each diagnostic laboratory is responsible for buying reagents, coating microtiter plates with antigen, and running the assay according to protocol, resulting in discrepancies between laboratories. The NVSL ELISA has 2 cutoff values, which result in 3 categories: seropositive, seronegative, and indeterminate. The indeterminate result category is difficult to interpret and often requires extra sample collection for additional serologic testing. In contrast, the IDEXX B. ovis ELISA kit (IDEXX Laboratories) is a standardized commercial kit used for detection of B. ovis antibodies in sheep serum in Europe. The kit provides antigen-coated microtiter plates, controls, and reagents. Originally, the IDEXX ELISA had 2 cutoff values, which created 3 result categories: seropositive, seronegative, and suspect. The suspect result category was similar to the indeterminate result category for the NVSL ELISA; however, IDEXX developed 3 new, single cutoff values for producers and veterinarians to use depending on the epidemiologic situation of the flock and purpose of B. ovis testing. 9
Our objective was to compare the NVSL and IDEXX ELISAs with each other and a commercial AGID test kit (TECPAR) to evaluate their potential for use in disease detection on U.S. sheep operations. This information could be utilized by veterinarians, diagnosticians, and producers to determine which assay is best suited for their needs.
Between August 2015 and May 2016, sera were collected from 2,276 sheep from 18 operations in Wyoming. The University of Wyoming Institutional Animal Care and Use Committee (IACUC) approved the study and sampling method (protocol 200150622KS00178-01). Flocks varied in geographic location and size, and sheep varied in age, sex, and breed. 6 During sample collection, properly trained personnel drew 5–10 mL of blood via jugular venipuncture of healthy sheep using 10-mL blood collection tubes and needle holders (Vacutainer; Becton, Dickinson) with disposable 4-cm, 18–20-ga needles (Greiner Bio-One). Blood was allowed to clot before transportation back to the Wyoming State Veterinary Laboratory (Laramie, WY) on ice. Sera were separated from blood samples by centrifugation, decanted into labeled tubes, and stored at –20°C until serologic testing.
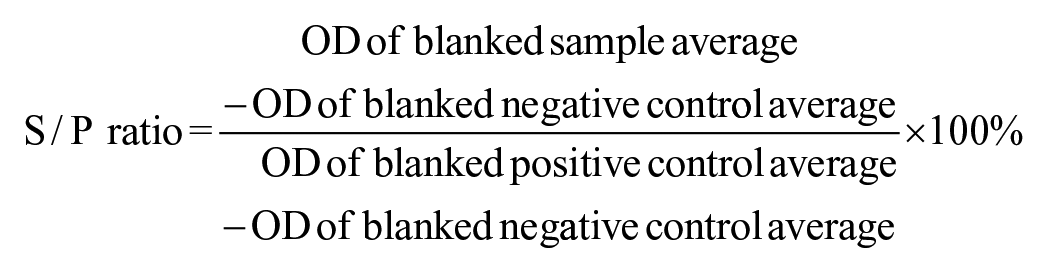
All samples were initially analyzed using the NVSL ELISA according to the manufacturer’s instructions. The diagnostic sensitivity and specificity are reported to be 96.3% and 99.6%, respectively, 7 and the NVSL-supplied antigen was a Triton X-100 extract of the washed REO 198 strain. Controls run in triplicate included high positive, low positive, and negative; sample sera were run in duplicate. Polystyrene microtiter plates (Nunc) were coated with an antigen dilution in carbonate buffer, incubated, and blocked with bovine serum albumin solution (KPL). Conjugated protein G–biotin from Streptococcus spp. (MilliporeSigma), Vectastain conjugate (Vector Laboratories), blue phosphatase substrate (KPL), and APstop solution (KPL) were prepared according to the manufacturers’ instructions. During the assay procedure, sera, conjugated protein G–biotin, and Vectastain conjugate were incubated at 37°C in a humidified chamber inside a digital display incubator (Boekel Industries) for 45 min, 35 min, and 25 min, respectively. After each incubation, plates were washed with a high-salt wash solution, excess liquid emptied in the sink, and plates were tapped onto absorbent material to remove any nonspecifically bound proteins or antibodies. The blue phosphatase substrate incubation step was performed at room temperature on a microplate shaker, and color development stopped when the low-positive control average reached an optical density (OD) between 0.350–0.500 at a wavelength of 620 nm on a microplate absorbance spectrophotometer (Tecan GENios Pro; BioTek Epoch Instruments). The average OD for each sample and control was calculated, and the average sample-to-positive (S/P) ratio used to determine sample status. Original S/P ratio cutoff values were as follows: > 0.75 = positive, ≥ 0.40 to ≤ 0.75 = indeterminate, and < 0.40 = negative. The following equation was used to calculate the S/P ratio:

Sera were then tested using the IDEXX ELISA according to the manufacturer’s instructions. The diagnostic sensitivity and specificity are reported to be 91.7% and 95.2%, respectively, 9 and the antigen used is an extract of the REO 198 strain prepared by IDEXX. Each kit contained 2 antigen-coated plates, positive and negative control sera, anti-ruminant IgG monoclonal antibody labeled with horseradish peroxidase as conjugate, tetramethylbenzidine (TMB) substrate, stop reagent, and wash solution. Controls and sample sera were run in duplicate. During the assay procedure, sera and conjugate were incubated at 37°C in a humidified chamber inside a digital display incubator (Boekel) for 60 min each. After each incubation, plates were washed 3 times with the wash solution, excess liquid emptied in the sink, and plates were tapped onto absorbent material. The TMB substrate incubation step was performed at room temperature for 15 min before adding the stop reagent. The plate was read at a wavelength of 450 nm on a microplate absorbance spectrophotometer (Tecan; BioTek Instruments), the average OD for each sample and control was calculated, and the average S/P ratio was used to determine sample status. Original S/P ratio cutoff values were as follows: > 50% = positive, ≤50% to ≥10% = suspect, and < 10% = negative. Suggested cutoff values of 30%, 45%, or 60% were also assessed. 9 The following equation was used to calculate the S/P ratio:
Finally, 295 sera were tested using the AGID test according to the manufacturer’s instructions. These 295 sera were chosen based on initial results from the NVSL ELISA. Of these samples, 20 were seropositive and 46 were indeterminate. The remaining 229 seronegative samples were chosen randomly. The diagnostic sensitivity and specificity of the AGID test kit is reported to be 70.1% and 100%, respectively. 14 Each kit contained 1 vial of lyophilized antigen prepared from soluble proteins and lipopolysaccharides extracted from the B. ovis REO 198 strain prepared according to OIE international standards, 13 3 vials of lyophilized positive control serum, and 1 vial of diluent. A predetermined dilution of 1% agarose solution in borate buffer (pH 8.3) was boiled in a water bath until the gel was translucent and homogeneous. Agar was poured into mini petri dishes, packed in a well-sealed humidified chamber, and stored in a refrigerator until serologic testing. Seven wells forming a hexagonal shape (1 central and 6 peripheral) were made, and agar was removed with a vacuum. Control and sample sera were distributed in peripheral wells alternating between positive control and sample sera, and the antigen was placed in the central well. Petri dishes were placed in a well-sealed humidified chamber, incubated at room temperature, and read after 48 h using an indirect light system with a black background. The presence of a precipitin line was considered a positive reaction.
Pairwise 2-tailed z-tests were performed to determine statistically significant differences in seroprevalence between the 2 ELISAs (Epitools epidemiological calculators; Ausvet, http://epitools.ausvet.com.au). A p value of ≤0.05 was considered significant. Agreement between pairs of assays, including the AGID test, was estimated using the Cohen kappa coefficient (κ) and the overall proportion of agreement with 95% CIs (Epitools epidemiological calculators; VassarStats, http://vassarstats.net). We interpreted κ as follows: values ≤0 = no agreement, 0.01–0.20 = slight agreement, 0.21–0.40 = fair agreement, 0.41–0.60 = moderate agreement, 0.61–0.80 = substantial agreement, and 0.81–1.00 = almost perfect agreement. 5 Sensitivity and specificity of the ELISAs were calculated, and receiver-operating characteristic (ROC) analyses were performed (Epitools epidemiological calculators) using the AGID test results as the reference test. Few studies have estimated B. ovis prevalence in the United States; therefore, prevalence of 50% was used to place equal weight on the importance of both sensitivity and specificity. The area under the ROC curve (AUC) was calculated (Epitools epidemiological calculators), and AUC values were interpreted as follows: values of 0.5–0.7 = low assay accuracy, 0.7–0.9 = moderate assay accuracy, and 0.9–1.0 = high assay accuracy. Optimal cutoff values for maximizing test efficiency were determined using the Youden index (Epitools epidemiological calculators).
Of 2,276 sera, 20 (0.88%) were seropositive by NVSL ELISA, and 25 (1.10%) by IDEXX ELISA, according to original cutoff values. Seven (0.31%) were seropositive on both ELISAs, and 2,049 (90.03%) were seronegative on both ELISAs. When comparing seroprevalence, there was not a statistically significant difference between the NVSL and IDEXX ELISAs (pairwise 2-tailed z-test, p = 0.4535; Table 1).
Analysis of 2,276 sheep sera for Brucella ovis antibodies according to manufacturers’ original cutoffs.
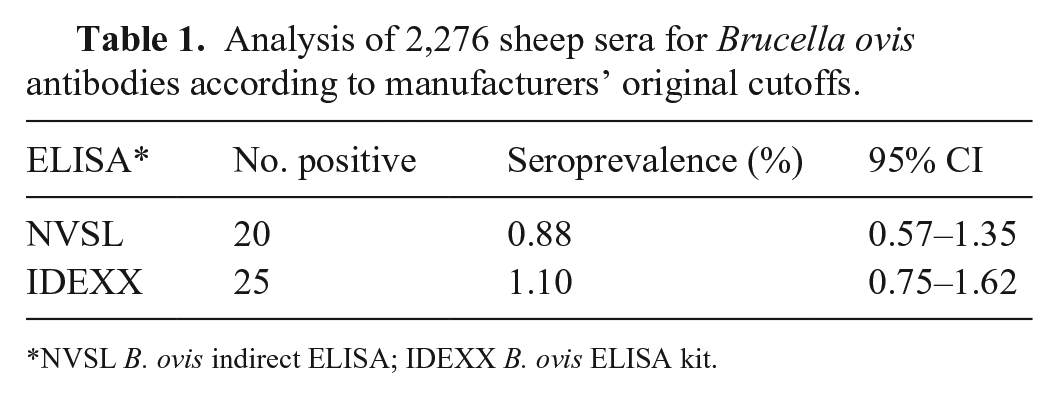
NVSL B. ovis indirect ELISA; IDEXX B. ovis ELISA kit.
Overall, there was poor agreement between different assay cutoffs utilized in this study, based on κ coefficients (Table 2). For the NVSL and IDEXX ELISAs, we first compared the original cutoff values, which included the indeterminate or suspect result. Then, we used multiple single cutoff values to compare ELISAs with each other and the AGID test. The cutoff values used for the NVSL ELISA included a lax and strict value (i.e., 0.75 and 0.40, respectively). The cutoff values used for the IDEXX ELISA included a lax, moderate, and strict value (i.e., 60%, 45%, and 30%, respectively). The lax cutoff values correspond with the higher threshold given the expected decrease in sensitivity caused by possible false-negative results. In contrast, the strict cutoff values correspond with the lower threshold given the expected increase in sensitivity caused by true-positive results. ELISA combinations that resulted in moderate κ coefficients included the NVSL and IDEXX ELISAs with strict cutoff values (0.40 and 30%, respectively; κ = 0.41) and lax cutoff values (0.75 and 60%, respectively; κ = 0.43).
Comparison of kappa coefficients and agreement for various assay combinations and cutoff values for Brucella ovis antibodies.
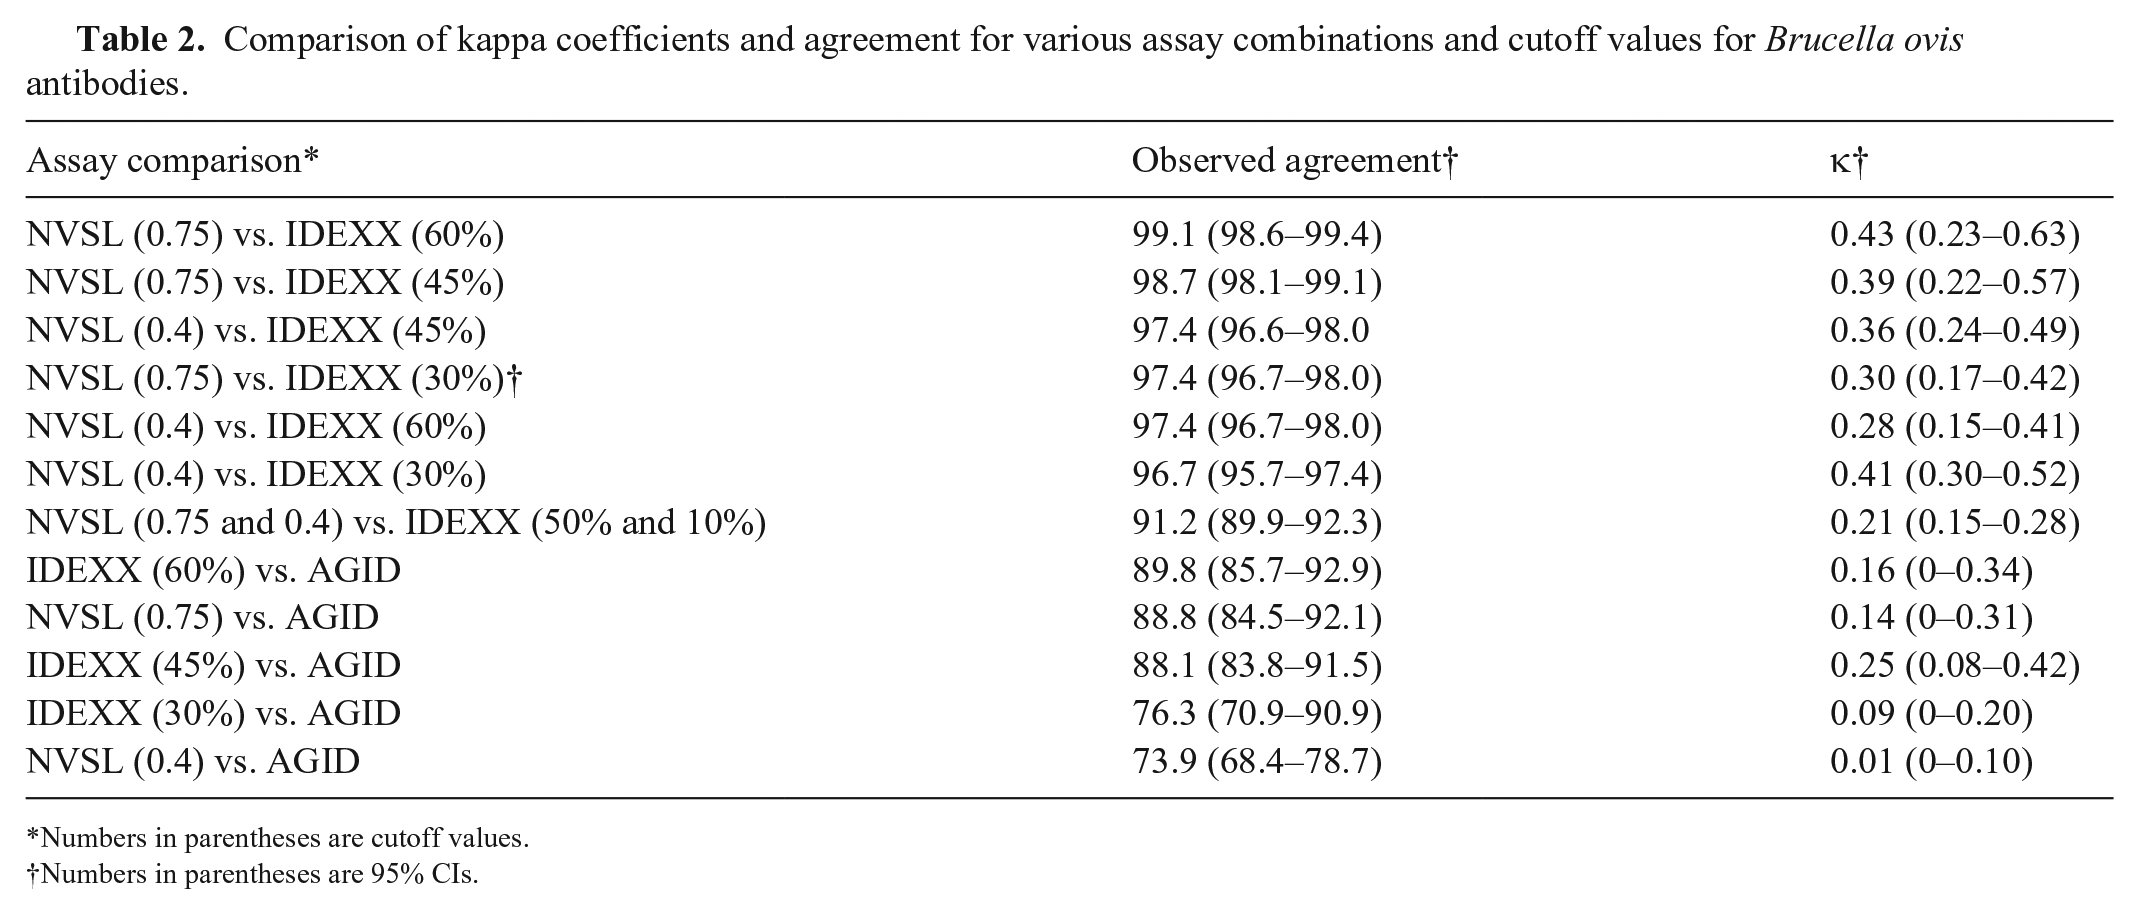
Numbers in parentheses are cutoff values.
Numbers in parentheses are 95% CIs.
When comparing results from each ELISA with results from the AGID test (n = 295), the IDEXX ELISA with a moderate cutoff value (45%) resulted in the highest κ coefficient of 0.25, and overall agreement of 88.1%. The κ coefficient decreased to 0.16 and overall agreement increased to 89.8% when the lax cutoff value (60%) for the IDEXX ELISA was compared with the AGID test. The NVSL ELISA with a lax cutoff value (0.75) and the AGID test resulted in a κ coefficient of 0.14 and overall agreement of 88.8%.
Results from the AGID test (n = 295) were used as the reference test to determine sensitivity and specificity of each ELISA with various cutoff values (Table 3). The IDEXX ELISA with a moderate cutoff value (45%) had the highest combined sensitivity and specificity of 38.1% and 92.0%, respectively. When using the lax cutoff value (60%) for the IDEXX ELISA, sensitivity decreased to 19.1%, but specificity increased to 95.3%. For the NVSL ELISA, the lax cutoff value (0.75) resulted in the highest sensitivity and specificity of 19.1% and 94.6%, respectively.
Sensitivity and specificity for each ELISA with various cutoff values using AGID as the reference test (n = 295).
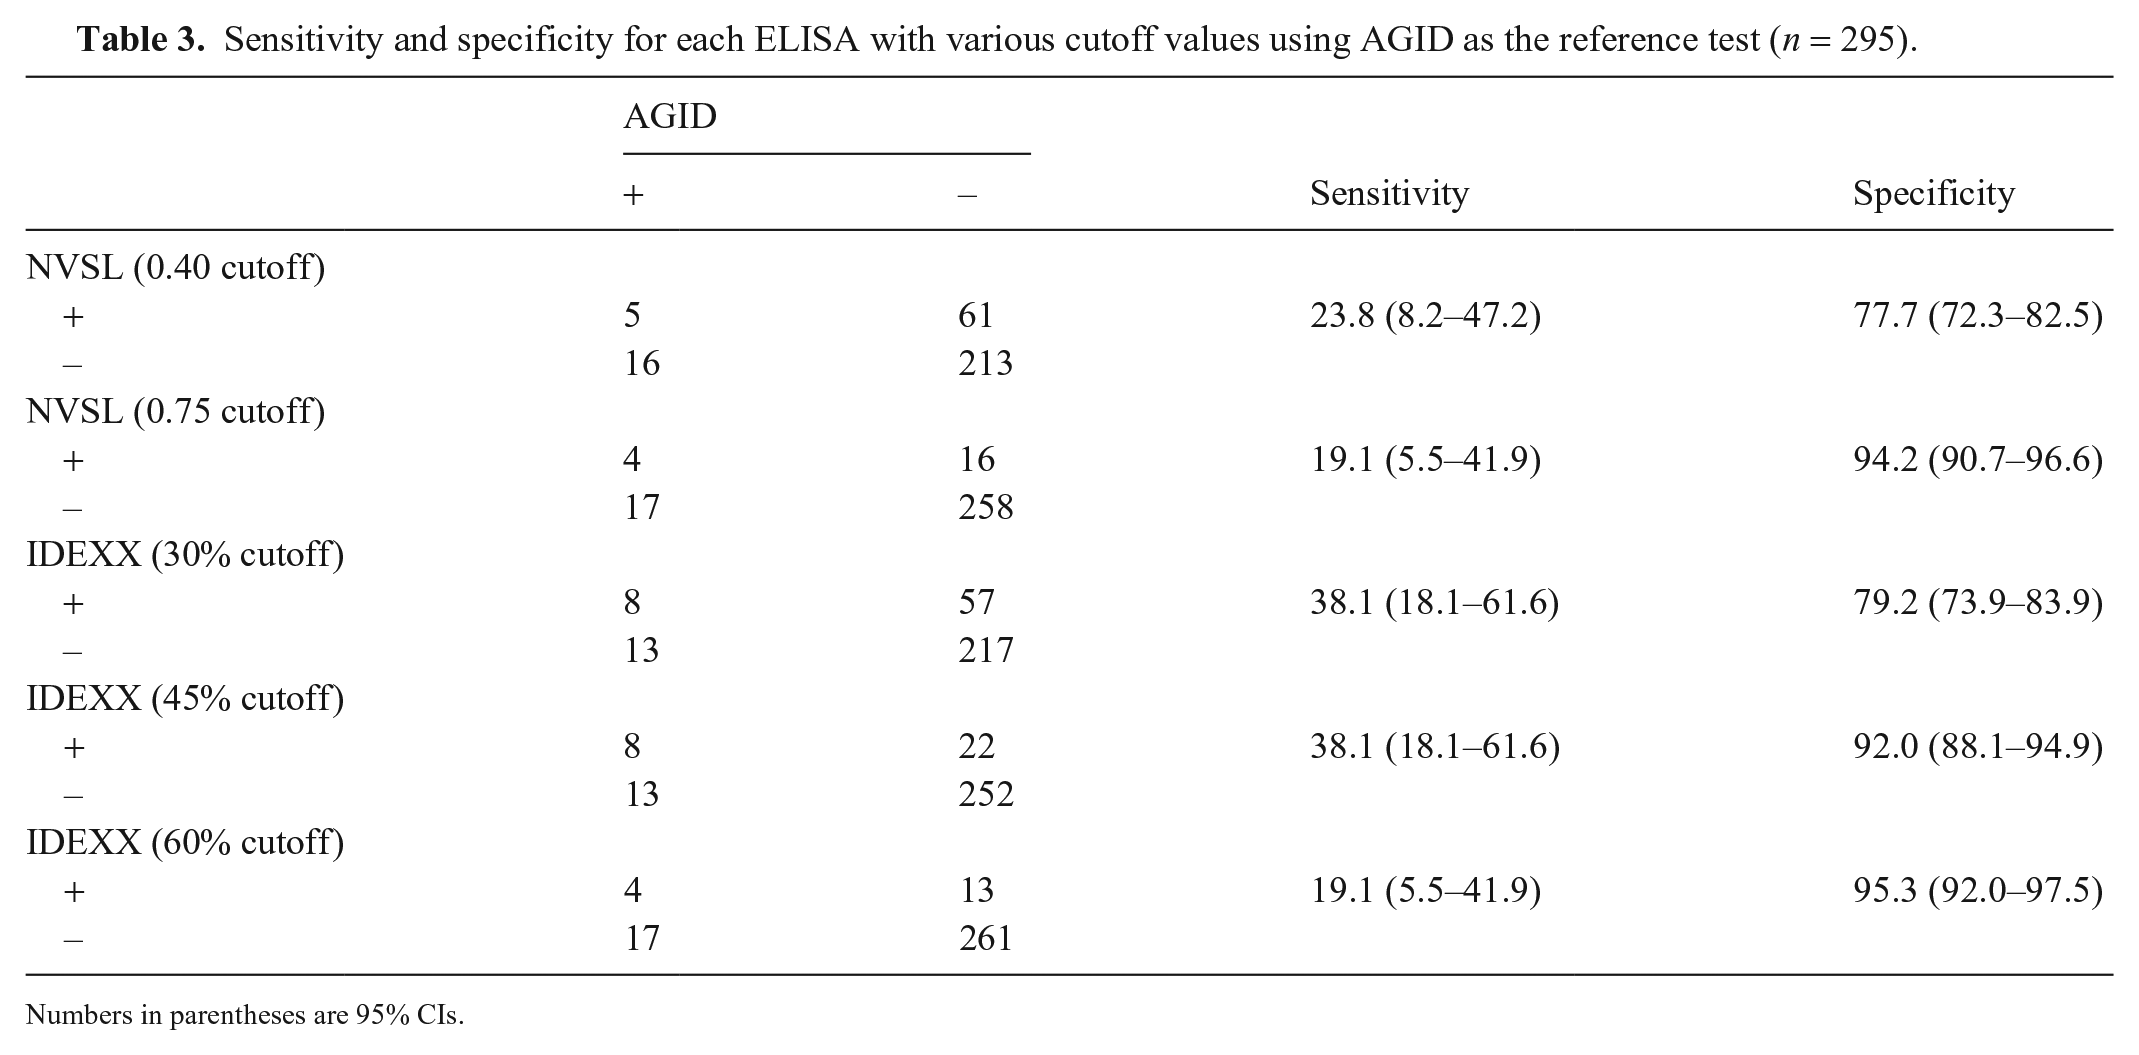
Numbers in parentheses are 95% CIs.
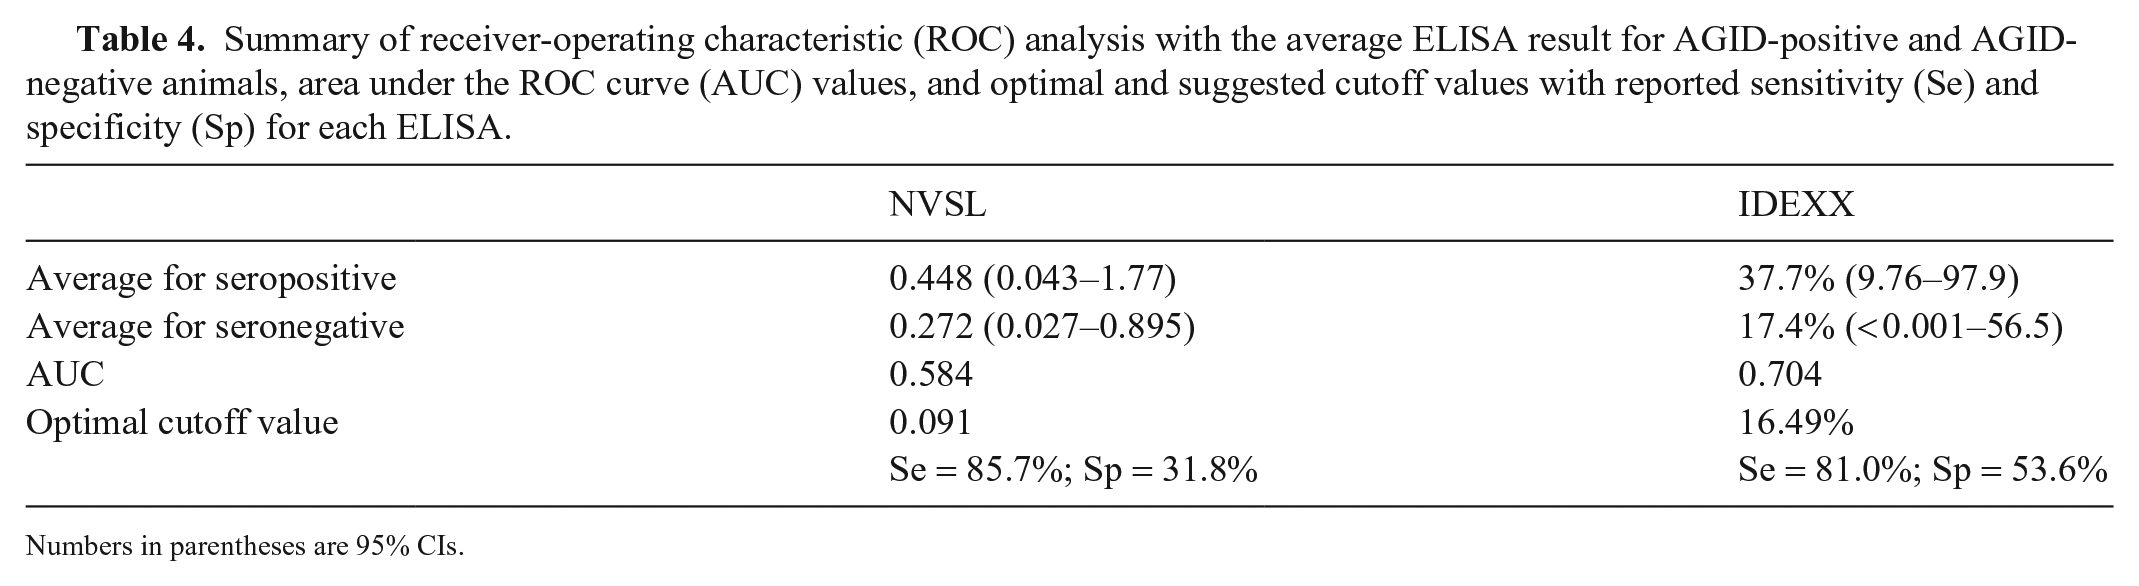
ROC analysis revealed the average ELISA result for AGID-positive and AGID-negative animals, the AUC value, and the optimal cutoff value with reported sensitivity and specificity for each ELISA (Table 4). For the NVSL ELISA, the mean S/P ratio for AGID-positive animals was 0.448 (95% CI: 0.043–1.77; median: 0.236) and the mean S/P ratio for AGID-negative animals was 0.272 (95% CI: 0.027–0.895; median: 0.151). The AUC value was 0.584 (95% CI: 0.452–0.716), which indicates low assay accuracy when compared to the AGID test. Assuming prevalence is 50%, the recommended cutoff value for the NVSL ELISA is 0.091, resulting in sensitivity of 85.7% and specificity of 31.8%. When using the strict cutoff value for the NVSL ELISA (0.40), the sensitivity and specificity were 23.8% and 77.4%, respectively. For the IDEXX ELISA, the mean S/P ratio for AGID-positive animals was 37.7% (95% CI: 9.76–97.9%; median: 24.0%) and the mean S/P ratio for AGID-negative animals was 17.4% (95% CI: < 0.001–56.5%; median: 15.5%). The AUC value was 0.704 (95% CI: 0.591–0.817), which indicates moderate assay accuracy when compared to the AGID test. Assuming prevalence is 50%, the recommended cutoff value for the IDEXX ELISA is 16.5%, which would result in a sensitivity of 81.0% and specificity of 53.6%. When using the moderate cutoff value for the IDEXX ELISA (45%), the sensitivity and specificity was 38.1% and 91.6%, respectively.
Summary of receiver-operating characteristic (ROC) analysis with the average ELISA result for AGID-positive and AGID-negative animals, area under the ROC curve (AUC) values, and optimal and suggested cutoff values with reported sensitivity (Se) and specificity (Sp) for each ELISA.
Numbers in parentheses are 95% CIs.
Our study demonstrated that the IDEXX ELISA detected B. ovis antibodies in more animals than the NVSL ELISA; however, the difference in seroprevalence between the 2 ELISAs was not significant. One explanation for the increased detection of seropositive animals with the IDEXX ELISA is that the assay is detecting low levels of B. ovis antibodies in sera, supporting the notion that the IDEXX ELISA is more sensitive. However, the increased detection of seropositive animals with the IDEXX ELISA could also be an artifact of cross-reactivity. Organisms such as Dichelobacter nodosus and Corynebacterium pseudotuberculosis, the causative agents for ovine footrot and caseous lymphadenitis, respectively, are present in Wyoming and may be responsible for some false-positive reactions in our sample subset.1,2,4,11,12
When we evaluated ELISA agreement, the highest percent agreement and κ coefficients were observed between the ELISAs with similar cutoff values. For example, the NVSL ELISA with its lax cutoff value of 0.75 and the IDEXX ELISA with its lax cutoff value of 60% yielded a κ value of 0.43. However, no pair of ELISAs resulted in a κ value equivalent to “substantial” agreement, which was unexpected. This suggests the transition from one ELISA to another may result in low intra-laboratory agreement. Specifically, a switch from the NVSL ELISA to the IDEXX ELISA with the original cutoff values would result in relatively low agreement. However, a switch from the NVSL ELISA to the IDEXX ELISA with new recommended cutoff values (i.e. 60%, 45%, or 30%) based on the purpose of testing or epidemiologic situation may be a better option. 9
The more important finding of our study resides in the agreement between the AGID and each ELISA with various cutoff values. The IDEXX ELISA with moderate and lax cutoff values and the AGID test resulted in the highest κ coefficients, suggesting that these cutoff values correctly identified the highest percent of AGID-positive and AGID-negative animals while taking into consideration the percent agreement based on random chance. Specifically, the IDEXX ELISA with the moderate cutoff value correctly identified 8 AGID-positive animals and 252 AGID-negative animals. The NVSL ELISA with a lax cutoff value correctly identified 4 AGID-positive animals and 258 AGID-negative ones. Based on these results, the IDEXX ELISA with the moderate cutoff value resulted in the fewest false-negative results (i.e., 13), while correctly identifying the highest number of true-positive results (i.e., 8) when the AGID is used as the reference test for this sample set. This moderate cutoff value is recommended in flocks that perform some serologic testing, but may possess seropositive or “suspect” animals, which are characteristics that apply to many Western flocks. 9
When we used the AGID test as a reference test to calculate sensitivity and specificity, the IDEXX ELISA with the moderate cutoff value had the highest combined sensitivity and specificity. When the cutoff value was relaxed, both the sensitivity and specificity of the IDEXX ELISA decreased, but remained higher than the NVSL ELISA. The lax cutoff value of the NVSL ELISA resulted in lower sensitivity (19.1% from 23.8%), but higher specificity (94.2% from 77.7%) compared to the strict cutoff value, suggesting many of the indeterminate results are truly seronegative, not seropositive. If the strict cutoff value is used for the NVSL ELISA, there will be a large number (e.g., 61 in our study) of false-positive results, which may lead to the culling of truly negative animals. However, if the overall objective and disease management strategy of a particular flock is to eliminate all animals with B. ovis antibodies, the strict cutoff value will provide fewer false-negative results. False-negative results can be particularly detrimental when dealing with venereal diseases, including B. ovis, because 1 ram can breed 30–50 ewes in 1 breeding season.
When we looked at the optimal cutoff value for each ELISA, all recommended values were extremely stringent in order to increase diagnostic sensitivity. Although a cutoff value of 0.091 for the NVSL ELISA would result in higher sensitivity (85.7%), the specificity is only 31.8%. For the IDEXX ELISA, the recommended cutoff is 16.5%, resulting in a sensitivity and specificity of 81.0% and 53.6%, respectively. Given the low sensitivity values for both ELISAs, one concern is that false-negative results will likely be produced. False-negatives have implications for flocks that are trying to eliminate B. ovis, given that all seronegative animals may not truly be disease-free, and could be one reason for well-managed flocks to find seropositive animals when they are tested routinely. However, most flock owners are more concerned with disease-free animals testing as seropositive because this results in the culling of valuable animals. Thus, a follow-up test is recommended for any animal that tests positive for B. ovis antibodies. The preferred test would be one that has higher specificity, such as the AGID test. However, the commercial AGID test that we used is only available in Brazil. Another possible assay is PCR, given that it detects B. ovis DNA from semen or vaginal swabs; however, PCR could produce false-negative results as a result of intermittent bacterial shedding. Furthermore, we acknowledge that this would be impractical for many sheep producers, as these samples are much more difficult to obtain than blood samples.
Regarding potential bias and study flaws, sample handling and the decision to use the AGID test as a reference test may have influenced study outcomes. We included sera from 2,276 sheep on 18, non-random, producer-selected operations in Wyoming. Animals selected within the flocks often comprised the majority of a flock’s breeding rams and a convenient subset of breeding ewes, resulting in a sample population that is not entirely representative of breeding sheep in the state. We created additional sample bias when we chose the 295 samples for AGID testing based on the initial results from the NVSL ELISA. Additional serologic testing to rule out cross-reactions from other organisms, including the causative agent of caseous lymphadenitis, C. pseudotuberculosis, was not performed. Another bias results from the length of time between sample collection and testing with each ELISA. We tested sera with the NVSL ELISA on average 33 d post-collection (95% CI: 32–35 d; median: 20 d). However, sera were stored in a –20°C freezer for up to 10 mo before being tested with the IDEXX ELISA. Select sera were then sent to the Federal University of Paraná in Brazil to be tested with the TECPAR AGID test. Although the CFT is considered the gold standard test for B. ovis–free certification prior to international movement, we chose to use the AGID test as the reference test because it has comparable sensitivity and specificity to the CFT, but it is much simpler and less expensive to perform in non-specialized laboratories.8,13,14 However, it is generally acknowledged that the AGID test is less sensitive and more specific, and this commercial AGID test kit has a published sensitivity and specificity of 70% and 100%, respectively. 14 For our study, it is possible that some infected animals, or “true positives,” were not detected by the AGID, thereby artificially lowering the specificity estimates for the 2 ELISAs. Although much less likely, given an estimated 100% specificity, if the AGID misdiagnosed truly disease-free animals as infected, the number of false-negative results on the ELISAs would be inflated, contributing to artificially lowered sensitivity calculations. The only way to resolve this issue would be to perform a controlled study with the known infection status of animals and independently calculate sensitivity and specificity of each assay. Because there are limited studies available on assay performance for B. ovis, we feel it is important to understand the strengths and limitations of the currently available assays. This information should lead to improved management plans of sheep flocks worldwide.
Footnotes
Acknowledgements
We thank the Wyoming sheep producers who made this study possible.
Declaration of conflicting interests
The authors declared no potential conflicts of interest with respect to the research, authorship, and/or publication of this article.
Funding
This work was supported by a Wyoming State Agriculture Producer Research Grant and Wyoming Agricultural Experiment Station funding provided through the USDA National Institute of Food and Agriculture, Hatch project 1008761.