
Abstract
Porcine epidemic diarrhea virus (PEDV) is an emerging porcine coronavirus that causes a tremendous economic burden on the swine industry. The assessment of PEDV-neutralizing antibody levels provides a valuable tool to assess and predict herd immunity. We evaluated the performance of a PEDV imaging cytometry–based high-throughput neutralization test (HTNT) and compared the HTNT to a fluorescent focus neutralization (FFN) assay using serum samples from pigs of known PEDV infection status (n = 159). Estimates of diagnostic sensitivity and specificity for HTNT and FFN assays derived from receiver-operator characteristic (ROC) curve analyses showed that both PEDV FFN and HTNT provided excellent diagnostic performance. However, in the laboratory, imaging cytometry provided an objective and semi-automated approach that removed human subjectivity from the testing process and reduced the read-time of a 96-well plate to < 4 min. In addition, imaging cytometry facilitated the rapid collection and long-term storage of test images and data for further evaluation or client consultation. For PEDV and other pathogens, imaging cytometry could provide distinct advantages over classic virus neutralization or FFN assays for the detection and quantitation of neutralizing antibody.
Species Porcine epidemic diarrhea virus (PEDV) is an Alphacoronavirus that causes a highly contagious enteric disease in pigs of all ages.11,14,20 Since its emergence in the midwestern United States in 2013, PEDV has become endemic in large parts of the Americas causing a substantial economic impact on the swine industry.15,18,19 Control measures in endemic areas are directed towards building PEDV sow immunity and controlling PEDV infection. Lactogenic immunity plays a key role in the protection of neonatal piglets against PEDV infection. 12 Commercial vaccines, administered intramuscularly, are capable of boosting PEDV immunity only after oral exposure to live PEDV (feedback), which is the only way to achieve strong, rapid, and lasting stimulation of gut mucosal immunity. 16 However, clients of the Iowa State University Veterinary Diagnostic Laboratory (ISU VDL; Ames, IA) report that irregular immune responses and re-infections in sows after controlled feedback still represent a concern for optimal and uniform induction of herd immunity for protection.
Several PEDV antibody assays have been described, including immunofluorescence assay (IFA), enzyme-linked immunosorbent assay (ELISA), virus neutralization (VN), and fluorescent focus neutralization (FFN).1,5,6,9,10 In particular, assessment of PEDV-neutralizing antibody levels (VN, FFN) provides a valuable tool to assess and predict herd immunity. 4 VN assays have inherent weaknesses for routine use: they are subjective because the reactions are evaluated by human beings, the repeatability of the test is affected by run-to-run variation in cell propagation and virus replication, and throughput is slow because of the biologic processes involved. The PEDV FFN assay is a modification of the VN assay in which the results are read by technicians and the response interpreted in terms of a reduction in fluorescence relative to controls. 10 Specifically, antibody titers are reported as the reciprocal of the highest dilution, resulting in ≥ 90% reduction in fluorescent focus units (FFU) relative to virus control wells. 10 The fact that FFN does not depend on detecting viral cytopathic effect (CPE) means that the test has a shorter turnaround time (i.e., plates can be read in 20–24 h as opposed to 3 d for VN). 10 Nevertheless, the FFN retains some of the drawbacks of VN, including the fact that direct observation of fluorescent-stained infected cells is subjective, labor-intensive, and time-consuming. In contrast to other methods, imaging cytometry is reportedly an objective, rapid, repeatable, specific, and semi-automated approach to the detection of neutralizing antibody (e.g., vesicular stomatitis virus and adenovirus 36).2,8 We evaluated the performance of a PEDV high-throughput neutralization test (HTNT) based on imaging cytometry.
As described elsewhere, serum samples (n = 159) of known PEDV antibody status were obtained by inoculating twenty 9-wk-old pigs with material recovered from PEDV-infected piglets on commercial farms and then collecting samples over time post-inoculation. 13 To verify their PEDV-negative status, serum and oral fluid specimens were collected from all pigs on day post-inoculation (dpi) –4 and tested by PEDV IgG ELISA and reverse-transcription, real-time PCR (RT-rtPCR) at ISU VDL using methods offered routinely to clientele. The PEDV inoculum administered to the pigs was prepared by mixing ~15 g of minced PEDV RT-rtPCR–positive intestine (field sample) with 500 mL of phosphate-buffered saline (PBS, pH 7.4; Gibco, Thermo Scientific, Waltham, MA). On dpi 0, the inoculum was sprayed into the nares of each pig for 5 s using a garden sprayer (Chapin, Batavia, NY). Individual pig fecal samples collected on dpis −7, 0, and 7 were tested by PEDV RT-rtPCR to confirm productive infection. Blood samples for antibody testing were collected from the jugular vein or cranial vena cava on dpis −4, 0, 7, 14, 21, 28, 35, and 42 and the serum stored in 2-mL cryogenic tubes (Greiner Bio-One, Frickenhausen, Germany) at −80°C until tested. Serum samples (n = 159) were collected from PEDV-inoculated pigs, randomly ordered, and subsequently tested for PEDV-neutralizing antibody by both HTNT and FFN. All procedures were conducted with the approval of the Iowa State University Office for Responsible Research.
Cell culture–adapted PEDV (USA/Colorado/2013) was propagated in Vero 81 cells (ATCC CCL-81; American Type Culture Collection, Manassas, VA), as described elsewhere. 3 Vero 81 cells were cultured in cell propagation medium composed of Dulbecco modified Eagle medium (DMEM; MilliporeSigma, St. Louis, MO), 10% heat-inactivated fetal bovine serum (FBS; Atlas Biologicals, Fort Collins, CO), and 1% penicillin–streptomycin (Pen Strep; Gibco, Grand Island, NY) and incubated at 37°C in a humidified incubator with 5% CO2.
Virus titration was performed by 10-fold serially diluting (10−1–10−8) virus stock in DMEM containing 2 µg/mL tosyl-L-phenylalanine chloromethyl ketone (TPCK)-treated trypsin (virus inoculation medium) and then adding 100 µL of each dilution to 5 wells of a 96-well plate containing confluent Vero 81 cells. The virus inoculation medium without virus was used as a negative control. Plates were then incubated at 37°C in a humidified incubator with 5% CO2 for up to 5 d, or until CPEs were observed. Virus titers were calculated using the Spearman–Kärber method and expressed as 50% tissue culture infective dose (TCID50) per mL.7,17
Clear flat-bottom, black polystyrene, tissue culture–treated, 96-well plates (Corning Life Sciences, Tewksbury, MA) were used in the PEDV HTNT to avoid well-to-well crosstalk when read with the imaging cytometer (SpectraMax i3 multi-mode microplate reader platform with MiniMax 300 imaging cytometer; Molecular Devices, Sunnyvale, CA) operated with SoftMax Pro software (v.6.5, Molecular Devices). Plates were prepared by inoculating wells with Vero 81 cells (5 × 10⁴ cells per well) in 100 μL of cell propagation medium. Plates were incubated for 48 h or until Vero 81 cells were ≥90% confluent. Confluency (%) was estimated using the imaging cytometer with a transmitted light exposure time of 5 ms and a focus adjustment of 60 µm. Plates with wells failing to meet confluency requirements were rejected.
Internal controls (tested in quadruplicate; 100 µL/well) were included in each testing plate (i.e., positive control, PEDV antibody–positive serum; negative control, PEDV antibody–negative serum; virus control; and cell control, virus inoculation medium). PEDV antibody–positive and –negative serum controls were derived from PEDV-inoculated or negative control pigs as described previously. 6
All serum samples, including positive and negative controls, were heat-inactivated at 56°C for 30 min before testing. Samples were then diluted 1:40 by first diluting 1:20 with virus inoculation medium and then 1:1 with 1:10 diluted PEDV stock virus (3.16 × 10⁵ TCID50/mL). Samples were incubated at 37°C for 1 h, and then 150 µL of the serum–virus mixture was transferred to 96-well HTNT plates containing confluent Vero 81 cells that had been pre-washed 3 times with wash medium (DMEM containing 1% penicillin–streptomycin). The plates were incubated at 37°C for 1.5 h and then washed once with wash medium and once with virus inoculation medium. Thereafter, 150 µL of virus inoculation medium was added to each well and the plates incubated at 37°C for an additional 20–24 h. Medium was then removed, and cells fixed with 100 µL of 80% acetone (4°C) for 15 min and air-dried (22–25°C). Plates were then washed once with PBS (1×, pH 7.4; Gibco) and stained with 1:100 diluted PEDV-nucleoprotein (N) fluorescein isothiocyanate (FITC)-labeled ascites (SD6-29 clone; Medgene Labs, Brookings, SD) for 1 h at 37°C. The plates were then washed 4 times with PBS. HTNT plates were read on the imaging cytometer at a wavelength of 541 nm, one-site reading, 15–30 ms exposure time, and 20 µm focus. The response was read as total fluorescence intensity (TFI), which was then standardized as:
HTNT plates were required to meet specific quality criteria: antibody-positive serum control TFI 0.1–7.0, antibody-negative serum control TFI ≥ 70, virus control TFI ≥ 100, positive staining in virus control well, and no positive staining in cell control well. Results from plates failing to meet these criteria were rejected.
The samples tested (in duplicate) by HTNT were also tested for PEDV-neutralizing antibody at the South Dakota State University Animal Disease Research and Diagnostic Laboratory (Brookings, SD) using a FFN procedure described elsewhere. 10 In brief, heat-inactivated serum samples were 2-fold diluted (1:10–1:1,280) in MEM containing TPCK-treated trypsin (1.5 µg/mL). The serum samples were mixed 1:1 with cell culture–adapted PEDV (100 FFU per 100 µL) and incubated at 37°C for 1 h. The mixture was added to 96-well plates containing confluent monolayers of Vero 81 cells and incubated at 37°C for 2 h. After incubation, the plates were washed again with MEM containing TPCK-treated trypsin (1.5 µg/mL) and incubated for 20–24 h. Plates were then fixed with 80% acetone (22–25°C), stained with FITC-conjugated monoclonal antibody SD6-29, and visualized using a fluorescence microscope. Neutralizing endpoint titers were defined as the highest serum dilution that reduced fluorescent foci relative to controls by ≥90%. Serum samples with neutralizing endpoint titers ≥1:20 were considered positive for PEDV-neutralizing antibody.
Statistical analyses were performed using SAS v.9.4 (SAS Institute, Cary, NC). The proportions of PEDV HTNT- versus FFN-positive serum were compared using the Fisher exact test. The diagnostic sensitivity and specificity were estimates for FFN and HTNT assays derived from receiver-operator characteristic (ROC) curve analyses (SAS v.9.4) over a range of cutoffs for each assay and using the assumption that serum samples collected < 7 dpi were negative and samples collected ≥14 dpi were positive.
Individual pig fecal samples (n = 20) collected on dpis −7 and 0 were negative for PEDV by RT-rtPCR, whereas the inoculum and pig fecal samples (n = 20) collected on dpi 7 were RT-rtPCR–positive. PEDV IgG ELISA results showed seroconversion of all pigs by dpi 14. Watery diarrhea was observed in pigs for a few days post-inoculation, but no other clinical signs were noted, and all pigs recovered uneventfully.
All 159 serum samples collected between dpis 4–42 were tested by HTNT and FFN (Fig. 1). The first neutralizing antibody response was detected at dpi 7 (HTNT and FFN). After peaking at dpi 21 (HTNT and FFN), neutralizing antibody concentrations declined (HTNT) or remained stable (HTNT) through dpi 42. FFN and HTNT diagnostic sensitivity and specificity were estimated over a range of cutoffs (Table 1). Using a FFN cutoff of ≥1:20, 10 one false-positive result was observed on dpi 0 (Table 2). Thereafter, 8 of 20 (40%) pigs were FFN positive by dpi 7, 19 of 20 (95%) by dpi 14, and 20 of 20 by dpi 21 (Table 2). Overall, during the period of observation, test performance was virtually identical, as shown by the estimates and overlapping 95% confidence intervals (Table 1).
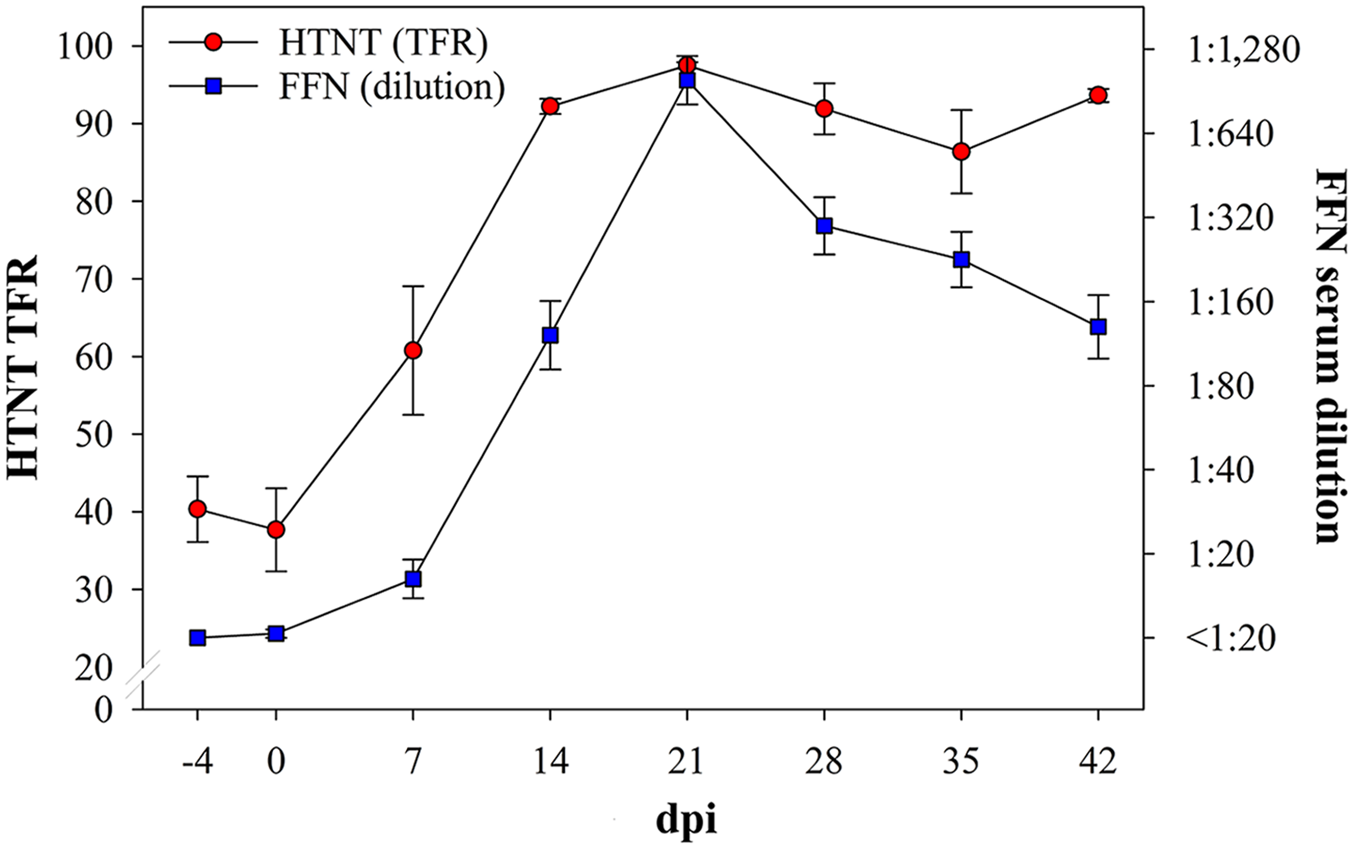
Neutralizing antibody kinetic by day post-inoculation (dpi; x-axis) as detected by high-throughput neutralization test (HTNT) as the total fluorescence ratio (TFR; left y-axis) and fluorescent focus neutralization (FFN) as serum dilution (right y-axis).
Performance of a high-throughput neutralization test (HTNT) and a fluorescent focus neutralization (FFN) test for the detection of porcine epidemic diarrhea virus (PEDV)-neutralizing antibodies.
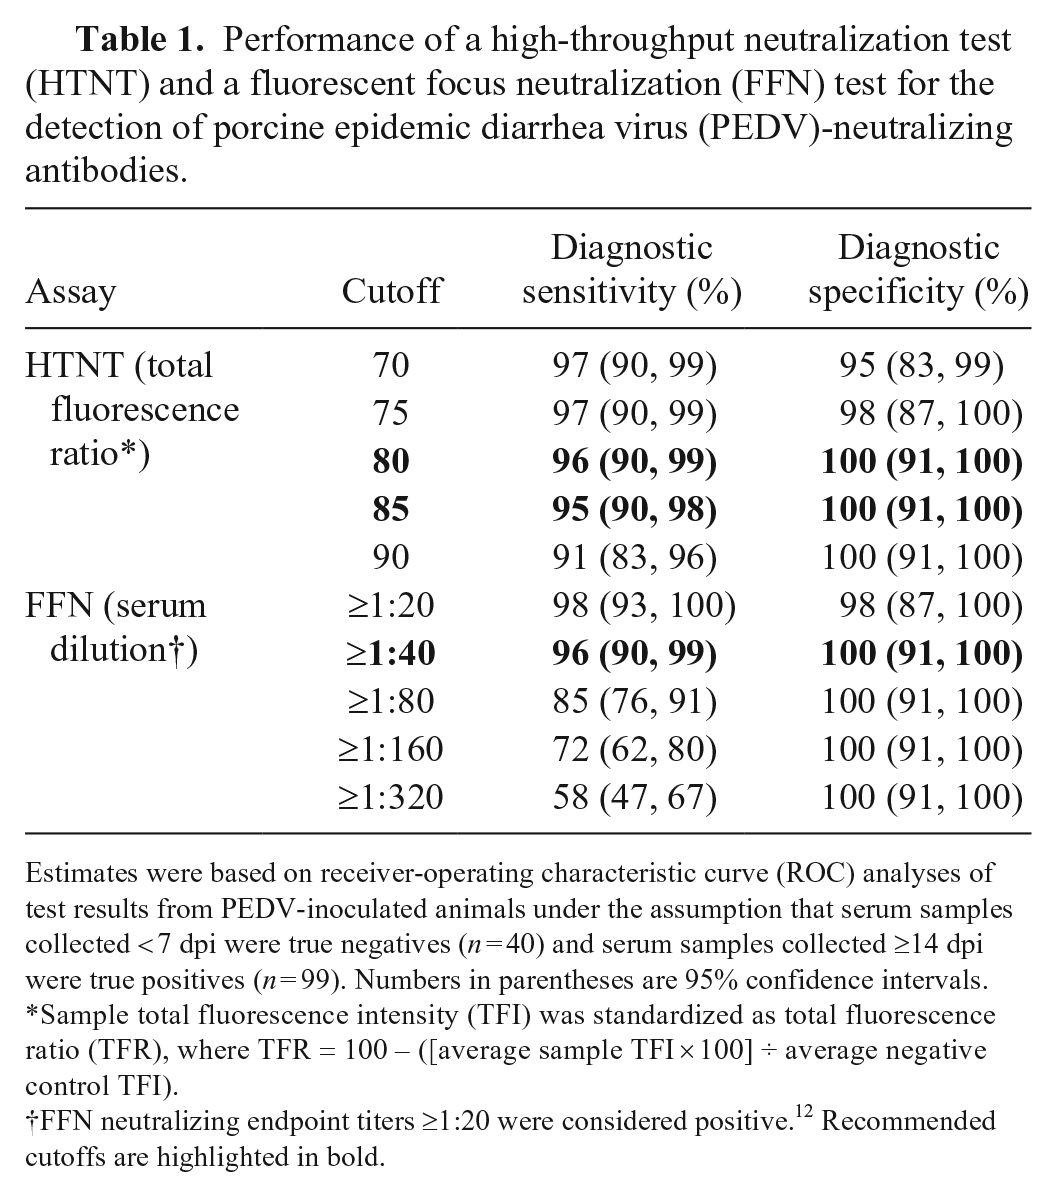
Estimates were based on receiver-operating characteristic curve (ROC) analyses of test results from PEDV-inoculated animals under the assumption that serum samples collected < 7 dpi were true negatives (n = 40) and serum samples collected ≥14 dpi were true positives (n = 99). Numbers in parentheses are 95% confidence intervals.
Sample total fluorescence intensity (TFI) was standardized as total fluorescence ratio (TFR), where TFR = 100 – ([average sample TFI × 100] ÷ average negative control TFI).
FFN neutralizing endpoint titers ≥1:20 were considered positive. 12 Recommended cutoffs are highlighted in bold.
Comparison of porcine epidemic diarrhea virus–neutralizing antibody detection by day post-inoculation (dpi): fluorescent focus neutralization (FFN) versus high-throughput neutralization test (HTNT).
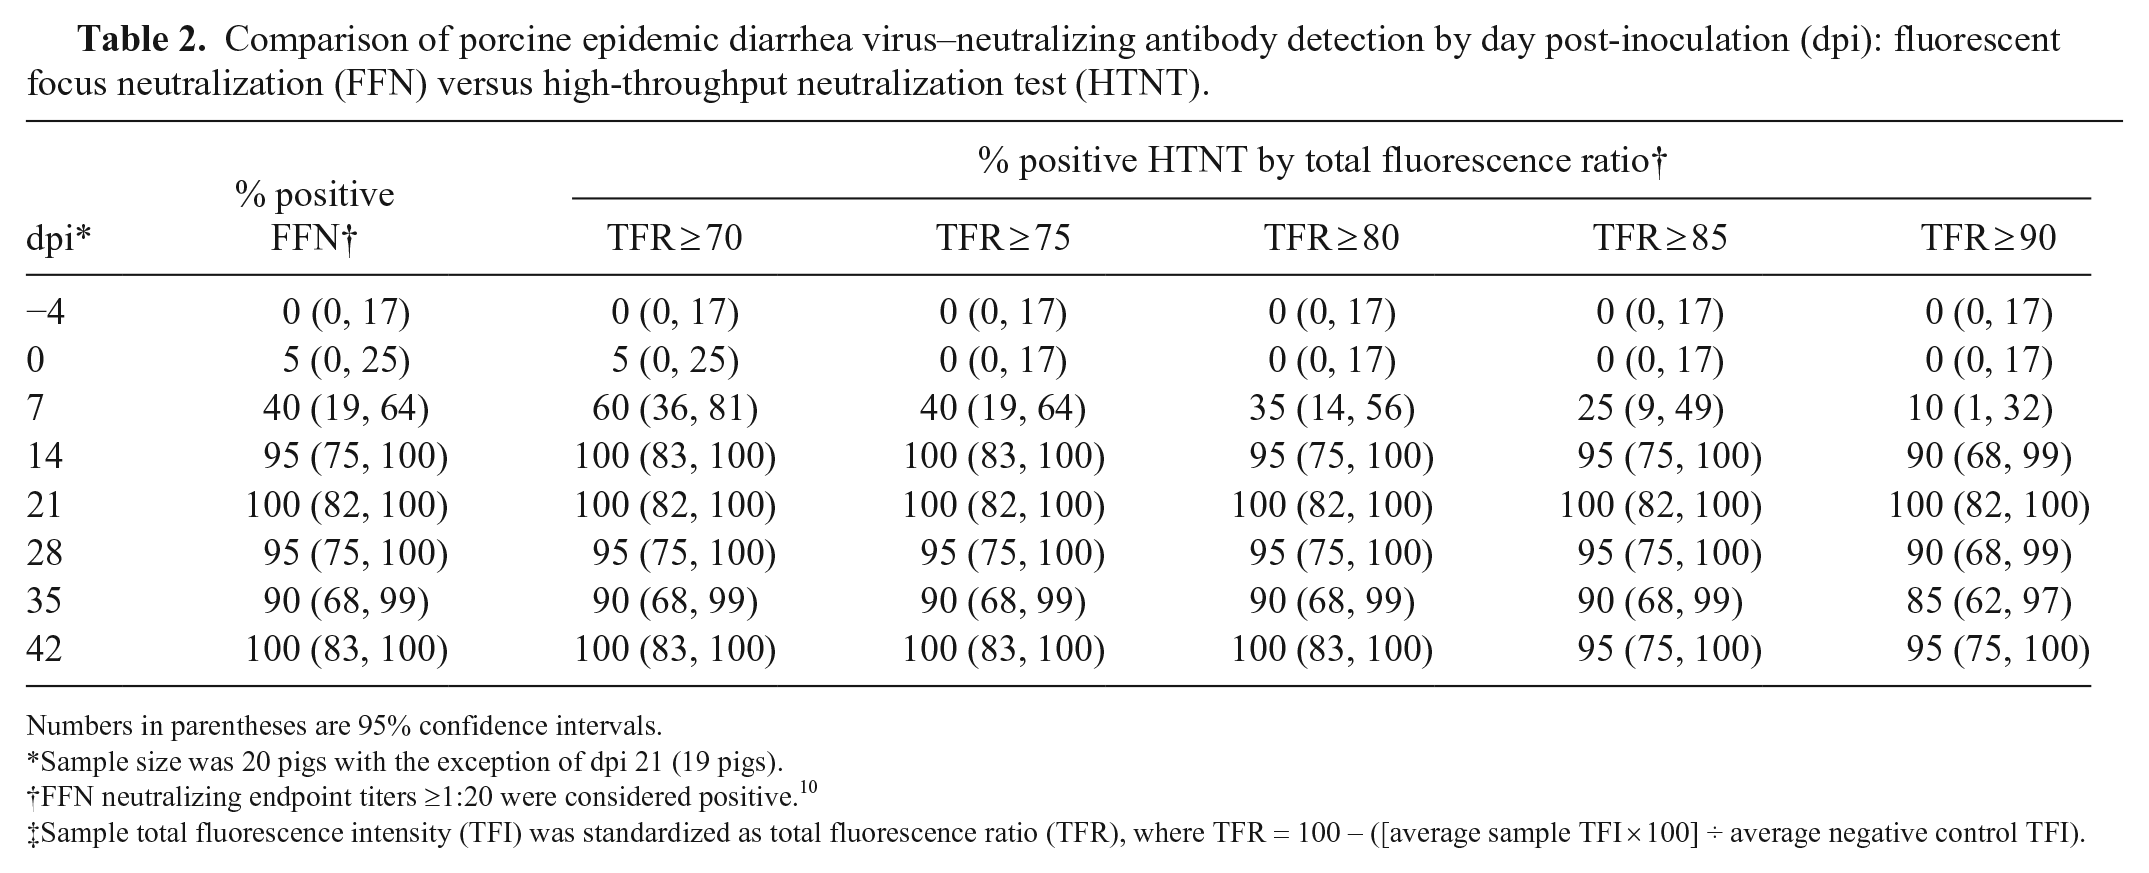
Numbers in parentheses are 95% confidence intervals.
Sample size was 20 pigs with the exception of dpi 21 (19 pigs).
FFN neutralizing endpoint titers ≥1:20 were considered positive. 10
Sample total fluorescence intensity (TFI) was standardized as total fluorescence ratio (TFR), where TFR = 100 – ([average sample TFI × 100] ÷ average negative control TFI).
Imaging cytometry–based systems applied to the detection of neutralizing antibody have the capacity to visualize and measure cells, quantify reactions, and capture and store data or images. In the HTNT PEDV assay, a high-throughput imaging cytometer was used to standardize cell confluency, read reactions, and evaluate plate controls. Standardized read protocols and calculations based on objective measurements removed human subjectivity and variability from the testing process and reduced the read-time of a 96-well plate to < 4 min. Thus, imaging cytometry could provide a more objective, rapid, and semi-automated approach to the detection of neutralizing antibody for a variety of pathogens.
Footnotes
Declaration of conflicting interests
The authors declare no potential conflicts of interest with respect to the research, authorship, and/or publication of this article.
Funding
The authors received no financial support for the research, authorship, and/or publication of this article.