
Abstract
Respiratory and intestinal diseases in pigs can have significant negative influence on productivity and animal welfare. A wide range of real-time PCR (rtPCR) assays are used in our laboratory (National Veterinary Institute, Technical University of Denmark) for pathogen detection, and PCR analyses are performed on traditional rtPCR platforms in which a limited number of samples can be analyzed per day given limitations in equipment and personnel. To mitigate these restrictions, rtPCR assays have been optimized for the high-throughput rtPCR BioMark platform (Fluidigm). Using this platform, we developed a high-throughput detection system that can be used for simultaneous examination of 48 samples with detection specificity for 18 selected respiratory and enteric viral and bacterial pathogens of high importance to Danish pig production. The rtPCR assays were validated and optimized to run under the same reaction conditions using a BioMark 48.48 dynamic array (DA) integrated fluidic circuit chip, and the sensitivity and specificity were assessed by testing known positive samples. Performance of the 48.48DA was similar to traditional rtPCR analysis, and the specificity of the 48.48DA was high. Application of the high-throughput platform has resulted in a significant reduction in cost and working hours and has provided production herds with a new innovative service with the potential to facilitate the optimal choice of disease control strategies such as vaccination and treatment.
Introduction
Respiratory and intestinal diseases are of major importance in commercial pig production throughout the world given that these diseases can result in major economic losses from reduced productivity, decreased animal welfare, increased mortality or morbidity, and increased use of antimicrobials. The cause of disease can be single or multifactorial. The prevalence and combination of pathogens can fluctuate between countries and herds, and can change over time as a result of change in management, environmental changes, season, or stage of infection.12,14,15,32,43
Pathogens involved in the porcine respiratory disease complex (PRDC) include bacteria such as Actinobacillus pleuropneumoniae, Bordetella bronchiseptica, Haemophilus parasuis, Mycoplasma hyopneumoniae, Mycoplasma hyorhinis, Pasteurella multocida, and Streptococcus suis. Viral agents of PRDC include porcine circovirus 2 (PCV-2; family Circoviridae, genus Circovirus, species Porcine circovirus 2), porcine cytomegalovirus (PCMV; family Herpesviridae, genus Roseolovirus, species Suid betaherpesvirus 2), porcine reproductive and respiratory syndrome viruses 1 and 2 (PRRSV-1, −2; family Arteriviridae, genus Betaarterivirus, species Betaarterivirus suid 1 and 2), and influenza A virus (IAV; family Orthomyxoviridae, genus Alphainfluenzavirus, species Influenza A virus). Many of the respiratory pathogens are ubiquitous, and it is common for multiple pathogens to circulate in a herd at any given time without causing disease.4,13,22,32,37,46 However, such respiratory pathogens may cause clinical signs, such as depression, anorexia, fever, nasal and ocular discharge, cough, hyperpnea, and even fatal pneumonia.18,32,45
Intestinal diseases can be induced by a number of different viruses, bacteria, and parasites, and are also considered to be a multifactorial problem. Diarrhea together with dehydration, reduced feed intake, reduced growth, and reduced nutrient digestibility are signs associated with intestinal disorders.8,14,17 Some of the bacteria found most frequently in association with intestinal disease in Danish pigs are Lawsonia intracellularis, Brachyspira pilosicoli, and Escherichia coli fimbria types F4 and F18.17,35,49 Viruses such as rotavirus A (RV-A; family Reoviridae, genus Rotavirus) and PCV-2 may also contribute to enteric disease. RV-A is a known diarrhea-causing agent in pigs. 3 PCV-2 has not been proven to be a primary cause of diarrhea in pigs, but systemic PCV-2 may indirectly contribute to enteric diseases because of its immunosuppressive effect.19,20,38 Coronaviruses such as transmissible gastroenteritis virus, porcine deltacoronavirus, and porcine epidemic diarrhea virus can also induce enteric diseases, but Denmark and many other European countries are free of these viruses. 36
The choice of suitable control measures such as vaccination and antimicrobial treatment are often based on clinical manifestations without support from laboratory investigations, which can lead to overuse of medication and suboptimal vaccination programs. The most important reason for the lack of laboratory analyses is high cost. Today, a range of different detection methods are used in veterinary laboratories. At the diagnostic laboratory of the National Veterinary Institute Technical University of Denmark (DTU vet), each year thousands of samples from Danish pigs are analyzed for the presence of pathogens using the real-time PCR (rtPCR) method. A wide range of rtPCR assays are used for pathogen detection, and the analyses are performed on traditional, or so-called low-throughput, rtPCR platforms. A major bottleneck of these platforms is the limited number of targets that can be tested simultaneously, and furthermore, these rtPCR analyses are expensive and resource demanding, both when it comes to reagents and cost of labor. Other PCR methods such as multiplex rtPCR and digital PCR (dPCR), which are some of the newest tools developed, can also be useful in the detection of pathogens. Multiplex rtPCR allows for simultaneous screening of several pathogens from a single sample given that several sets of specific primers and probes are used. Therefore, it can be a useful approach in diagnosis of disease complexes such as respiratory or enteric problems in pig herds. Furthermore, multiplex rtPCR is a more cost-effective and time-saving method compared to singleplex rtPCR. However, the number of available targets that can be tested in one run is limited because multiplex rtPCR is based on traditional rtPCR platforms, which have a limited number of channels. 52 Digital PCR is a novel PCR technology, which so far has been used only for porcine pathogen detection in a few published studies.51,54 It is a highly accurate and sensitive method that enables absolute quantification without the need of a standard curve. However, the dPCR machines and reagents are still expensive, hence, this technology is not a preferred tool in diagnostic laboratories at the moment. 26
We developed a high-throughput rtPCR detection system capable of detecting all relevant porcine viruses and bacteria in the same setup. For this, we used the microfluidic high-throughput rtPCR platform (BioMark; Fluidigm, South San Francisco, CA). The rtPCR reactions are carried out in dynamic array (DA) integrated fluidic circuit (IFC) nanofluidic chips, which contain fluidic networks that automatically combine the samples with the assays. The BioMark DA system allows users to combine either 48 samples with 48 assays (48.48DA), 96 samples with 96 assays (96.96DA), or 192 samples with 24 assays (192.24DA) resulting in 2,304, 9,216, or 4,608 individual reactions in a single run. The samples and rtPCR reagents are loaded into appertaining inlets in the DA IFC chip, and, by applying pressure, these are then distributed into the reaction chambers via microfluidic channels prior to the rtPCR reaction. 40 We designed a 48.48DA-containing rtPCR assay that can differentiate between the different swine IAV subtypes circulating in Danish pigs. 11 The BioMark system has also been used as a screening and detection tool for food- and water-borne pathogens and for tick-borne diseases.16,30 These previous studies found the system to offer sensitive as well as specific detection of miscellaneous pathogens.
We describe herein the design, optimization, and validation of a detection system using the 48.48DA, which consists of 21 rtPCR assays targeting 18 selected respiratory and enteric viral and bacterial pathogens of high importance to Danish pig production. Furthermore, we compared the performance of the BioMark platform to the performance of the Rotor-Gene Q rtPCR platform (Qiagen, Hilden, Germany), which is the system used to date in the diagnostic laboratory of the DTU vet in Denmark.
Materials and methods
Samples
Known positive samples (controls) for each of the 18 selected pathogens were used for optimization and initial validation of the 48.48DA. The positive controls consisted of cell culture lysates (viruses), pure bacterial cultures, vaccine strains, and plasmids. The positive controls were obtained from the routine diagnostic laboratory at the DTU vet. Virus isolates were initially confirmed by culturing and/or sequencing; bacterial isolates were validated using culturing and/or PCR and sequencing. Furthermore, 89 field samples (oral fluid, fecal sock, lung and liver tissue samples) from routine submissions to the DTU vet were used for validation of the 48.48DA. These samples came from pig herds with a history of respiratory or intestinal disease and had been tested for pathogens in the routine setting at the DTU vet.
RNA and DNA extraction
Viral RNA was extracted from cultured viruses, oral fluid, lung tissue, or nasal swab samples (RNeasy mini kit; Qiagen) according to the manufacturer’s instructions using the large sample protocol version 2 on the QIAcube (Qiagen) extraction robot. Cell culture supernatant, oral fluid, and nasal swab samples were prepared by mixing 200 µL of the sample with 400 µL of RLT buffer (Qiagen) containing β-mercaptoethanol (MilliporeSigma, St. Louis, MO). Lung tissue samples were prepared by homogenization of 70 mg of lung tissue in 1.4 mL of RLT buffer containing β-mercaptoethanol on a TissueLyser II (Qiagen) at 30 Hz for 3 min. The homogenate was centrifuged for 3 min at 12,000 × g, and RNA was extracted from 600 µL of the supernatant. Positive and negative (nuclease-free water; Amresco, Cleveland, OH) controls were included for each extraction. Viral RNA was eluted in 60 µL of RNase-free water and stored at −80°C.
Viral and bacterial DNA were extracted from oral fluid and lung or liver tissue samples (QIAamp DNA mini kit; Qiagen) according to the manufacturer’s instructions using the tissue standard protocol version 1 on the QIAcube (Qiagen) extraction robot. Oral fluid samples were prepared by centrifugation of 200 µL of sample at 100 × g for 3 min, followed by 10-fold dilution in nuclease-free water. Lung and liver tissue samples were prepared by homogenization of 180 mg of lung tissue in 1.3 mL of ATL buffer on a TissueLyser II for 3 min. The homogenate was centrifuged for 3 min at 12,000 × g, and 200 µL of the supernatant was mixed with 20 µL of proteinase K and incubated for 10 min at 56°C. DNA was eluted in 200 µL of AE buffer and stored at −20°C. Positive and negative (nuclease-free water; Amresco) controls were included for each extraction.
Samples of 10% feces in phosphate-buffered saline were extracted (QIAsymphony SP extraction robot, QIAsymphony DSP virus/pathogen mini kit; Qiagen) following the manufacturer’s instructions. The protocol was Complex200_V5_DSP with an elution volume of 110 µL. Before extraction, one 5-mm steel bead was added to each sample, and the samples were homogenized in a TissueLyser II (Qiagen) for 20 s at 15 Hz. The homogenate was then centrifuged for 90 sec at 6,700 × g, and 350 µL of the supernatant was used for nucleic acid extraction. Positive and negative (nuclease-free water; Amresco) controls were included for each extraction. The nucleic acid extracts were stored at −80°C until further analysis.
Primer and probe design
The 48.48DA was designed to include 21 rtPCR assays primarily targeting respiratory and enteric viral and bacterial pathogens (Tables 1, 2). The primer and probe sequences were from previously published assays or designed for our study. Some of the published primer and probe sequences were slightly modified to improve their specificities, and the fluorophore and/or quencher were changed for some of the assays as well (Tables 1, 2). Furthermore, for the PCV-2 and PPV assays, the detection chemistry was changed from primer/probe energy transfer to dual-labeled probe chemistry to match the remaining assays. New primer and probe sequences were designed based on alignments comprising full-length or nearly full-length sequences of target gene for the selected pathogen. Sequences used for the alignments were retrieved from GenBank 31 and aligned using CLC Main Workbench v.7.7.3 (Qiagen). Oligonucleotide specificity was tested in silico using BLAST search. 1 Melting temperature and basic properties of the oligonucleotides were approximated using OligoCalc. 21 The primer and probe sequences were purchased from Eurofins Genomics (Ebersberg, Germany) and stored at −20°C. The sensitivity and specificity of each rtPCR assay were validated based on a 10-fold serial dilution range of positive controls (Table 3) on the Rotor-Gene Q rtPCR platform (Qiagen).
Viruses, assay names, and primer and probe sequences used for detection of viruses.
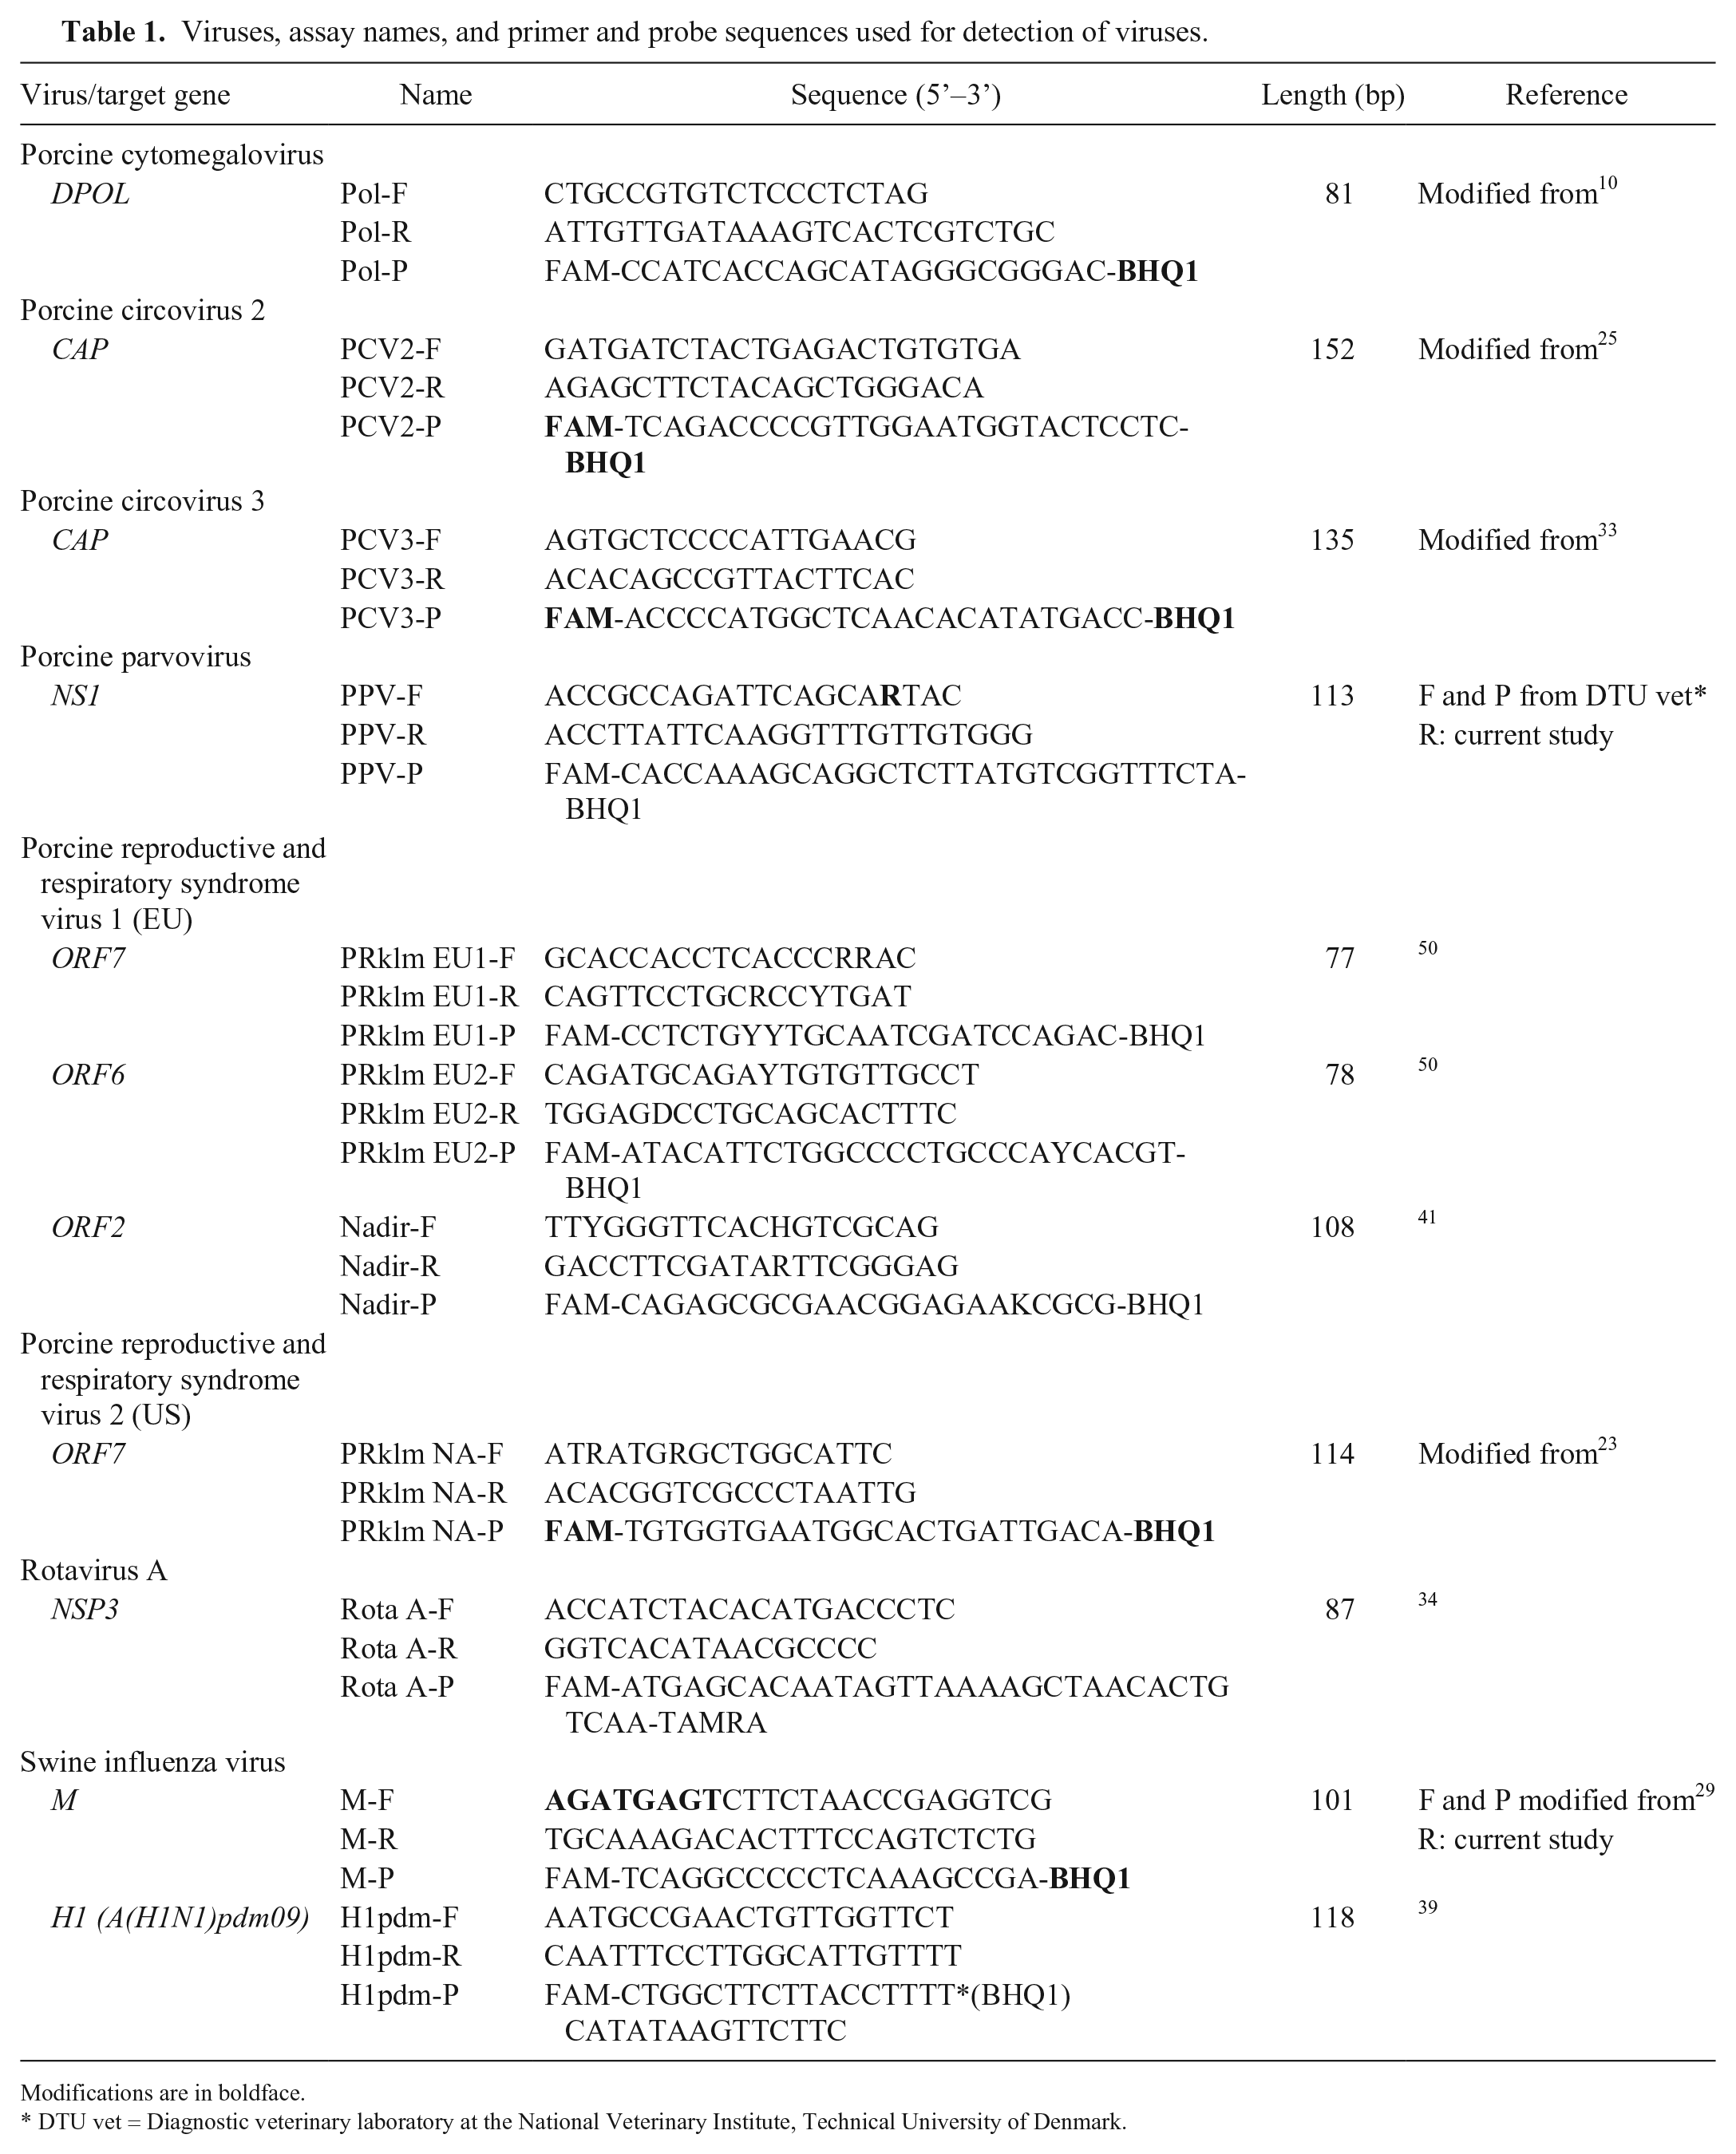
Modifications are in boldface.
DTU vet = Diagnostic veterinary laboratory at the National Veterinary Institute, Technical University of Denmark.
Bacteria, assay names, and primer and probe sequences used for detection of bacteria.
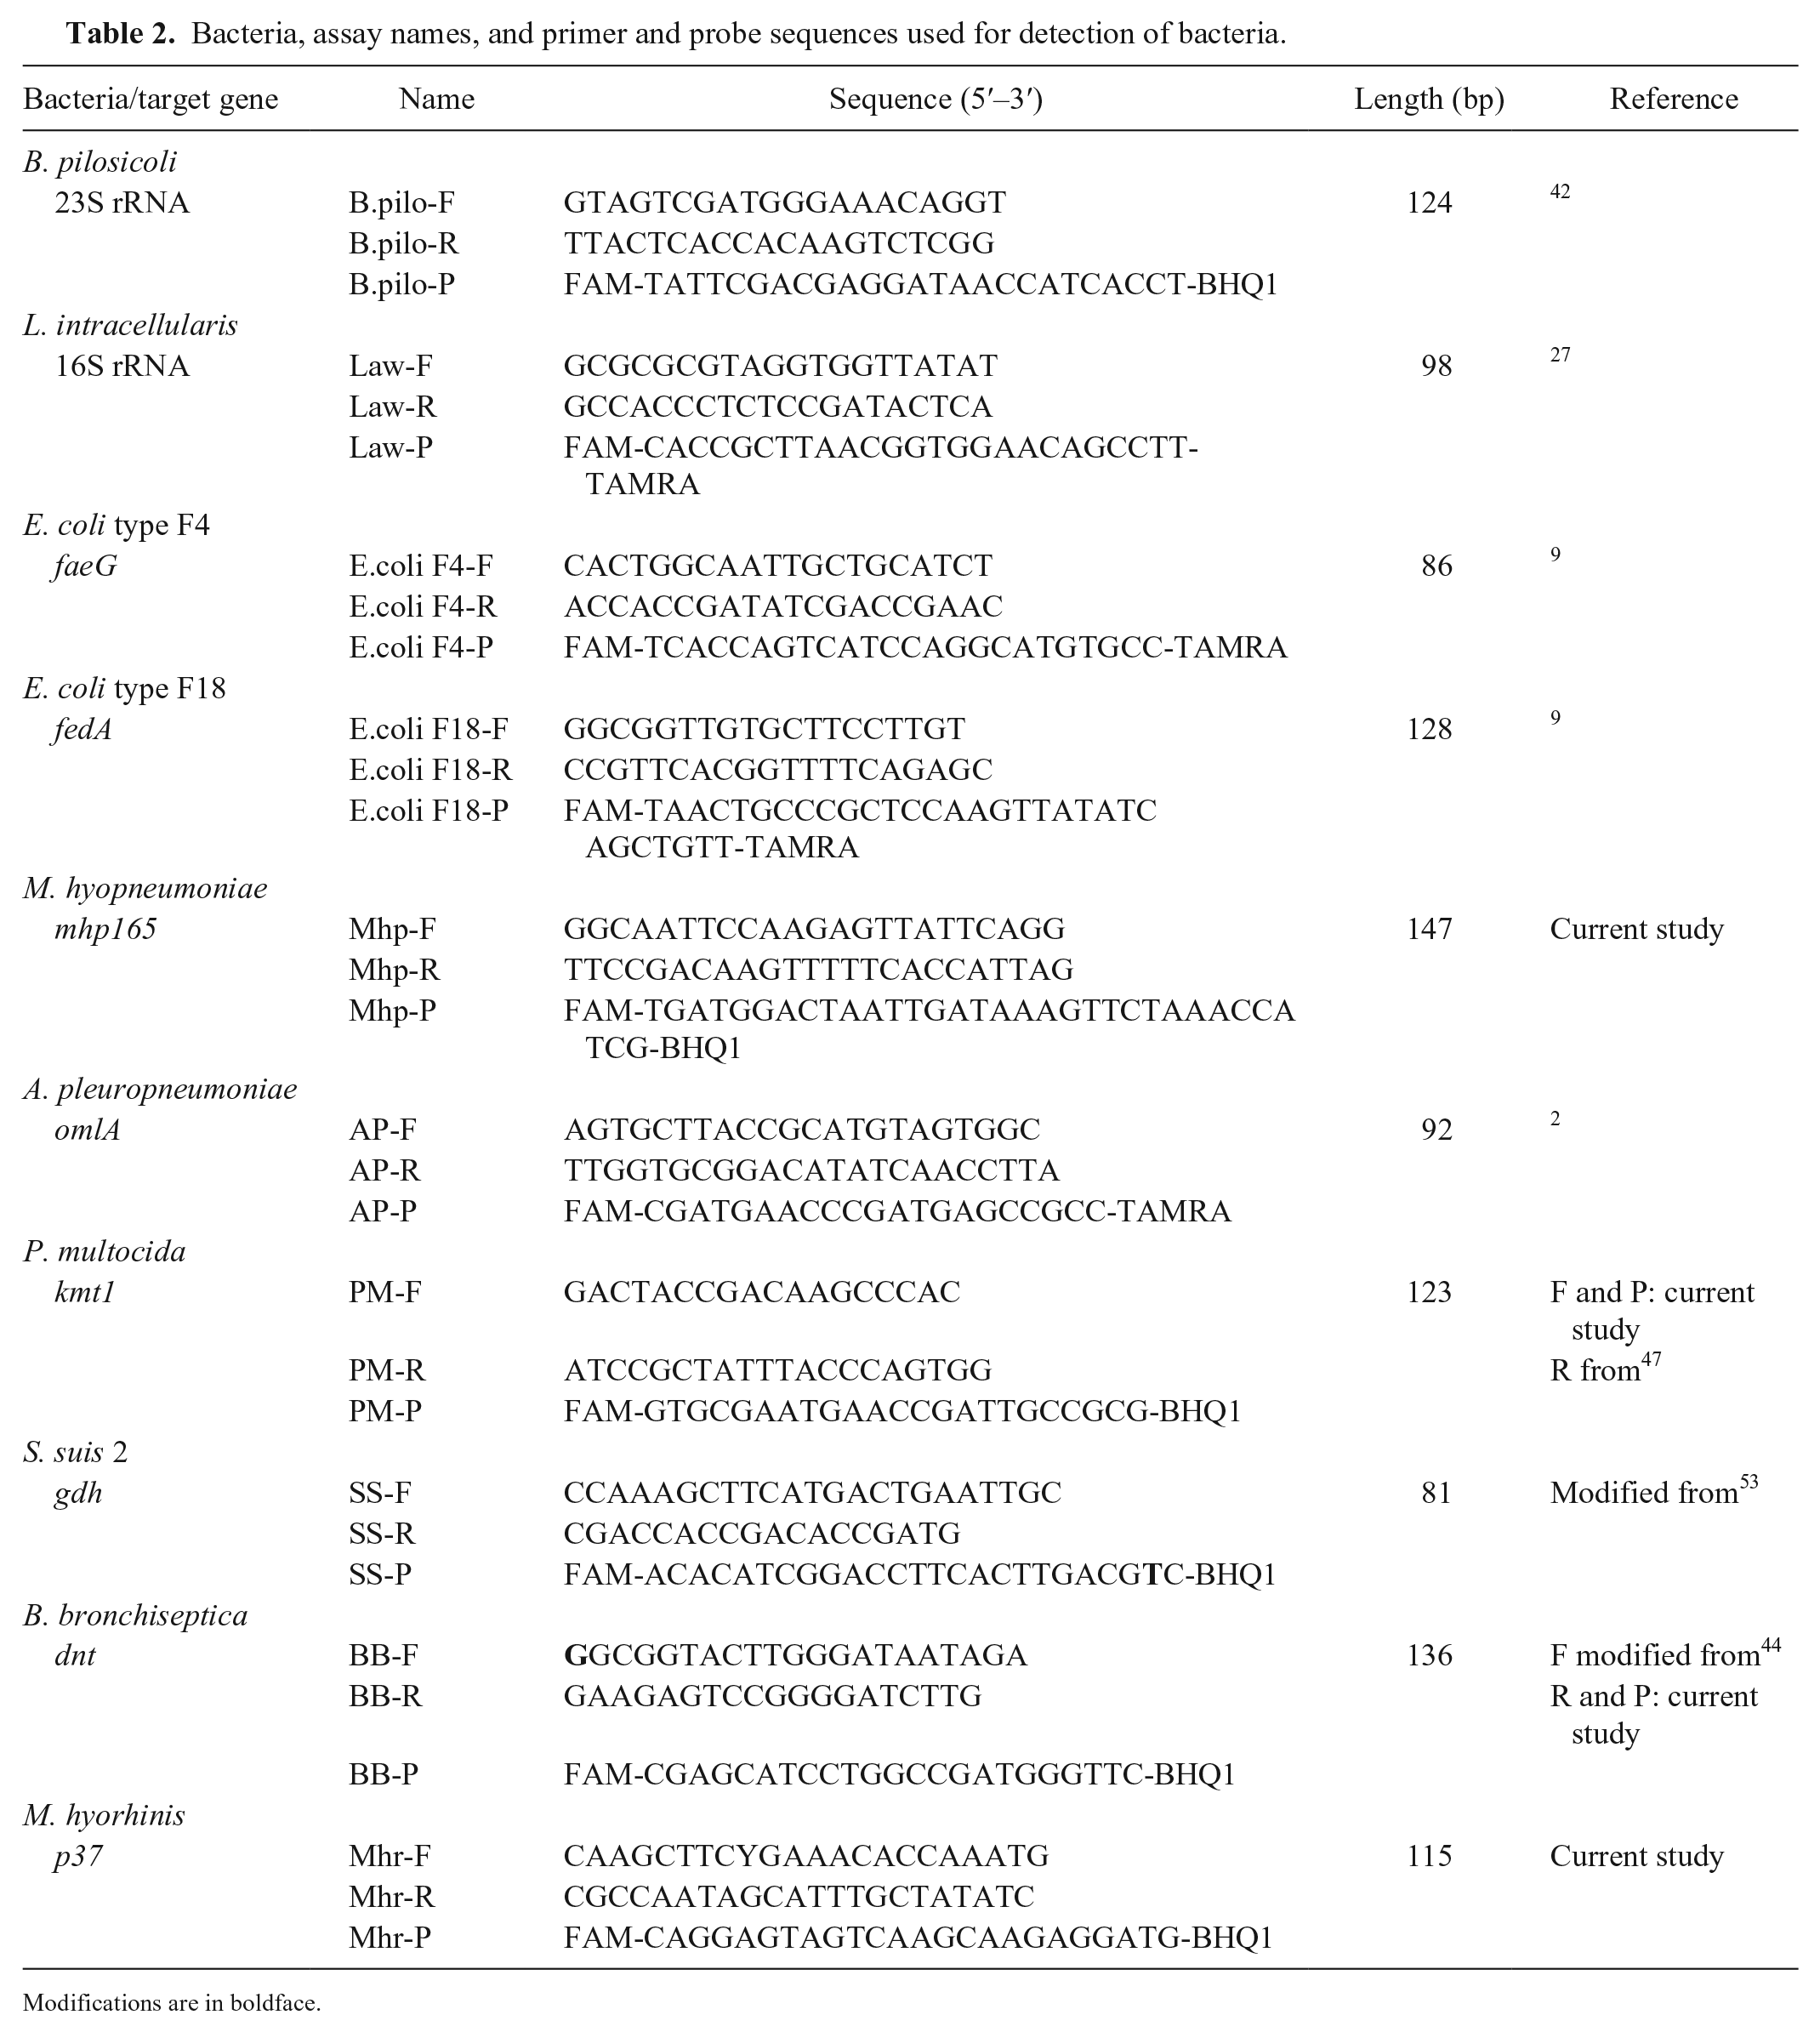
Modifications are in boldface.
Analytical sensitivity and amplification efficiency of real-time PCR assays on the Rotor-Gene Q and BioMark platforms.
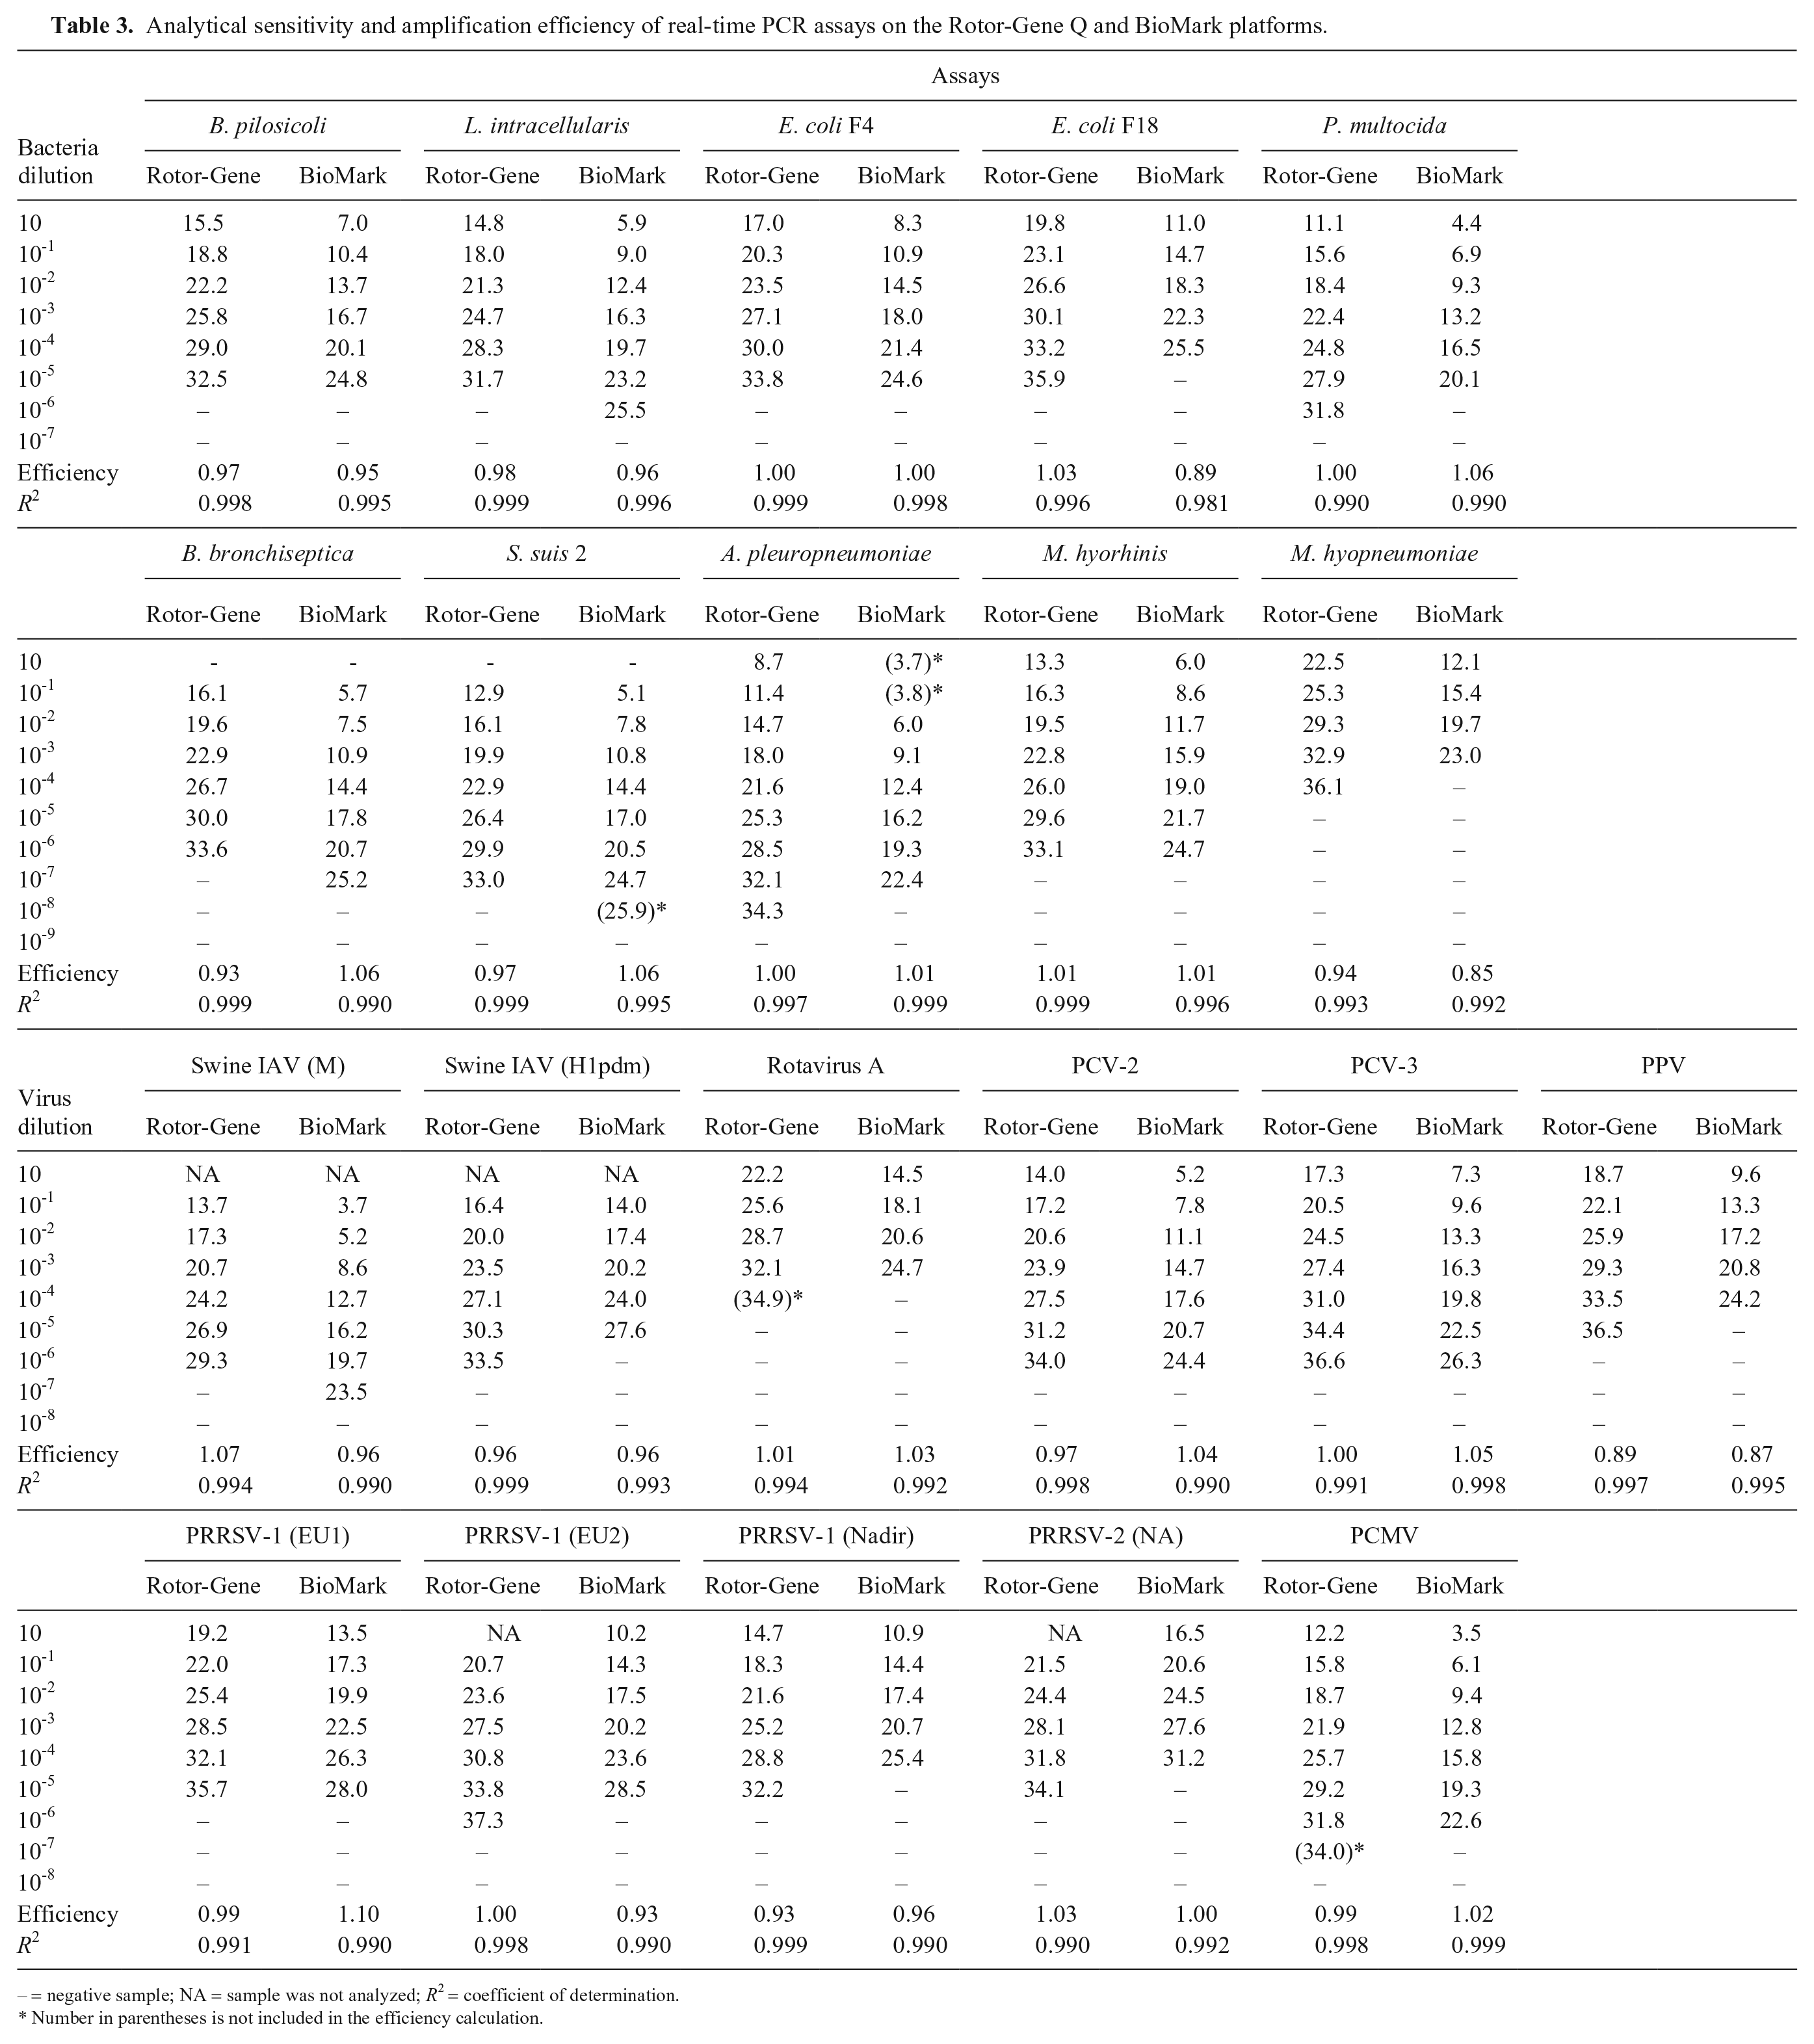
– = negative sample; NA = sample was not analyzed; R2 = coefficient of determination.
Number in parentheses is not included in the efficiency calculation.
Traditional rtPCR on the Rotor-Gene Q platform
Assays targeting RNA viruses
For RNA targets, different master mixes and PCR conditions were tested during the initial validations. The reverse-transcription (RT)-rtPCR assay specific for RV-A was performed in a final volume of 15 µL (AgPath-ID one-step RT-PCR reagents kit; Applied Biosystems, Foster City, CA) with 3 µL of RNA; 7.5 µL of RT-PCR buffer (2×) was mixed with 0.12 µL of each primer (50 µM), 0.18 µL of probe (10 µM), 0.6 µL of RT-PCR enzyme mix (25×), and nuclease-free water. The thermal cycling conditions were 45°C for 10 min, 95°C for 10 min, followed by 48 cycles at 95°C for 15 s, and 60°C for 45 s. The fluorescence signal was acquired at the 60°C step in the green channel (470–510 nm).
The RT-rtPCR assay specific for IAV was performed in a final volume of 25 µL (OneStep RT-PCR kit; Qiagen), with 5 µL of OneStep RT-PCR buffer (5×), 1 µL of dNTP mix (10 mM), 1.25 µL of MgCl2 (25 mM), 1 µL of each primer (100 µM), 0.25 µL of probe (30 µM), 1 µL of Qiagen enzyme mix, 2 µL of RNA, and nuclease-free water. Thermal cycling conditions were: 50°C for 30 min, 95°C for 15 min, followed by 40 cycles at 94°C for 10 s, 54°C for 30 s, and 72°C for 10 s. The fluorescence signal was acquired at the 54°C step in the green channel (470–510 nm).
The PRRSV-specific RT-rtPCR assays were performed in a final volume of 25 µL (OneStep RT-PCR kit) with 2 µL of RNA. The mixes consisted of 5 µL of OneStep RT-PCR buffer (5×), 1 µL of dNTP mix (10 mM each), 0.75 µL of each primer (10 µM), 0.50 µL of probe (10 µM), 1 µL of Qiagen enzyme mix, and nuclease-free water. The thermal cycling conditions were: 50°C for 30 min, 95°C for 15 min, followed by 45 cycles at 94°C for 15 s, 60°C for 60 s, and 72°C for 10 s. The fluorescence signal was acquired at the 60°C step in the green channel (470–510 nm).
Data obtained from each of the above-mentioned assays were analyzed (Rotor-Gene Q series software v.2.3.1; Qiagen) with the following parameter adjustments: dynamic tube normalization, on; noise slope correction, on; ignore first cycle; outlier removal, 10%; cycle threshold (Ct) fixed, 0.01. All reactions were run in duplicate together with positive and negative controls.
Assays targeting DNA viruses and bacteria
For the DNA targets (except for porcine circovirus 3 [PCV-3]), the rtPCR assays were performed in a final volume of 25 µL (JumpStart Taq ready mix; MilliporeSigma) with 3 µL of DNA. The PCR mixes for L. intracellularis, B. pilosicoli, E. coli F4, and E. coli F18 were prepared as described previously. 42 The PCR mixes for the remaining DNA targets contained 12.5 µL of JumpStart Taq ready mix (2×), 0.75 µL of each primer (10 µM), 0.21 µL of probe (30 µM), 3.5 µL of MgCl2 (25 mM), and nuclease-free water. All amplifications were run at the same cycling conditions: 94°C for 2 min, followed by 40 cycles of 94°C for 15 s, and 60°C for 60 s. The PCV-3 rtPCR assay was performed in a final volume of 25 µL with 2.5 µL of AmpliTaq Gold buffer (10×; Applied Biosystems), 0.5 µL of dNTPs (10 mM), 2.5 µL of MgCl2 (25 mM), 0.75 µL of each primer (10 µM), 0.5 µM of probe (10 µM), 0.25 µL of AmpliTaq Gold DNA polymerase (5 U/µL; Applied Biosystems), nuclease-free water, and 3 µL of DNA. The cycling conditions were: 94°C for 10 min, followed by 45 cycles at 94°C for 15 s, and 60°C for 60 s; the fluorescence signal was acquired at the 60°C step in the green channel (470–510 nm). Data obtained from each of the above-mentioned assays were analyzed (Rotor-Gene Q series software v.2.3.1; Qiagen) with the following parameter adjustments: dynamic tube normalization, on; noise slope correction, on; ignore first cycle; outlier removal, 10%; Ct fixed, 0.01. All reactions were run in duplicate with positive and negative controls.
Data, including Ct values and amplification curves, were analyzed using the Rotor-Gene Q series software v.2.3.1 (Qiagen). The amplification efficiency was calculated for each rtPCR assay based on the slope of the standard curve, as described previously. 5
Reverse-transcription and pre-amplification prior to high-throughput rtPCR
We prepared a 200-nM primer mix containing the various sets of primers (20 μM; Tables 1, 2). For RNA targets, reverse-transcription and pre-amplification were performed in a final volume of 25 µL (AgPath-ID one-step RT-PCR reagents kit; Applied Biosystems), in which 12.5 µL of 2× RT-PCR buffer was mixed with 1 µL of 50 µM random hexamer (Invitrogen, Carlsbad, CA), 1.25 µL of primer mix (200 nM), 1 µL of 25× RT-PCR enzyme mix, 6.25 µL of nuclease-free water, and 3 µL of RNA. One-tube combined reverse-transcription and pre-amplification was performed (T3 thermocycler; Biometra, Fredensborg, Denmark) with the following thermal cycling conditions: 20 min at 45°C, 10 min at 95°C, followed by 24 cycles at 94°C for 15 s, and 60°C for 45 s. The pre-amplified complementary DNA (cDNA) was stored at −20°C.
For pre-amplification of DNA targets, we used master mix (TaqMan PreAmp; Applied Biosystems) following the manufacturer’s instructions. The reaction was performed in a final volume of 10 µL containing 5 µL of master mix, 2.5 µL of primer mix (200 nM), and 2.5 µL of DNA. Pre-amplification was performed (T3 thermocycler; Biometra) with the following thermal cycling conditions: 95°C for 10 min, followed by 14 cycles at 95°C for 15 s, and 60°C for 4 min. The pre-amplified DNA was stored at −20°C.
High-throughput rtPCR
For high-throughput rtPCR amplification, we used the BioMark 48.48DA IFC chip (Fluidigm). For each sample, we prepared a 6-µL sample mix containing 3 µL of TaqMan gene expression master mix (Applied Biosystems), 0.3 µL of 20× sample loading reagent (Fluidigm), and 2.7 µL of pre-amplified sample. A primer/probe stock was prepared for each assay, and 3 µL of the stocks was mixed with 3 µL of 2× assay loading reagent (Fluidigm) to make assay mixes (final concentration: 16 µM primers and 5 µM probe). Prior to loading of the sample and assay mixes, the 48.48DA was primed in the IFC controller MX (Fluidigm); 4.9 µL of sample mix and 4.9 µL of assay mix, for each of the samples and assays, were dispensed into the sample and assay inlets, respectively, on the 48.48DA. The 48.48DA was placed in the IFC controller MX for loading and mixing. After ~55 min, the 48.48DA was ready for thermal cycling in the high-throughput rtPCR instrument (BioMark; Fluidigm) with the following cycling conditions: 94°C for 2 min, followed by 40 cycles of 94°C for 15 s, and 60°C for 60 s. Assays were performed in duplicate, and samples were tested in single reactions. Three positive controls, containing a mix of all of the positive controls included in the screening, 2 non-template controls (nuclease-free water; Amresco), a non-template cDNA/pre-amplification and a non-template pre-amplification control (nuclease-free water) were included in each 48.48DA IFC chip together with the positive and negative extraction controls.
Data, including Ct values and amplification curves, were acquired on the BioMark system and analyzed (Real-time PCR analysis software v.4.1.3; Fluidigm). Amplification efficiency was calculated for each rtPCR assay based on the slope of the standard curve, as described previously. 5
Validation of the 48.48DA
The analytical sensitivity, specificity, and amplification efficiency of the rtPCR assays were validated by running a 10-fold serial dilution for each of the positive control samples on the 48.48DA. The performance of the 48.48DA was validated by testing 89 field samples (DNA or RNA extracted from oral fluid, fecal sock, lung and liver tissue samples), which were previously tested by RT-rtPCR and/or rtPCR on the Rotor-Gene Q platform in the diagnostic laboratory at the DTU vet. The repeatability of the rtPCR assays was assessed by comparing the outcome of 9–29 repeated tests of the same samples.
Statistical analysis
The kappa statistic was used for comparison of the detection results from the high-throughput rtPCR BioMark platform and the Rotor-Gene Q platform and for determination of their level of agreement. 48 The analyses were performed by using the analysis tool 2by2.xls (kappa; www.itve.dk).
Results
Specificity of the rtPCR assays
Initially, the positive controls were run on the 48.48DA without pre-amplification resulting in lack of detection by the BioMark system for the majority of the samples. Consequently, an initial step of pre-amplification was added to the setup, which enabled detection of all positive controls. The specificity of each rtPCR assay was assessed from the Ct value and the corresponding amplification curve obtained from their respective positive control. For all of the rtPCR assays, specific positive reactions were registered; however, the rtPCR assay specific for PPV cross-reacted with the PPRSV-1 positive control (Fig. 1). Theoretically, this cross-reaction could be the result of lack of specificity or coinfection of the sample, but because the positive control for PRRSV-1 was a vaccine strain, the cross-reaction may be explained by lack of specificity.
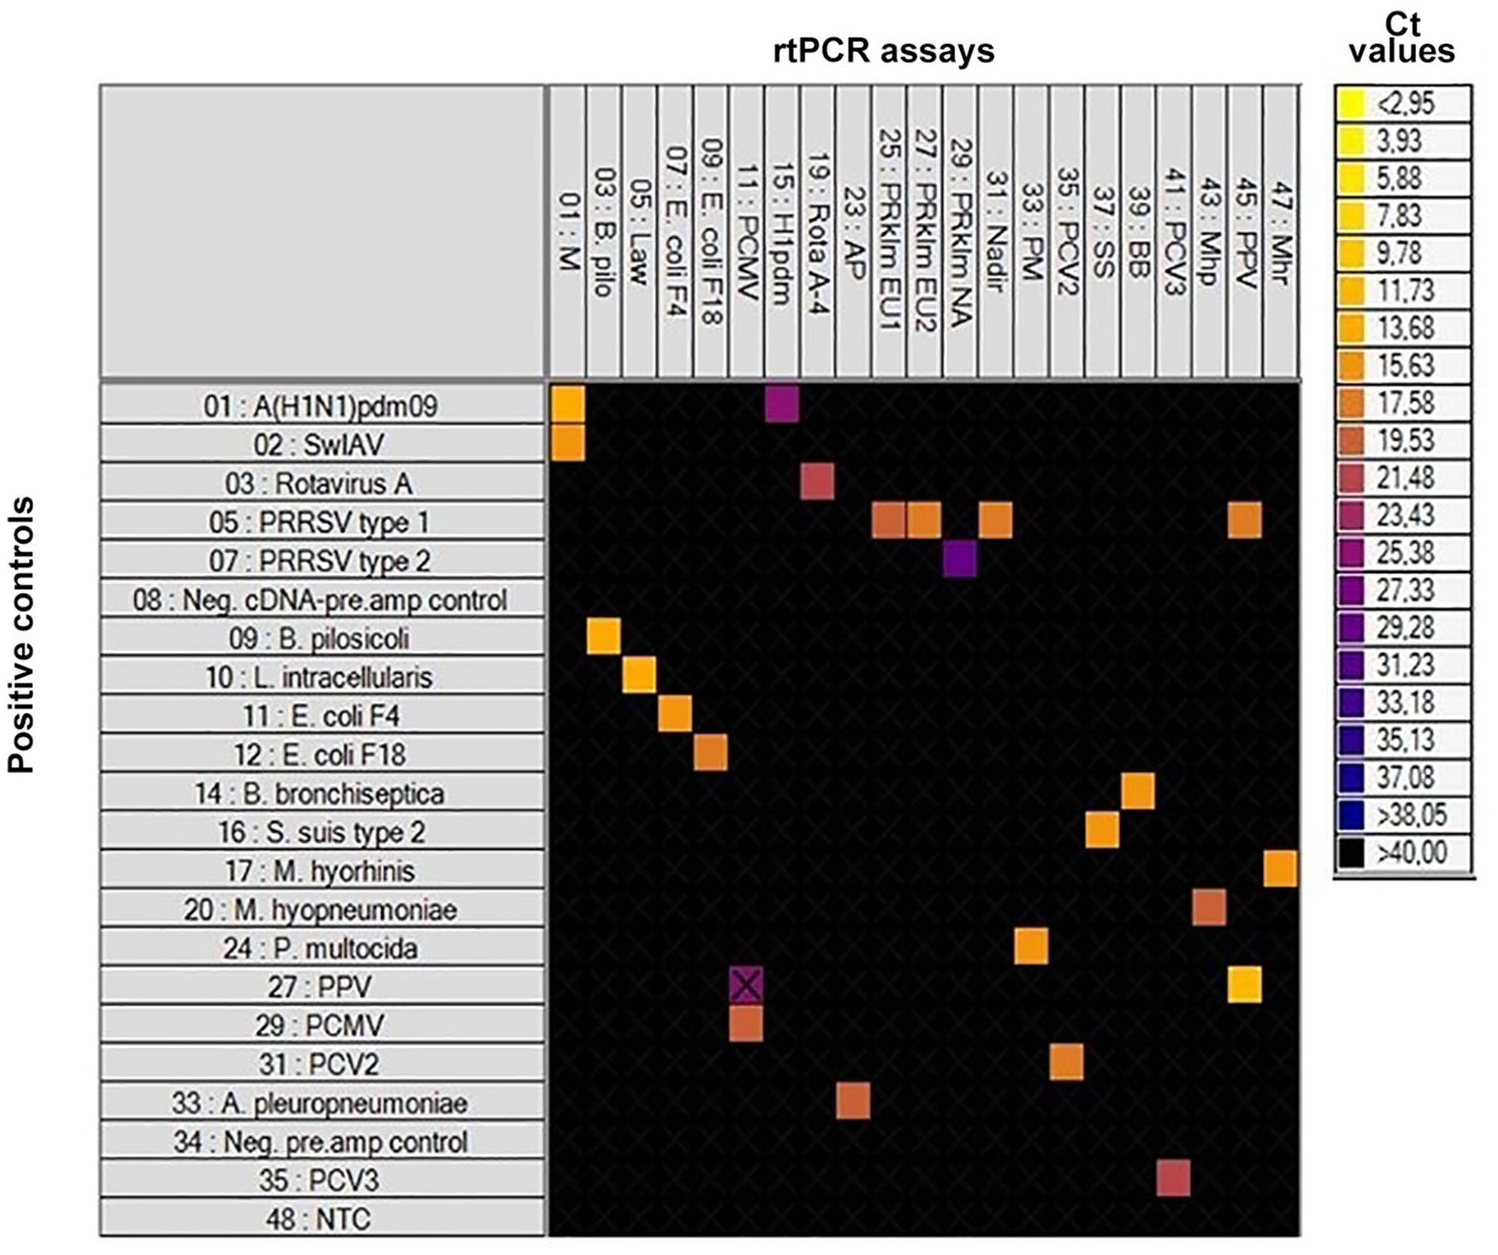
Heat map showing the specificity of the real-time PCR (rtPCR) assays included on the 48.48DA by testing known positive controls. At the top: rtPCR assays (Tables 1, 2). To the left: the positive controls, a no-template control (NTC), a negative cDNA/pre-amplification control, and a negative pre-amplification control. Each square corresponds to a single rtPCR reaction. Cycle threshold (Ct) values for each reaction are indicated by color; the corresponding color scale is presented in the legend on the right. A black square is considered a negative result. A black X is shown if the amplification curve deviates too much from an ideal amplification curve.
Analytical sensitivity and amplification efficiency of the rtPCR assays
The analytical sensitivity of the rtPCR assays was found to be in the range of 10-3–10-8 and was identical or had 1 log10 difference between the 2 platforms (Table 3). Similarly, the dynamic range of the rtPCR assays was either identical or differed by 1 log10. Furthermore, the amplification efficiency of the rtPCR assays was similar for the Rotor-Gene Q platform and the BioMark platform and was 89–107% and 85–110%, respectively (Table 3). For A. pleuropneumoniae, the undiluted and the first diluted sample were excluded from the calculation of efficiency on the BioMark platform given low Ct values. This exclusion also resulted in a shorter dynamic range compared to the dynamic range for the dilution series analyzed by the Rotor-Gene Q platform. For a few of the assays, the undiluted sample was not tested because of insufficient available sample.
Test of field samples on the 48.48DA
In general, the Ct values obtained by the 48.48DA were lower than the Ct values obtained on the Rotor-Gene Q platform, which is expected given the additional pre-amplification step. Thirty-six fecal sock samples, previously tested for L. intracellularis, B. pilosicoli, E. coli F4, and E. coli F18 using the Rotor-Gene Q platform, were tested on the 48.48DA. Nearly identical results were achieved for the rtPCR assays on the 2 platforms and, thus, comparison of the results also showed a high level of agreement with kappa values of 0.89–1.00 (Table 4). However, for 3 of the fecal samples, a difference between the 2 platforms was found (marked with bold in Table 4). Samples 13 and 18 were found to be positive in one assay using the Rotor-Gene Q test and negative in the same assay on the 48.48DA. Furthermore, sample 10 was found to be positive in another assay in the 48.48DA test and negative in the same assay using the Rotor-Gene Q test.
Comparison of fecal sock samples analyzed on the Rotor-Gene Q and BioMark platforms.
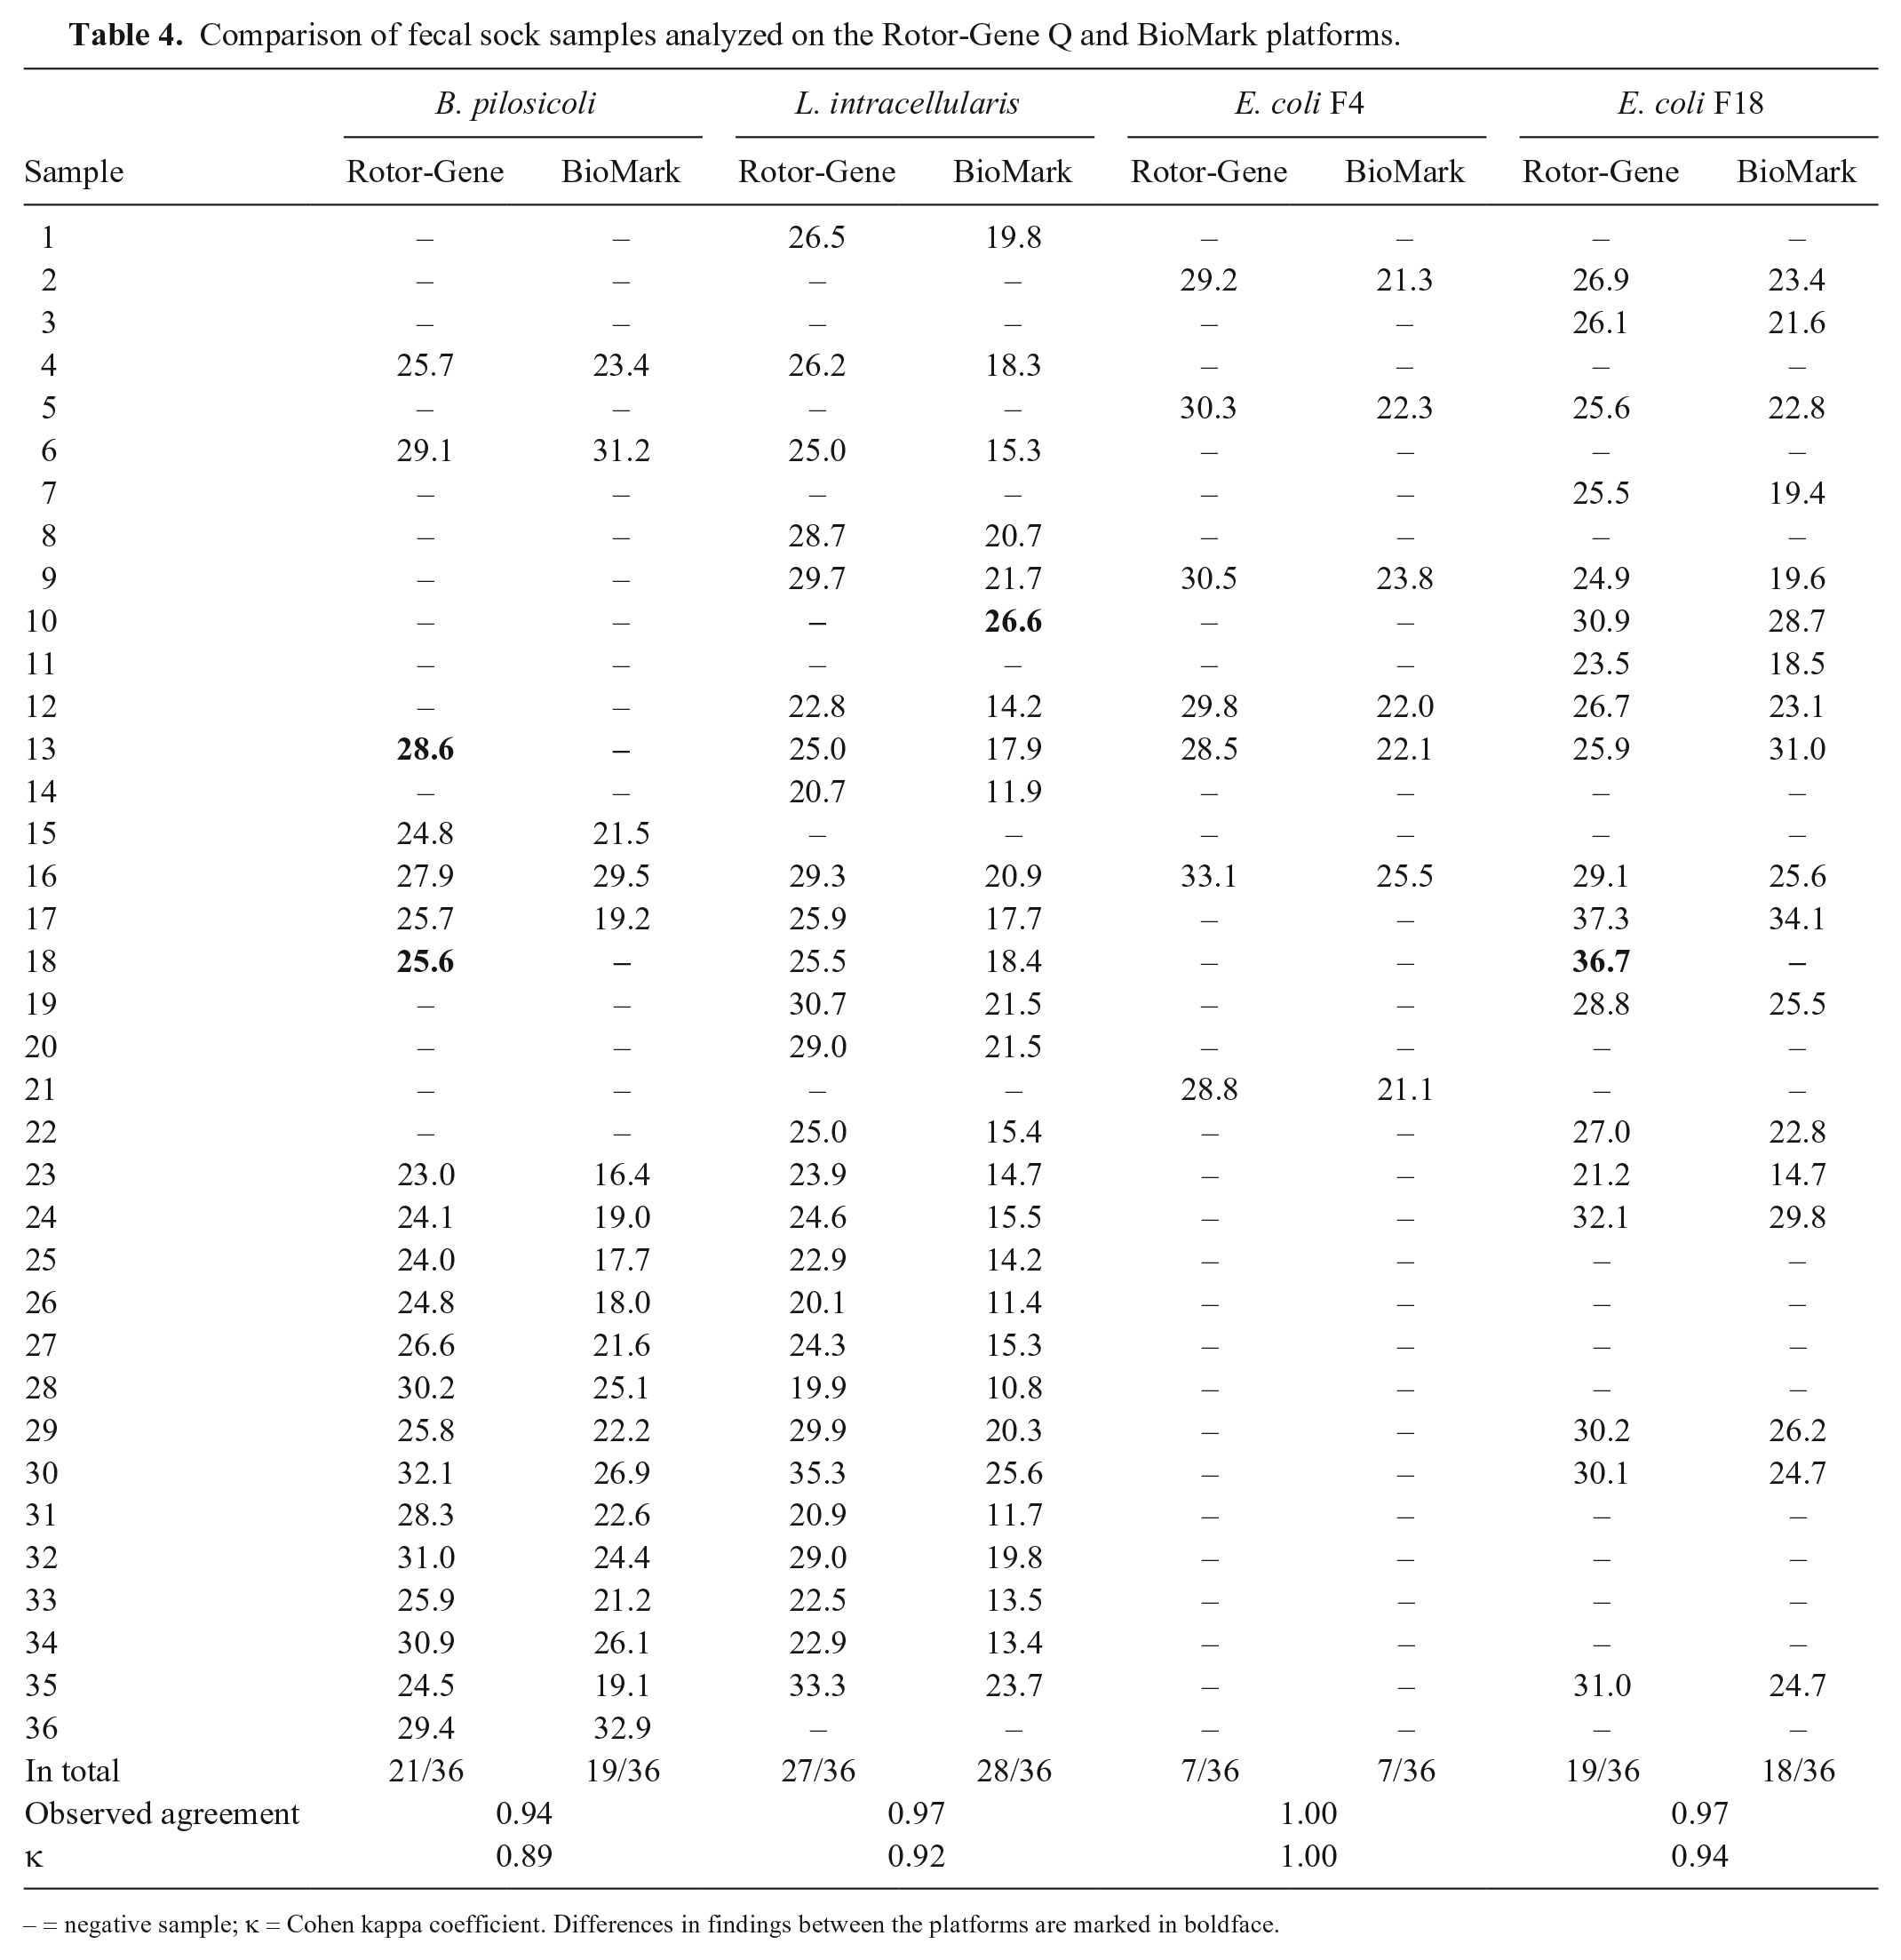
– = negative sample; κ = Cohen kappa coefficient. Differences in findings between the platforms are marked in boldface.
Fourteen oral fluid samples, which had been tested positive for either PCV-2 or IAV on the Rotor-Gene Q platform, were also tested on the 48.48DA, which gave the same result for each sample (data not shown). Furthermore, 36 lung tissue samples, which had previously been analyzed for other respiratory pathogens, were also tested on the 48.48DA. Comparison of the results obtained by the 2 rtPCR platforms showed a high level of agreement for the rtPCR assays specific for A. pleuropneumoniae (κ = 1.00), M. hyorhinis (κ = 0.93), and M. hyopneumoniae (κ = 1.00); a substantial level of agreement was found for the P. multocida rtPCR assay (κ = 0.64; Table 5). For the P. multocida analysis, results for 6 of the samples did not match. Five of these samples (52, 63, 64, 68, 70) were found to be either negative or only slightly positive in the analysis performed by the Rotor-Gene Q platform. The 48.48DA analysis found the samples that were negative by the Rotor-Gene analysis to be positive, but with a relative high Ct value, and it found the slightly positive samples to be negative. The last sample (51) of the 6 was strongly positive (Ct = 19.5) but was negative on the 48.48DA. For the M. hyorhinis analysis, one difference was observed. Here, sample 56 was positive by the Rotor-Gene analysis with a Ct of 32.5, whereas the 48.48DA analysis was negative. The results obtained for the rtPCR assays specific for A. pleuropneumoniae and M. hyopneumoniae were 100% identical for the 2 platforms. In addition to the respiratory and enteric samples, 3 fetal liver tissue samples, which had been tested positive for PPV, were also tested on the 48.48DA and were found to be strongly positive (Ct = 3–5; data not shown).
Comparison of lung tissue samples analyzed on the Rotor-Gene Q and BioMark platforms.
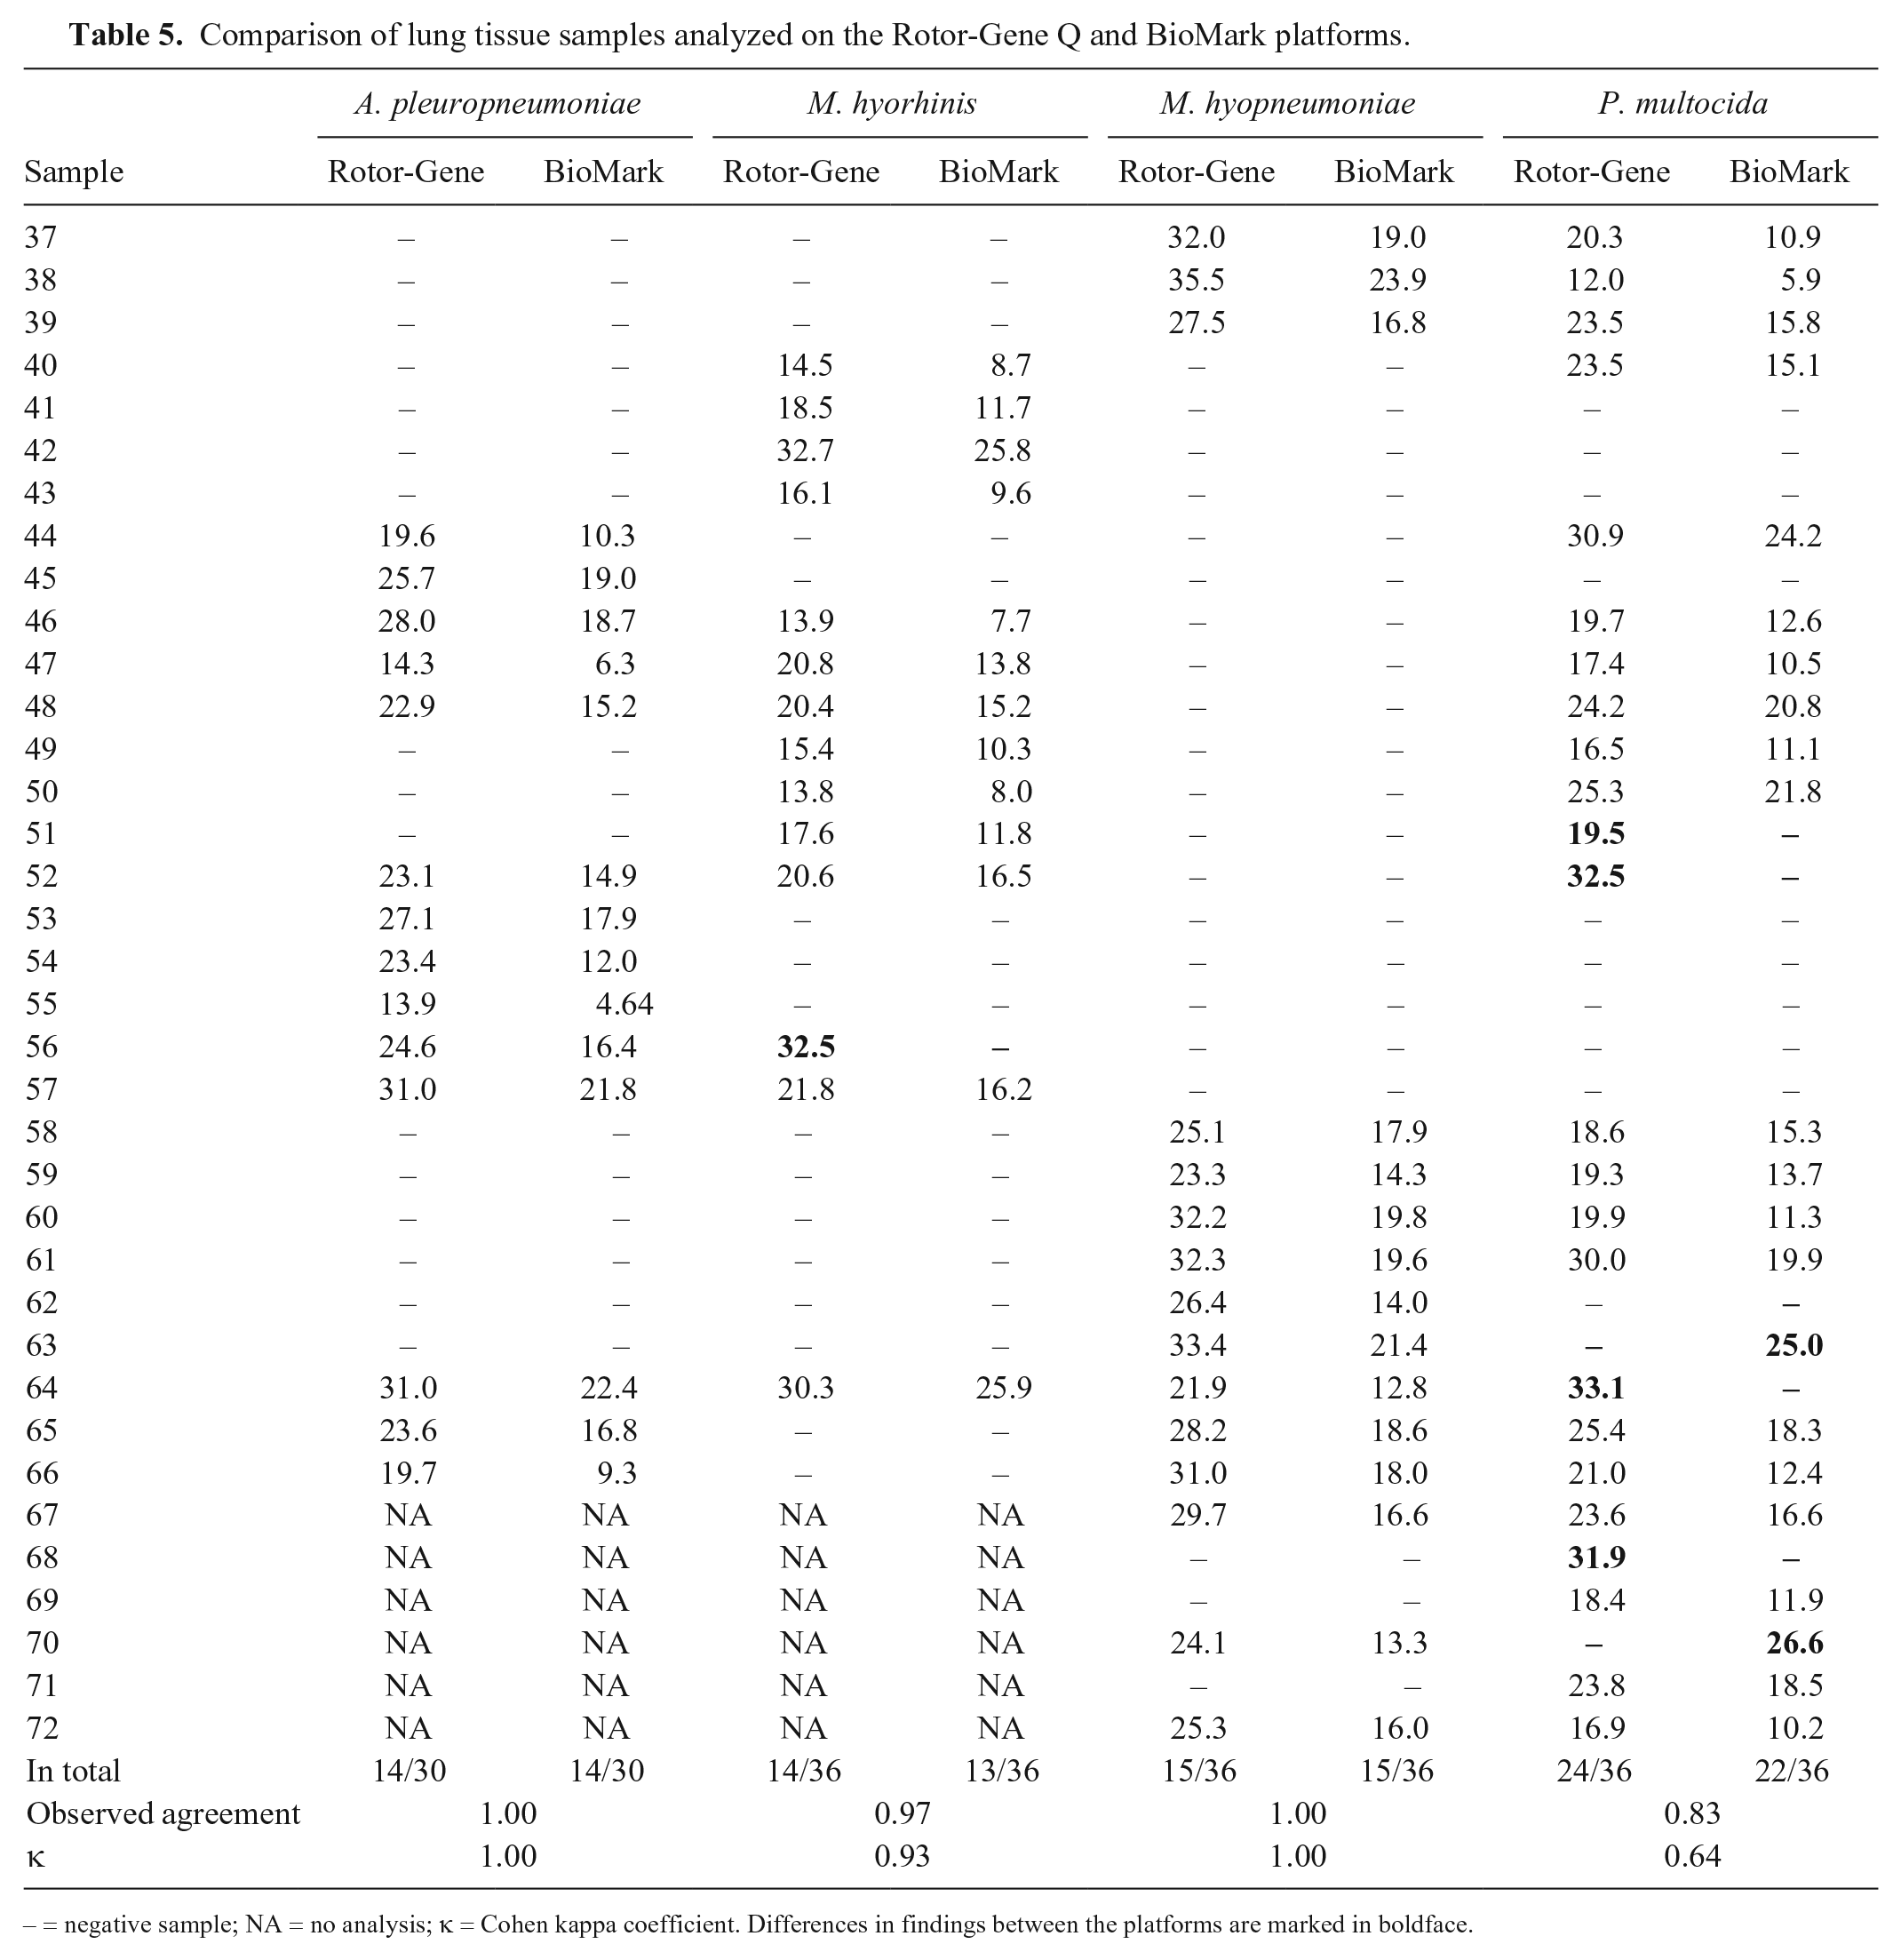
– = negative sample; NA = no analysis; κ = Cohen kappa coefficient. Differences in findings between the platforms are marked in boldface.
Test of repeatability of the 48.48DA
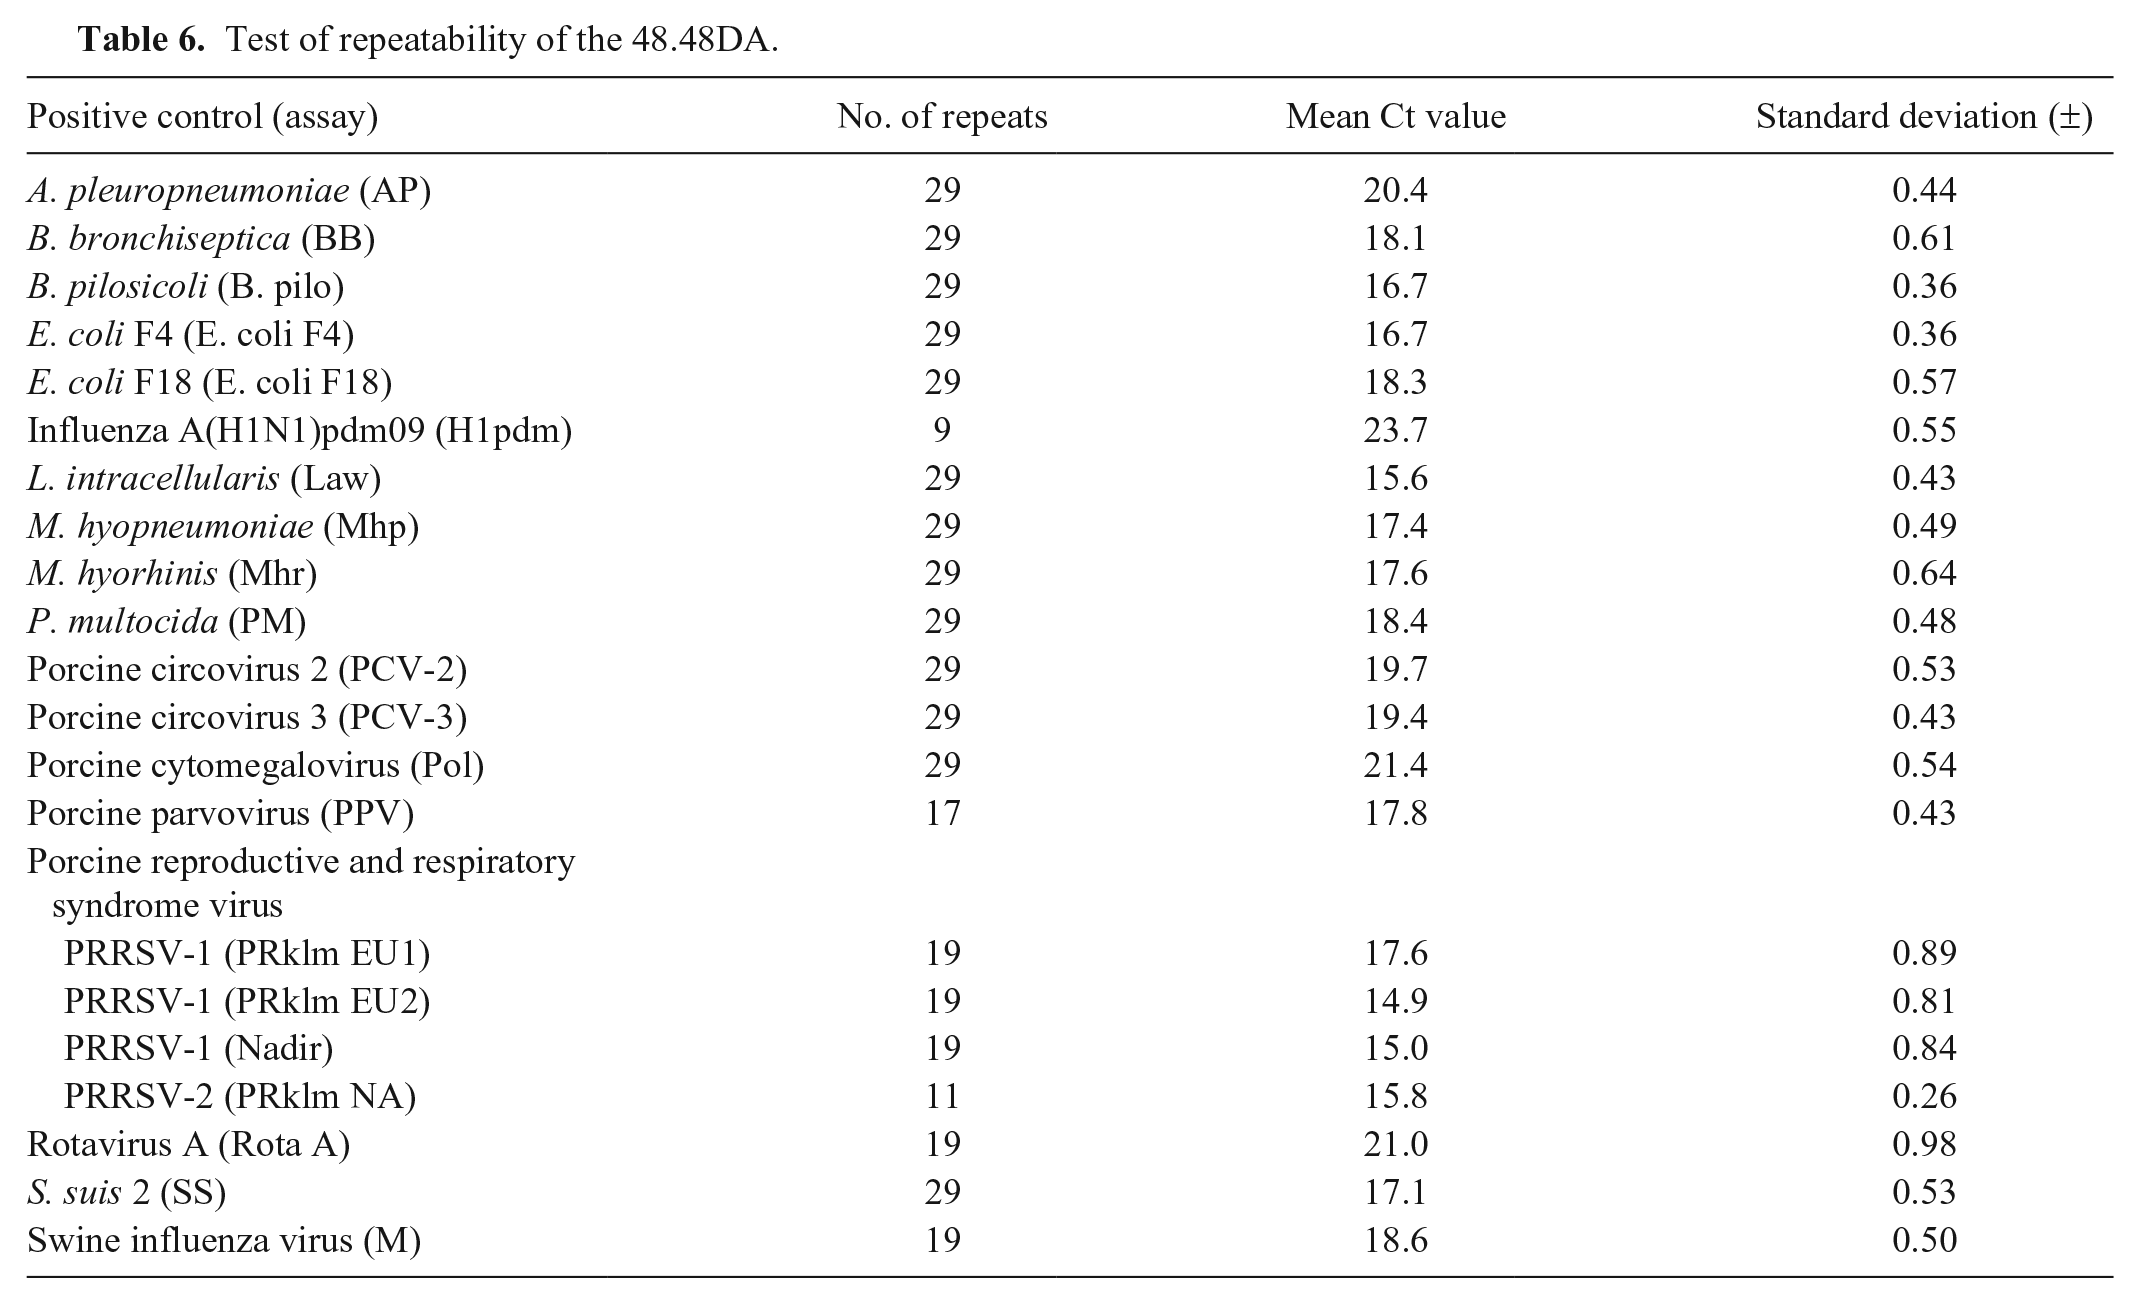
For validation of the repeatability of the 48.48DA, replicates of the positive controls were tested in 9–29 separate chip runs. The mean Ct value and standard deviation (SD) for each of the positive controls were calculated, and the SD was found to be <±1 for all positive controls (Table 6).
Test of repeatability of the 48.48DA.
Discussion
Our high-throughput rtPCR protocol for detection of respiratory and enteric viral and bacterial pathogens proved to be as specific and sensitive as traditional rtPCR. Our new approach enables the combination of multiple assays and multiple samples run simultaneously in a DA IFC nanofluidic chip. This method requires less reagent volume (nanoliter volumes) compared to traditional rtPCR methods, which require microliter volumes, thus increasing the cost of analysis given the use of larger amounts of expensive reagents. Furthermore, the setup and data analysis required for the traditional rtPCR platform is more time consuming than that required for the high-throughput rtPCR platform for the same number of samples and analyses.16,28
The validation of the 48.48DA with positive controls showed that pre-amplification of the samples was needed given the very small reaction volumes. 24 The need for pre-amplification is in accordance with recommendations from the supplier and other studies using the BioMark for detection of pathogens.16,30,40 We performed the pre-amplification of the target RNA and DNA in 2 different setups. The pre-amplification of DNA targets was performed according to supplier recommendations, whereas for RNA targets, the cDNA synthesis and pre-amplification setup was optimized to a 1-step procedure instead of the 2-step procedure, as described previously. 11
Performance of the rtPCR assays specific for the selected pathogens was initially evaluated on positive controls using both the high-throughput rtPCR and Rotor-Gene Q platforms. All of the rtPCR assays had acceptable PCR efficiency, and comparison of the assay performances on the 2 platforms revealed only minor differences in the dynamic range and efficiency for all of the assays. In the test of assay performance, only pre-amplified samples were used because it has been shown that the pre-amplification reaction causes no bias in relation to the non–pre-amplified samples. 16 Performance of the 48.48DA was further evaluated by testing field samples, which had previously been tested in the routine veterinary diagnostic laboratory. In general, there was a high level of agreement between the results provided by the diagnostic laboratory (Rotor-Gene Q platform) and the results generated by the 48.48DA. A similar platform conformity has been seen in other studies.16,40 The rtPCR assay specific for P. multocida showed the most discrepancies, but the affected samples, except for one, were only weakly positive. However, this assay should be validated further or redesigned.
When using the BioMark platform, there is a risk of false-negative results occurring for very positive samples. Having a very positive sample on the Rotor-Gene Q platform will result in an even lower Ct value on the BioMark platform as a result of pre-amplification. 24 Pre-amplification lowers the optimal range of quantifiable Ct values by ~8–12 cycles compared to traditional rtPCR cyclers. This is the result of the significant difference between the sample volume that comes in contact with the sample mix during the rtPCR reaction in the DA IFC chip compared to the traditional rtPCR tube.7,24 Consequently, the rtPCR assays will also have a lower cutoff value in the BioMark platform than in the Rotor-Gene Q platform, which also was the case in our study. In order to determine a cutoff value, the PCR results can be compared to a gold standard method. Because performance of a PCR test can vary between laboratories, cutoff values and results cannot be directly compared between studies. 6
The use of the 48.48DA for identification of respiratory and enteric viral and bacterial porcine pathogens provides new possibilities for veterinary laboratories. With this tool, it is possible to offer services with reduced costs and turnaround time, which may facilitate the correct choice of disease control strategies such as vaccines and promote a reduction in antimicrobial use. Our calculations reveal that full implementation and automation of the procedure can result in an analysis cost per sample <5% of the cost of traditional rtPCR, and thereby this tool can have great potential for surveillance of pathogens in production herds.
Footnotes
Acknowledgements
We thank Sofie Hagedorn Nielsen, Jonas Høgberg, Sari Mia Dose, and Hue Thi Thanh Tran for their help with maintenance of the samples used in the present study.
Declaration of conflicting interests
The authors declared no potential conflicts of interest with respect to the research, authorship, and/or publication of this article.
Funding
This study was supported by the Danish Pig Levy Fund.