
Abstract
Embryonating chicken eggs (ECEs) are among the most sensitive laboratory host systems for avian influenza virus (AIV) titration, but ECEs are expensive and require space for storage and incubation. Therefore, reducing ECE use would conserve resources. We utilized statistical modeling to evaluate the accuracy and precision of AIV titration with 3 instead of 5 ECEs for each dilution by the Reed–Muench method for 50% endpoint calculation. Beta-Poisson and exponential dose-response models were used in a simulation study to evaluate observations from actual titration data from 18 AIV isolates. The reproducibility among replicates of a titration was evaluated with one AIV isolate titrated in 3 replicates with the beta-Poisson, exponential, and Weibull dose-response models. The standard deviation (SD) of the error between input and estimated virus titers was estimated with Monte Carlo simulations using the fitted dose-response models. Good fit was observed with all models that were utilized. Reducing the number of ECEs per dilution from 5 to 3 resulted in the width of the 95% confidence interval increasing from ±0.64 to ±0.75 log10 50% ECE infectious doses (EID50) and the SD of the error increased by 0.03 log10 EID50. Our study suggests that using fewer ECEs per dilution is a viable approach that will allow laboratories to reduce costs and improve efficiency.
The most widely used procedures for titrating avian influenza virus (AIV; species Influenza A virus) utilize 5 embryonating chicken eggs (ECEs) per dilution to calculate mean ECE infectious dose (EID50) based on the method of Reed–Muench (RM). 11 Specific pathogen–free and specific antibody–negative ECEs are generally the preferred culture method for AIV because they are typically the most sensitive and permissive for AIV replication.7,8 However, ECEs are resource intensive because of cost and space requirements. Reducing the number of ECEs needed for AIV titration would reduce costs and increase efficiency.
To our knowledge, there are no published studies on the precision of virus concentration estimates using this method. The precision of virus concentration estimates depends on the number of ECEs used as well as the dose-response relationship between the virus and host system. In addition, although the RM method is commonly used to estimate virus titers because of its simplicity and a parametric dose-response curve is not assumed, very few studies have evaluated the variance of the estimated titers or appropriate numbers of samples per dilution. Brown derived formulas for estimating the variance of the RM calculation based on a propagation of error formula and binomial distribution, which is appropriate when the number of samples per dilution is large (i.e., >5). 3 A formula has been developed to approximate the variance of the RM estimate when the logistic dose-response model is appropriate. 10
Therefore, to determine how using 3 ECEs per dilution affects precision for titrating AIV, we fit datasets from real titrations into various parametric dose-response models. The dose-response models were then used to simulate the number of infected ECE at different serial dilutions and to estimate the precision of the virus concentration estimate (i.e., the standard deviation [SD] of the error between input and estimated virus concentration and width of the 95% confidence interval [CI]).
AIVs were obtained from the repository at the U.S. National Poultry Research Center, U.S. Department of Agriculture, Agricultural Research Service (Athens, GA). Eight low-pathogenic (LP) and 10 highly pathogenic isolates from both domestic and wild birds were included (Table 1). Each virus was titrated using standard methods as described 12 using 6 dilutions per isolate and 5 ECEs per dilution. In most of these experiments, the serial dilutions ranged from 10-4 to 10-9.
Dose-response model parameters and goodness-of-fit for avian influenza virus titration in embryonating chicken eggs.
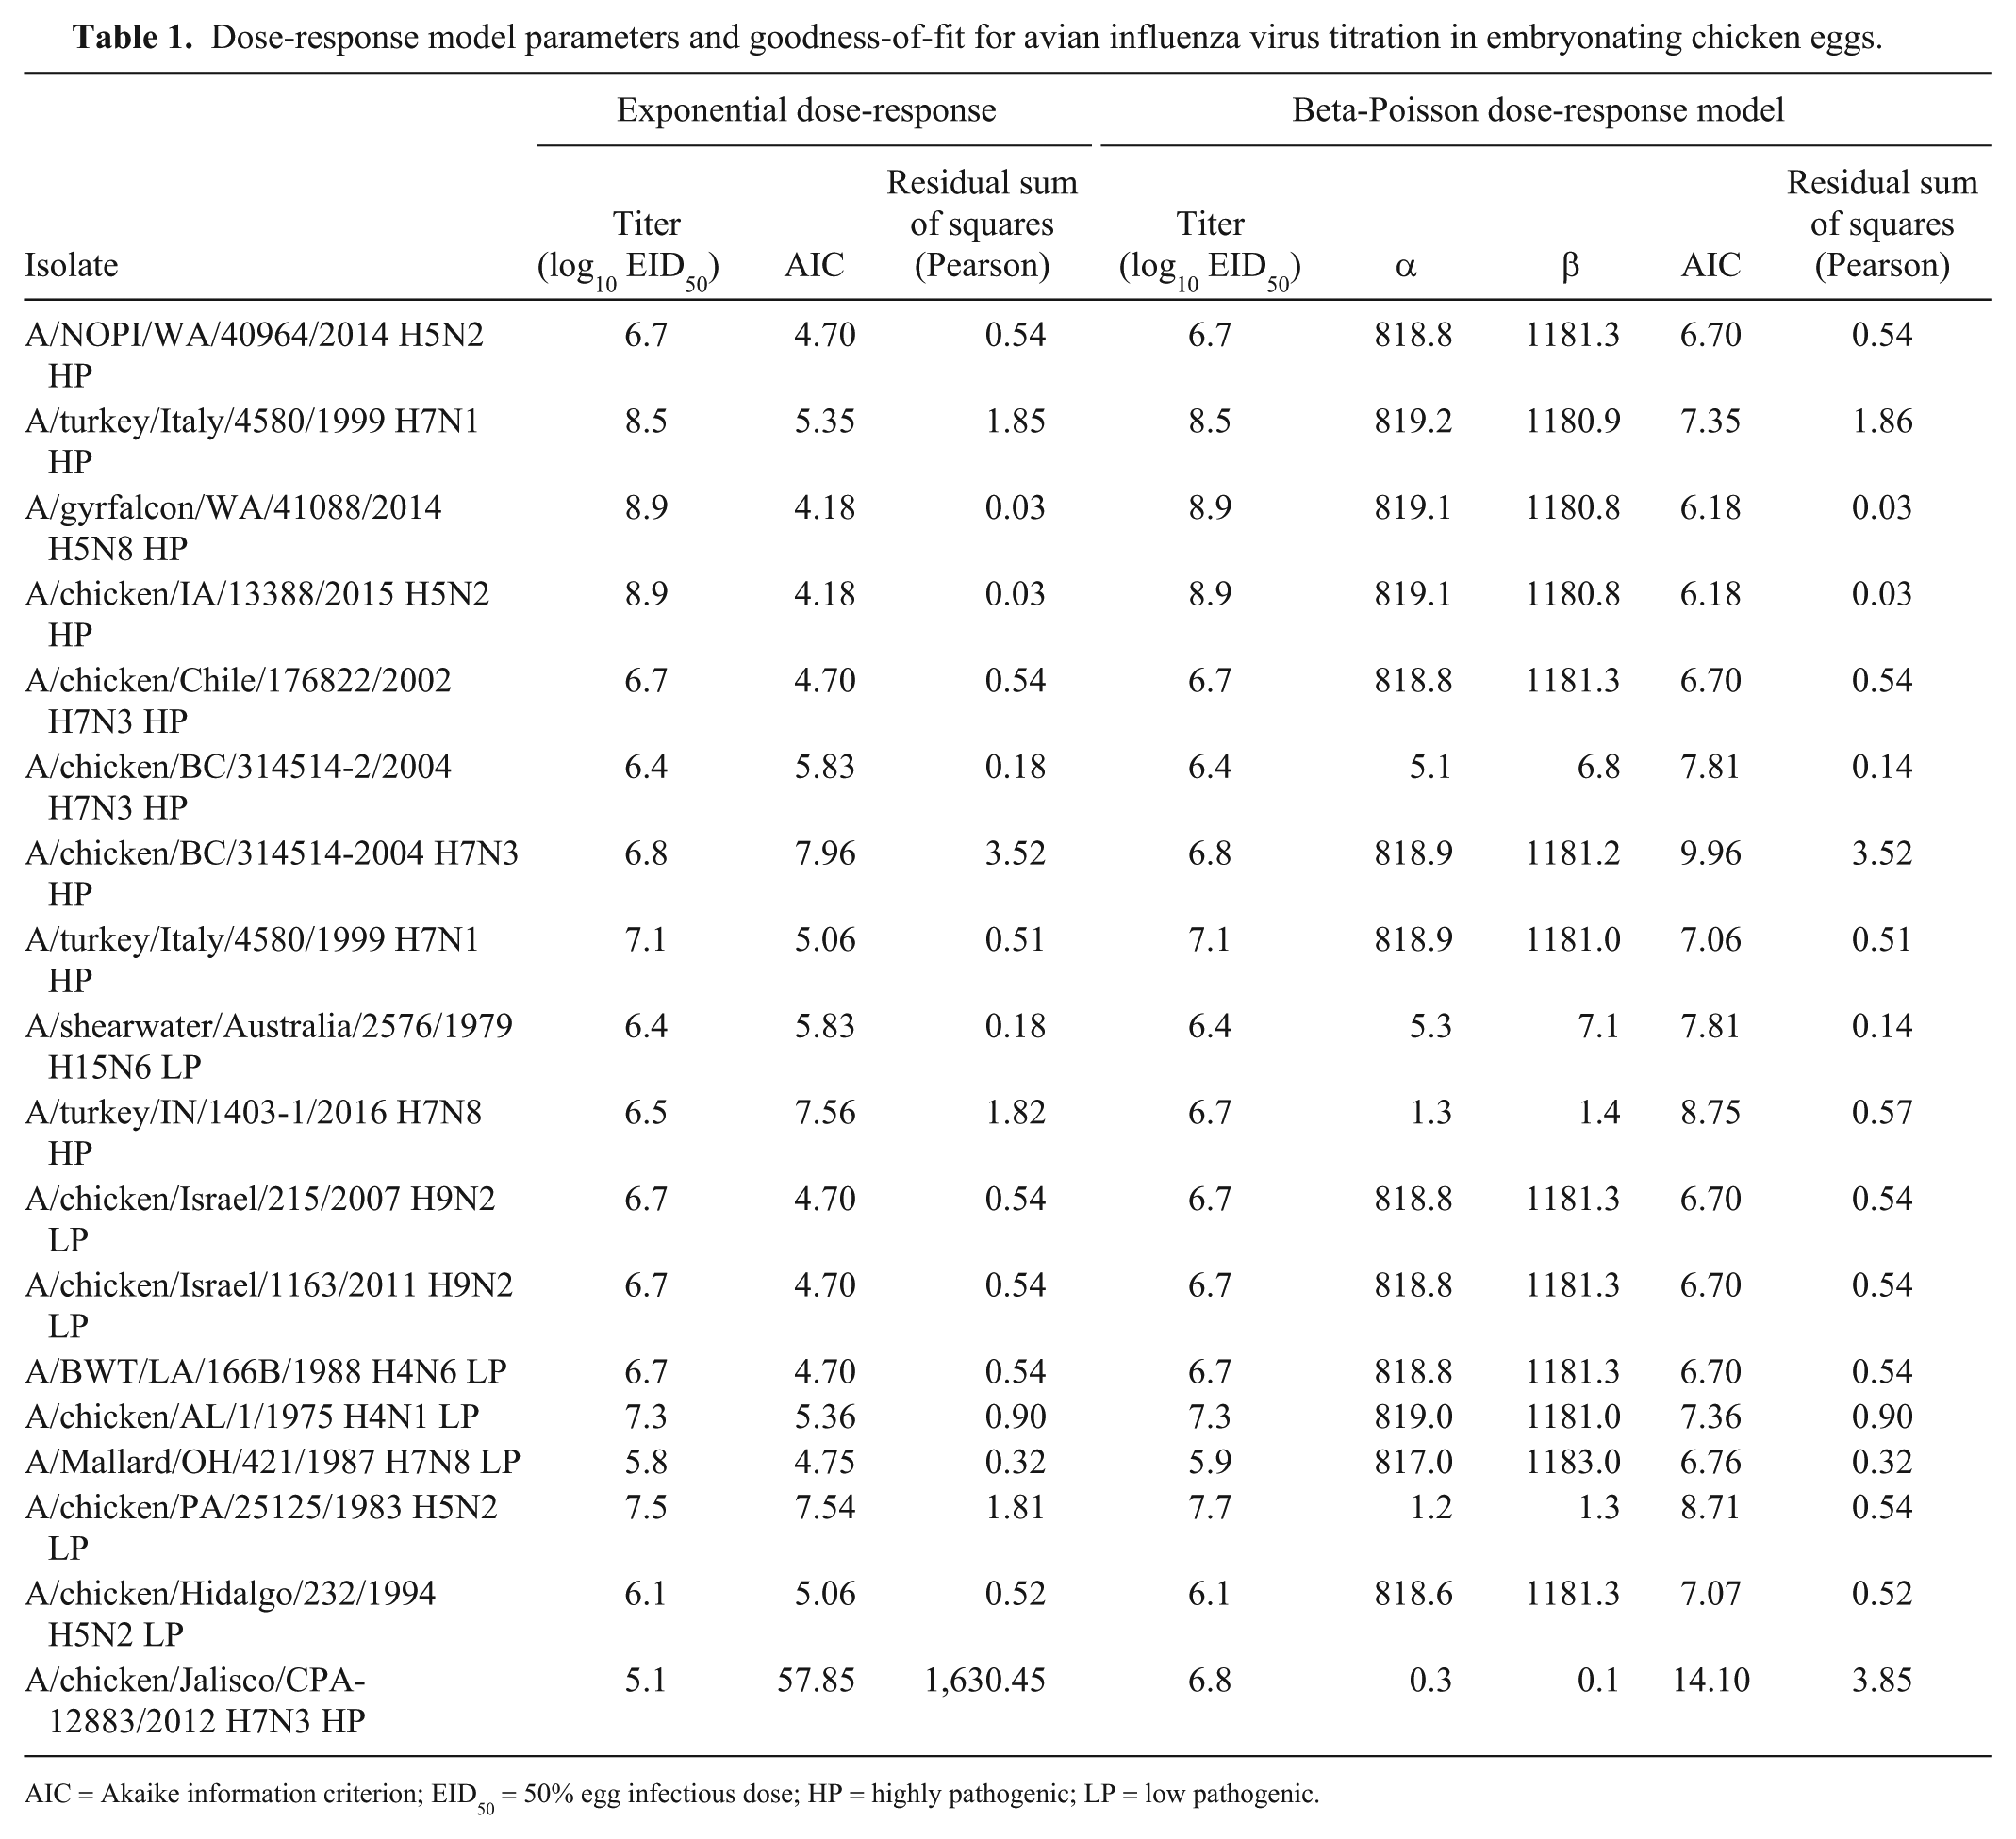
AIC = Akaike information criterion; EID50 = 50% egg infectious dose; HP = highly pathogenic; LP = low pathogenic.
A simulation study was performed to estimate the precision of virus concentration estimates obtained by the RM method using 3 or 5 ECEs per dilution. First, the maximum-likelihood parameters were estimated using the ECE titration data for 2 dose-response models: the exponential dose-response model (equation 1) and the beta-Poisson dose-response model (equation 2). The fitted dose-response curves were then used to simulate the number of infected eggs at various serial dilutions and to estimate the error (difference between input and estimated virus titers) applying the RM method.

In the exponential dose-response model,
The beta-Poisson model (equation 2) is a 2-parameter dose-response model that has been used previously to model animal viruses. 5

When the dose D is measured in EID50, the parameters β and α are related by,

In the beta-Poisson response model, the dose D and the parameter α for each strain were fit using maximum-likelihood estimation. The parameter β was than calculated using equation 3. Optimization for the maximum likelihood estimates was performed using the package optimx in R (www.rproject.org). The relative goodness-of-fit between the different models was assessed by Akaike information criterion (AIC) 1 and the sum of squared Pearson residuals.
The goodness-of-fit models for the exponential and beta-Poisson models were virtually identical with 15 of 18 isolates as evidenced by the similar estimated dose and Pearson residual sum of squares (Table 1). In 2 of the 3 cases in which the beta-Poisson resulted in an improved Pearson residual sum of squares, the AIC was still lower with the exponential dose-response model. This indicates that the improvement in fit is not substantial enough to justify the additional parameter in the beta-Poisson model. Note that the beta-Poisson dose-response model converges to the exponential dose-response model as the parameter α becomes large.
Goodness-of-fit by the models varied among the isolates. The Pearson residual sum of squares was >1.0 for 5 isolates with the exponential dose-response model, and the Pearson residual sum of squares was >1.0 with the beta-Poisson model for 3 of the same isolates (Table 1). This is likely because of variability that can be introduced from the titration process (e.g., the accuracy of dilutions, biological variation in the susceptibility of individual embryos to infection, inoculation accuracy, and isolate replication efficiency in ECE), specifically, for the isolate with a uniquely high residual of 1630.45. In this case, there was one hemagglutination-positive egg at 10-6, but none at 10-5, which is likely an artifact of a laboratory dilution error or unrecognized bacterial contamination.
According to these models, the SD of titration increases by 0.08 and 0.09 log10 EID50 with 3 instead of 5 ECEs per dose for the exponential and beta-Poisson dose-response models, respectively, and the width of the 2-sided 95% CI increased by 0.14 log10 EID50 with the exponential dose-response model and 0.17 log10 EID50 with the beta-Poisson dose-response model (Supplementary Table 1). This indicates that the precision is only affected minimally when the error in a titration would likely be no >0.14–0.17 log10 EID50 above or below the titration with 5 ECEs per dilution when using 3 ECEs per dilution.
Monte Carlo simulation is beneficial to directly estimate the error (defined for our study as the difference between input and estimated virus titers) in cases in which a small number of replicates are tested per dose, and was applied to estimate error based on the dose-response models. The input dose C was simulated as 10unifom(5.5-7.5) EID50. The virus dose was then calculated at 6 serial dilutions (10-4–10-9 of input dose C). At each dilution, the probability of an inoculated ECE being infected was calculated according to the 3 fitted dose-response models. The number of infected ECEs was simulated using a binomial distribution, with the total number of inoculated ECE per dilution N as either 5 or 3. The estimated virus dose λ was then calculated by applying the RM method. The difference between the input dose C and estimated virus dose λ in each simulation iteration was recorded as the outcome variable. The SD of the difference (C – λ) and the 2-sided 95% CI were reported as measures of the precision of the estimated virus concentration. The simulation model was implemented using Excel (Microsoft, Redmond, WA) with @Risk (Palisade, Ithaca, NY) with 10,000 iterations for each scenario.
Next, additional replicates were performed for a single isolate to evaluate reproducibility and to provide more information by which to evaluate the difference in fit among different dose-response models. Three replicates were completed with independent sets of virus dilutions prepared for each replicate. Dilutions from 10-4 through 10-9 of the A/turkey/NY/15086-3/1994 H7N2 LPAIV isolate (5 ECEs per dilution in each replicate) were included. Data for the same dilution were combined from all 3 replicates and analyzed as a single dataset with 15 ECEs at each dilution. Three dose-response models, the exponential, beta-Poisson, and Weibull (equation 4), 6 were considered.

When the dose D is expressed in units of EID50, the parameter T is equal to ln(2). Maximum-likelihood estimation methods were used to fit the starting virus doses D1, D2, D3, D4, and the unknown dose-response model parameter β.
The best fit was observed with the 2-parameter models. The Weibull model had a Pearson residual sum of squares of 6.44, and beta-Poisson had a Pearson residual sum of squares of 8.18, versus the single-parameter model, exponential dose-response that had a residual sum of squares of 18.05 (Supplementary Table 2; Supplementary Fig. 1).
In the beta-Poisson model, the SD of the error between input and estimated concentration only increased by 0.09 log10 EID50. Similarly, based on the Weibull dose-response model, the SD of the error only increased by 0.09 log10 EID50, and the width of the 95% CI increased marginally from ±0.58 to ±0.75 log EID50.
As an additional validation, m of n bootstrapping with replacement was also utilized to further characterize potential error in the RM method (a parametric dose-response curve was not assumed) using the combined dataset for the A/turkey/NY/15086-3/1994 H7N2 LPAIV (15 ECEs per dilution). 2 Bootstrapping was applied as an additional approach that does not rely on simulations with a parametric dose-response model. In each bootstrap iteration, either 3 or 5 ECEs were resampled of the 15 ECEs at each serial dilution. The RM method was then applied to obtain the estimated virus doses for that iteration. The SD of the virus concentration using 3 or 5 ECEs was then estimated from 5,000 bootstrap iterations. Based on bootstrapping, the SD of the estimated virus dose for 5 ECEs per dilution was 0.34 with a 95% CI of 6.5–7.7 log10 EID50; for 3 ECEs per dilution, the SD was 0.43 with a 95% CI of 6.45–8 log10 EID50 (Supplementary Table 3). The RM virus dose estimate for this dataset was 7.07 log10 EID50. Therefore, although the error was increased with 3 ECEs versus 5, the difference was only 0.09 log10 EID50, which would have minimal practical consequence for titer calculations.
There are several alternative methods for analyzing quantal dose-response data. Parametric models in conjunction with maximum-likelihood estimates may result in greater precision and provide more information (e.g., to evaluate the goodness-of-fit) when there is a theoretical rationale or empirical evidence justifying their use. 9 For example, a software package has been developed to estimate the maximum-likelihood estimate concentration of target cells for scenarios in which the exponential dose-response relationship is appropriate. 13 However, maximum-likelihood methods require software for implementation and have greater complexity relative to nonparametric methods such as RM and Spearman–Kärber, which can be calculated by hand. Nonparametric methods are also appropriate when there is insufficient information regarding the nature of the dose-response relationship. Like any method, the RM method has its merits and demerits, and several authors have found the Spearman–Kärber method to be superior, particularly with an asymmetrical tolerance distribution.4,9 We evaluated the precision of virus concentration estimates using RM in our study because of its simplicity and widespread use. The performance of the RM method was considered sufficiently accurate for virus titrations, especially with symmetric tolerance distributions. 3 Furthermore, in simulations with the exponential dose-response model, the SD of the virus titer estimate and the width of the CI were very similar for both RM and the Spearman–Kärber method (Supplementary Table 4).
Although our study focused on the precision of virus concentration estimates, our results also indicated that the RM method had high accuracy, because the mean difference between input and estimated virus concentration was very small in all scenarios. Both Monte Carlo and bootstrapping simulations returned similar estimates. Overall, using fewer ECEs, when possible, to titrate AIV is a simple way to increase efficiency and save money. Ultimately, the objective for titrating the virus will dictate the level of precision needed, but these models suggest that, for many applications, reducing the number of ECEs from 5 to 3 per dilution to calculate the log10 EID50 will provide adequate accuracy and precision. Finally, although our study focused on AIV, the results may be extrapolated to other systems using 10-fold serial dilutions with ECEs provided that the exponential dose-response model provides an acceptable fit because the parameter r of the exponential model is a constant (ln(2)) when the dose is measured in units of EID50.
Supplemental Material
DS_JVDI_10.1177_1040638719853851 – Supplemental material for Assessment of replicate numbers for titrating avian influenza virus using dose-response models
Supplemental material, DS_JVDI_10.1177_1040638719853851 for Assessment of replicate numbers for titrating avian influenza virus using dose-response models by Erica Spackman, Sasidhar Malladi, Amos Ssematimba and Christopher B. Stephens in Journal of Veterinary Diagnostic Investigation
Footnotes
Acknowledgements
We thank Scott A. Lee for technical assistance with this work. Mention of trade names or commercial products in this manuscript is solely for the purpose of providing specific information and does not imply recommendation or endorsement by the U.S. Department of Agriculture. USDA is an equal opportunity provider and employer.
Declaration of conflicting interests
The authors declared no potential conflicts of interest with respect to the research, authorship, and/or publication of this article.
Funding
This research was supported by U.S. Department of Agriculture, ARS CRIS Project 6040-32000-066-00D.
Supplementary material
Supplementary material for this article is available online.
References
Supplementary Material
Please find the following supplemental material available below.
For Open Access articles published under a Creative Commons License, all supplemental material carries the same license as the article it is associated with.
For non-Open Access articles published, all supplemental material carries a non-exclusive license, and permission requests for re-use of supplemental material or any part of supplemental material shall be sent directly to the copyright owner as specified in the copyright notice associated with the article.