
Abstract
In order to develop bovine hematology reference intervals (RIs) in accordance with new international recommendations, we analyzed 156 blood specimens of healthy adult dairy and beef cows from 32 farms with a Sysmex XT-2000iV analyzer, and by manual scoring of platelet clumps and white blood cell (WBC) differential. We established RIs by the nonparametric method, and examined effects of age, production type (beef vs. dairy), and stage of lactation. RIs could not be determined for platelet count and indices because clumps were observed in 80% of specimens. Optical and impedance red blood cell (RBC) counts were similar, although statistically different. RIs for analyzer and manual WBC differentials were not different except for lymphocyte concentration, the subpopulations of which were counted manually. Hematocrit was higher in beef than dairy cattle, and hemoglobin was lower in early lactation. Increases in RBC count, mean corpuscular volume, mean corpuscular hemoglobin, and RBC distribution width were noted with increasing age, along with decreases in WBC count, neutrophils, and lymphocytes. Most RIs in our study, with the exception of neutrophils, were similar to those previously reported using a flow cytometry analyzer.
Introduction
The complete blood count (CBC) can provide valuable diagnostic and prognostic information when coupled with a thorough physical examination. 26 To detect and interpret hematologic abnormalities, CBC results are compared with reference intervals (RIs). RIs in adult cattle appear to have changed between 1957 and 2006, with increased neutrophil counts but decreased hemoglobin concentration, and lymphocyte, monocyte, and eosinophil counts. 10 The conclusion of a 2010 study was that the RIs available in many textbooks are no longer relevant. 9 RIs should be established according to international recommendations.6,8 RIs should be based on a suitable healthy reference sample group with environmental and physiologic characteristics representative of the patient population, performed using the same methodology and equipment, and analyzed with appropriate statistical methods.
RIs for a “normal” CBC count in cattle were defined in 1965 based on a population of 62 adult Holstein cows with no accompanying demographic, analytical, or sampling information, 25 and were subsequently reported in many medical and laboratory textbooks13,18,26 for use in clinical pathology laboratories. 9 RIs were obtained in 2010 with a new-generation flow cytometry–based analyzer from 99 clinically healthy dairy cows, 50% in first lactation, all milking within 30–150 d, from 10 farms in Ontario. 33 Other results were simultaneously available from 58 healthy adult Holsteins (69% originating from the same farm), in mid-lactation, from 4 herds in California. 9 However, relevant information such as the site, the time of blood collection, and age of cows was not provided.
The preferred method stated in international recommendations is an a priori nonparametric determination involving at least 120 reference individuals if the confidence intervals of the reference limits are determined by a nonparametric method. 5 To our knowledge, only a single study established values for selected variables in >120 cattle, but no demographic information was provided, and recommended methods of RI determination were not used. 15
Methods for determining the absolute differential leukocyte count rely on calculations of the white blood cell (WBC) count provided by the analyzer10,33 and the relative differential counts obtained by cytologic identification on stained blood smears. To our knowledge, the WBC differential count for currently available flow cytometry–based analyzers has not been validated in cattle. This may be caused by the morphology of cattle leukocytes. Three sizes of lymphocytes (small, medium, and large) have been described, and large lymphocytes can be confused with monocytes.26,33 Moreover, granular lymphocytes of variable shapes and sizes are also observed in cattle 33 but have not been quantified. To the best of our knowledge, hematology RIs have not been reported in cattle with the Sysmex XT-2000iV analyzer (Sysmex, Kobe, Japan). This flow cytometry–based instrument is used mainly in large veterinary clinical pathology laboratories. It is based on similar principles to a laser in-house hematology analyzer previously validated for cattle hemograms. 10
Because previous bovine hematology RIs could potentially lead to clinical misinterpretations, we established hematology RIs for adult dairy and beef cows in France consistent with recommendations of the American Society for Veterinary Clinical Pathology (ASVCP). We also used results obtained to compare manual and automatized analyzer WBC differentials.
Materials and methods
Our study protocol was approved by the “Science et Santé Animale” ethics committee (N°115; SSA-2015-002) of the National Veterinary School of Toulouse (ENVT). A consent form was signed by cattle owners.
Herd selection
To ensure representation of the various French cattle-rearing systems, 32 herds were selected in 3 different geographic areas (west, center, and southwest France). Various French husbandry systems were represented, ranging from high milk-yield dairy cows in a predominantly corn silage feeding system, to beef cows in an exclusively grass and hay feeding system. All herds were free of bovine leukemia virus.
Animal selection
Consistent with minimum reference individual guidelines of the Clinical and Laboratory Standards Institute (CLSI) 5 and ASVCP, 6 156 healthy cows (78 dairy and 78 adult beef) were sampled between December 2015 and June 2016. A maximum of 5 cows at 1 of 3 lactation stages—early (0–90 d in milk), mid (90–180 d in milk), or dry period—was sampled on each farm.
Individual inclusion criteria were evaluated to ensure the health status of each cow. A thorough questionnaire was completed regarding health status, feed intake, and medical history during the preceding month and, for dairy cows, the individual and herd milk production. A routine physical examination was then performed, including rectal temperature, and respiratory, cardiac, and ruminal assessment. Individual exclusion criteria were medical treatment in the last 4 wk, and any abnormal finding during the physical examination.
Specimen collection and processing
Blood was collected into 4-mL K3-EDTA tubes (Venosafe, Terumo, Guyancourt, France) from the coccygeal vein and carefully mixed by inversion. Tubes were immediately refrigerated at ~4°C until hematologic analysis at the Laboratoire Central de Biologie Médicale (Central Laboratory of Clinical Pathology) of ENVT within 24 h of blood collection. Two labeled air-dried blood smears were prepared within 1 h of blood sampling by the same investigator (C Trumel). One smear was stained with a May-Grünwald/Giemsa automatic stainer (Aerospray hematology slide stainer cytocentrifuge 7150, Wescor, Logan, UT), and stored until microscopic evaluation.
Immediately after blood sampling and after careful washing of the perineum, a urine specimen was collected by catheterization with a sterilized catheter by the same investigator (N Herman). A urine dipstick analysis (URS-10, Teco Diagnostics, Anaheim, CA) was performed immediately to detect subclinical ketosis, and the results were recorded on individual animal data sheets. Microscopic examination of urine sediment was performed within 1 h of sampling, and cows with sediment that contained >5 leukocytes, >5 red blood cells, or bacteria were excluded.
Prior to hematologic analysis, blood tubes were placed on an agitator (Specie mix, Drew Scientific Inc., Oxford, CT) for ~20 min, and then gently inverted to ensure homogenization. Specimens with visible clots were excluded. Measurements were obtained with the Sysmex XT-2000iV analyzer, as recommended by the manufacturer, using settings for bovine blood (Sysmex XT-2000iV software v.00-13). Because bovine blood quality control (QC) specimens were unavailable at the time the study was conducted, QC was performed with the manufacturer’s normal level human control solution (Sysmex e-check XE L2) and confirmed within the manufacturer’s acceptable range before each series of analyses. Analyzer-measured variables included red blood cell (RBC) count by impedance (RBC-I) and optical (RBC-O) measurements, hemoglobin concentration (HGB), hematocrit (HCT), mean corpuscular volume (MCV), mean corpuscular hemoglobin (MCH), mean corpuscular hemoglobin concentration (MCHC), red cell distribution width by standard deviation (RDW-SD) and coefficient of variation (RDW-CV), RBC hemoglobin content (RBC-HGB), reticulocyte percentage (RET), immature reticulocyte fraction (IRF), low-, medium-, and high-fluorescence ratio (LFR, MFR, and HFR, respectively) as grades of reticulocyte maturation, reticulocyte hemoglobin content (RET-HGB), delta-HGB (calculated as the difference between reticulocyte and RBC hemoglobin content or RET-HGB minus RBC-HGB), WBC count, neutrophil, lymphocyte, monocyte, eosinophil, and basophil (BASO) counts, platelet count by impedance (PLT-I) and optical (PLT-O) measurements, mean platelet volume (MPV), platelet distribution width (PDW), plateletcrit (PCT), and platelet large cell ratio (P-LCR).
All blood films were examined by the same investigator (M Thibault; Eclipse E400 microscope, Nikon, France); 100 leukocytes were counted per oil immersion (1,000×) field, the percentages of each cell type were determined, and the corresponding cell counts were calculated from the WBC results. In accordance with a veterinary hematology textbook, 33 lymphocytes were subdivided into small, medium, large, and granular subtypes, and neutrophils into segmented and non-segmented subtypes (Fig. 1). The most numerous lymphocytes were medium-sized, and these were not readily distinguished from small lymphocytes, therefore small and medium lymphocytes were grouped. Blood films were also examined for platelet clumping, which was graded 0–4 according to the number of platelets in each clump based on a grading system for feline blood. 21
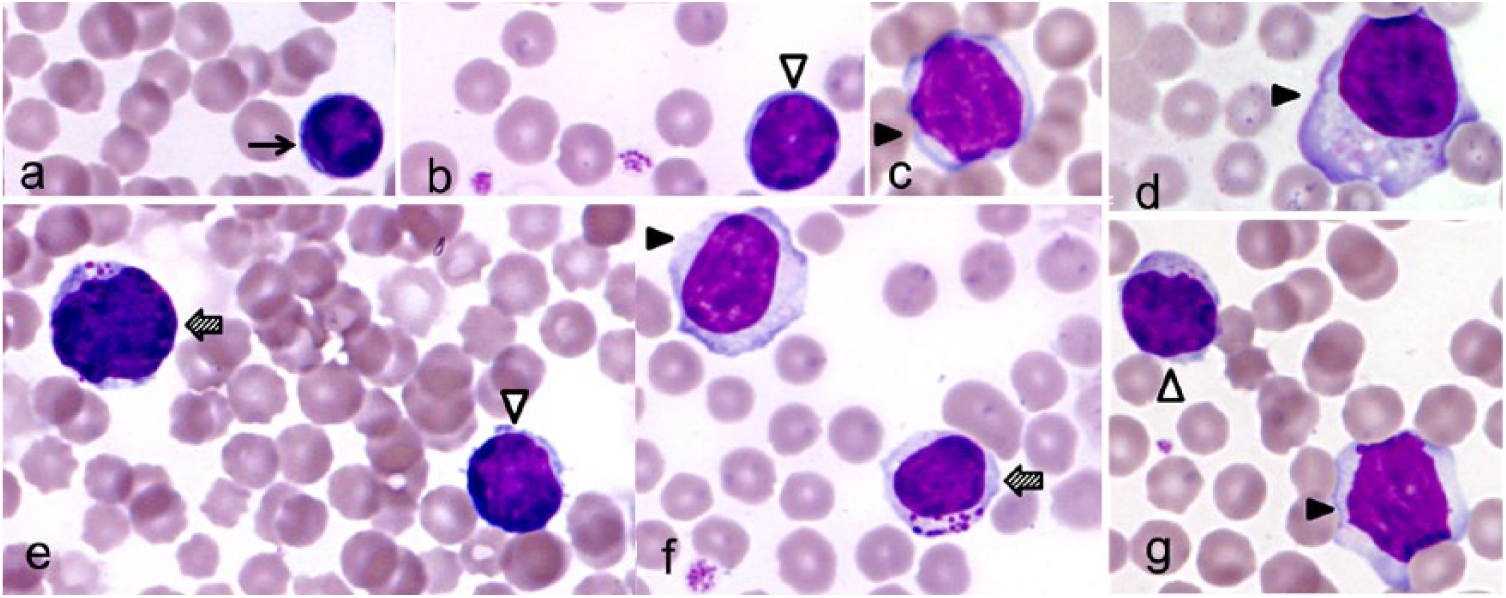
Bovine lymphocytes.
Between-series imprecision and inaccuracy of the analyzer were calculated from the result of QCs on the days of analyses: between-series imprecision (CV %) = (SD/mean) × 100; inaccuracy (%) = [(measured value – expected value)/expected value] × 100. All blood samples were negative for bovine viral diarrhea virus infection by PCR.
Statistical analysis
All demographic data and results were recorded (Excel, Microsoft, Redmond, WA). Descriptive statistics, Spearman correlations, Passing–Bablok agreement curves, and difference diagrams were calculated (Analyse-It, Leeds, UK). RIs were determined using the nonparametric method.7,8 Outliers were identified by visual inspection of histograms and the Tukey test; the values for deleted outliers are indicated in table footnotes. All variables were tested for possible effects of covariables by ANOVA (Systat 13, Systat Software, San Jose, CA). Investigated covariables included: presence of urine ketones, type of production (beef vs. dairy), stage of lactation (beginning vs. middle vs. dry), and age. When differences for covariables were statistically significant, the relevance of partitioning was based on the Harris and Boyd z-test. 12 When age had a significant effect, regression-based RIs were indicated on graphs as reported previously for humans, 30 cats, 11 and dogs. 2 When a variable was measured by 2 different methods (e.g., RBC-I and RBC-O), results were compared using Spearman correlation, Passing–Bablok agreement curves, and difference plots. 14
Results
Specimens
Four of the initial 156 cows from the 32 farms were excluded because of visually detectable blood clots in the EDTA tubes prior to analysis, or unacceptable urine sediment. The remaining 152 cows were Prim’Holstein (n = 56), Charolais (n = 25), Blonde d’Aquitaine (n = 23), Limousine (n = 21), Montbéliarde (n = 10), Brune des Alpes, Normande, Salers (n = 5 of each), and Aubrac (n = 2) breeds (Table 1). Although the age range (2.5–17 y) was wide, 95% of the cows were 2.5–11-y-old. The median age of the 76 beef cows was 1.6 y higher than that of the 76 dairy cows (ANOVA, p = 0.035). The cows were mainly housed in free stall (n = 125) and some in tie stall (n = 27) barns.
Demographic characteristics of hematology reference group cows.
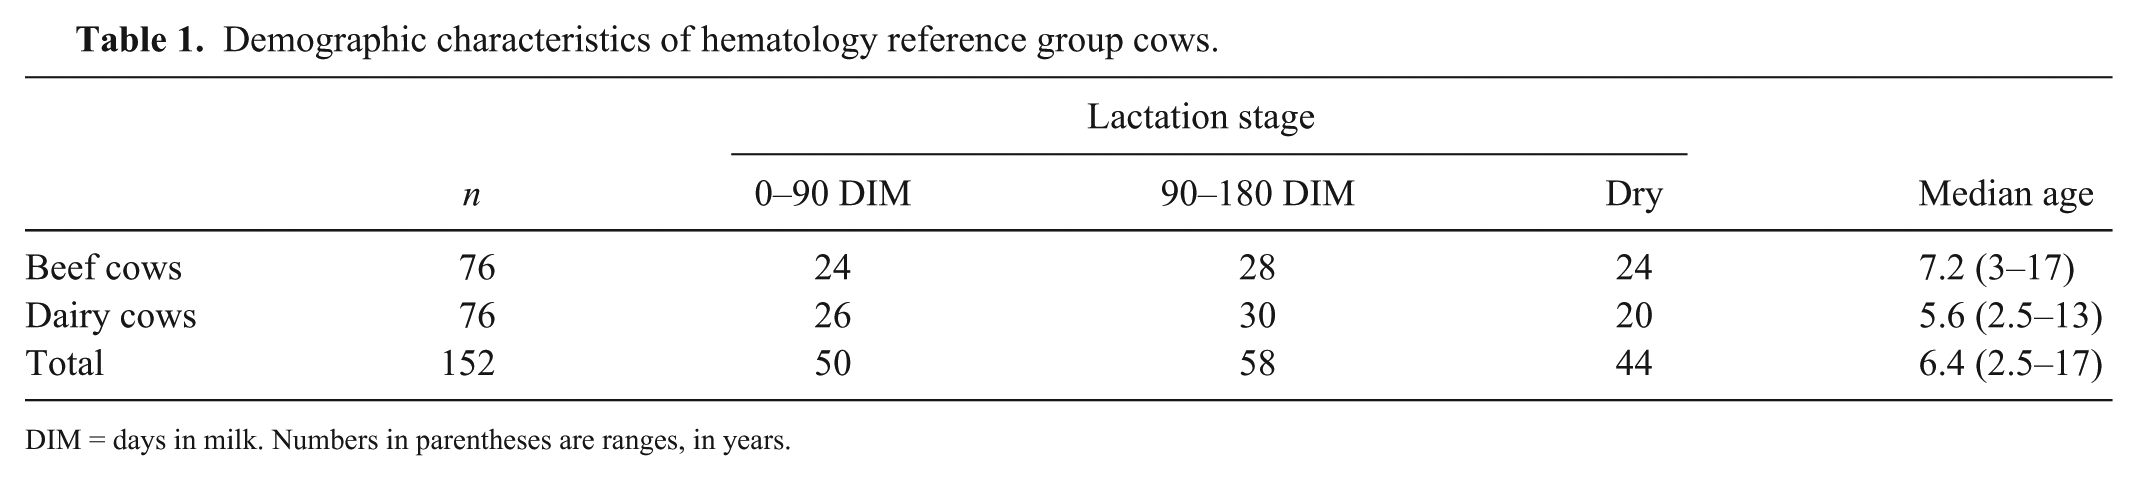
DIM = days in milk. Numbers in parentheses are ranges, in years.
Urine abnormalities were not observed in any of the included cows except for the presence of ketones in 32 animals. The percentage of urine ketone–positive cows did not differ according to production type. No difference between urine ketone–positive and –negative cows was apparent for any hematologic variable (ANOVA > 0.05). The urine ketone–positive animals were therefore included in the reference sample group of 152 cows.
The number of cases used for the calculation of RIs was <152 for some variables because the analyzer did not provide a WBC differential for 7 specimens or platelet indices for 33 specimens. Imprecision and inaccuracy of the analyzer were low, with the exception of reticulocyte indices and monocyte count (Supplementary Table 1). Imprecision of the manual WBC differentials was not evaluated.
Reference intervals
RIs are presented in Table 2 for RBC and reticulocyte variables, and in Tables 3 and 4 for analyzer and manual WBC variables, respectively. Supplementary Figure 1 illustrates typical histograms of variables.
Descriptive statistics and reference intervals (RI) for red blood cell and reticulocyte variables in cows measured with the Sysmex XT-2000iV analyzer.
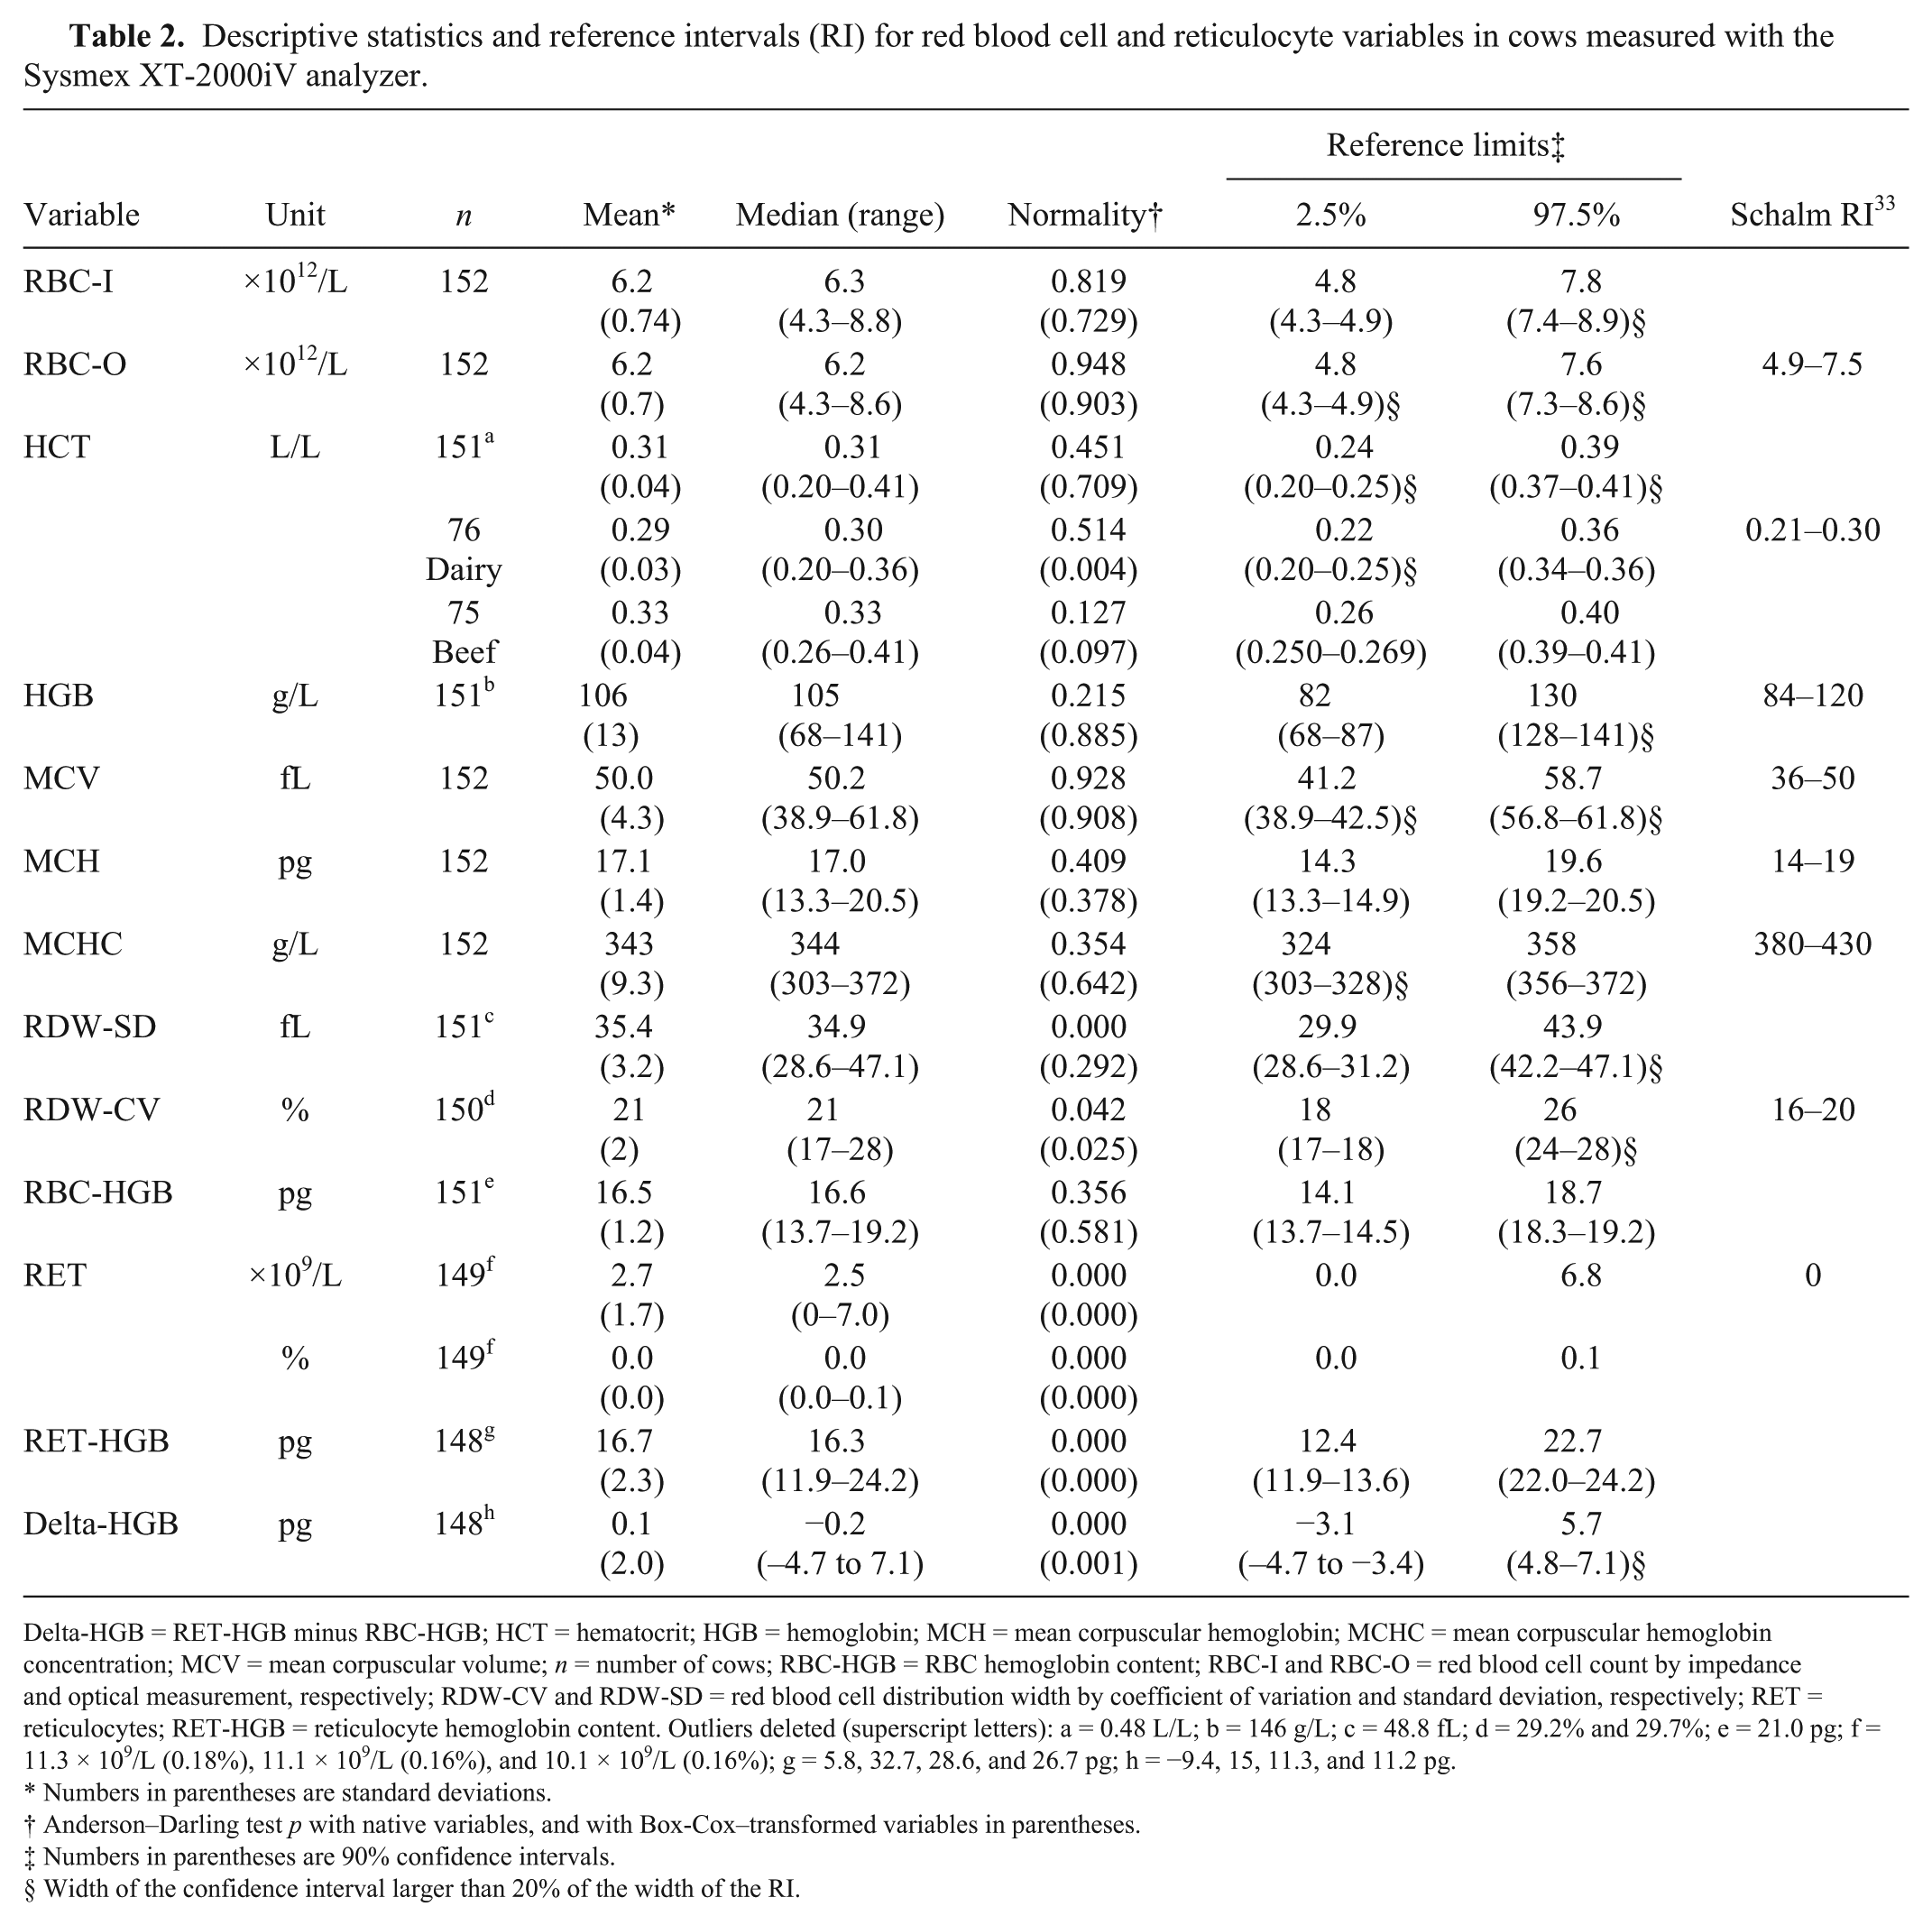
Delta-HGB = RET-HGB minus RBC-HGB; HCT = hematocrit; HGB = hemoglobin; MCH = mean corpuscular hemoglobin; MCHC = mean corpuscular hemoglobin concentration; MCV = mean corpuscular volume; n = number of cows; RBC-HGB = RBC hemoglobin content; RBC-I and RBC-O = red blood cell count by impedance and optical measurement, respectively; RDW-CV and RDW-SD = red blood cell distribution width by coefficient of variation and standard deviation, respectively; RET = reticulocytes; RET-HGB = reticulocyte hemoglobin content. Outliers deleted (superscript letters): a = 0.48 L/L; b = 146 g/L; c = 48.8 fL; d = 29.2% and 29.7%; e = 21.0 pg; f = 11.3 × 10⁹/L (0.18%), 11.1 × 10⁹/L (0.16%), and 10.1 × 10⁹/L (0.16%); g = 5.8, 32.7, 28.6, and 26.7 pg; h = −9.4, 15, 11.3, and 11.2 pg.
Numbers in parentheses are standard deviations.
Anderson–Darling test p with native variables, and with Box-Cox–transformed variables in parentheses.
Numbers in parentheses are 90% confidence intervals.
§ Width of the confidence interval larger than 20% of the width of the RI.
Descriptive statistics and reference intervals (RI) of white blood cell (WBC) variables in cows measured with the Sysmex XT-2000iV analyzer.
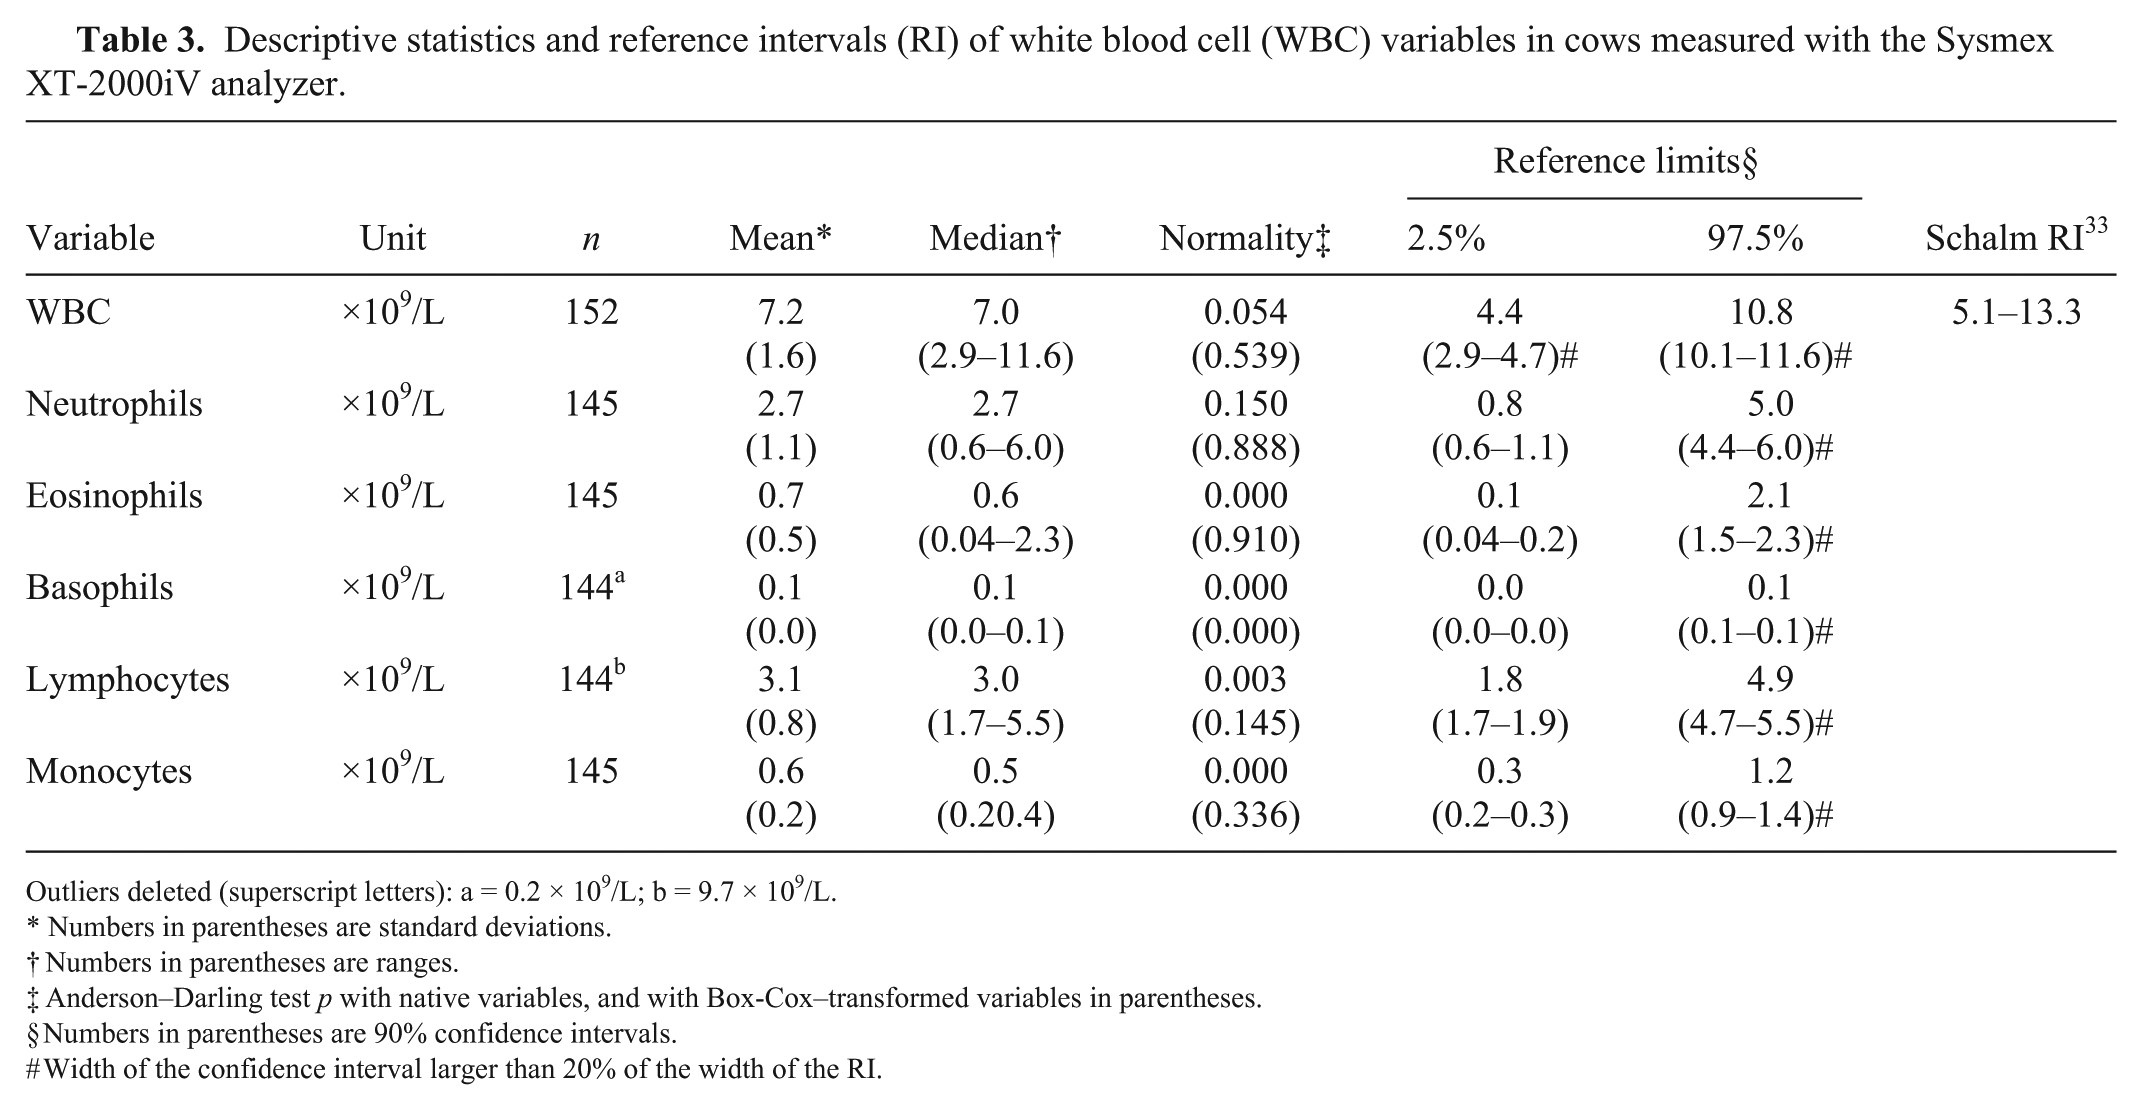
Outliers deleted (superscript letters): a = 0.2 × 10⁹/L; b = 9.7 × 10⁹/L.
Numbers in parentheses are standard deviations.
Numbers in parentheses are ranges.
Anderson–Darling test p with native variables, and with Box-Cox–transformed variables in parentheses.
§ Numbers in parentheses are 90% confidence intervals.
# Width of the confidence interval larger than 20% of the width of the RI.
Descriptive statistics and reference intervals (RI) of manual differential white blood cell counts in cows.
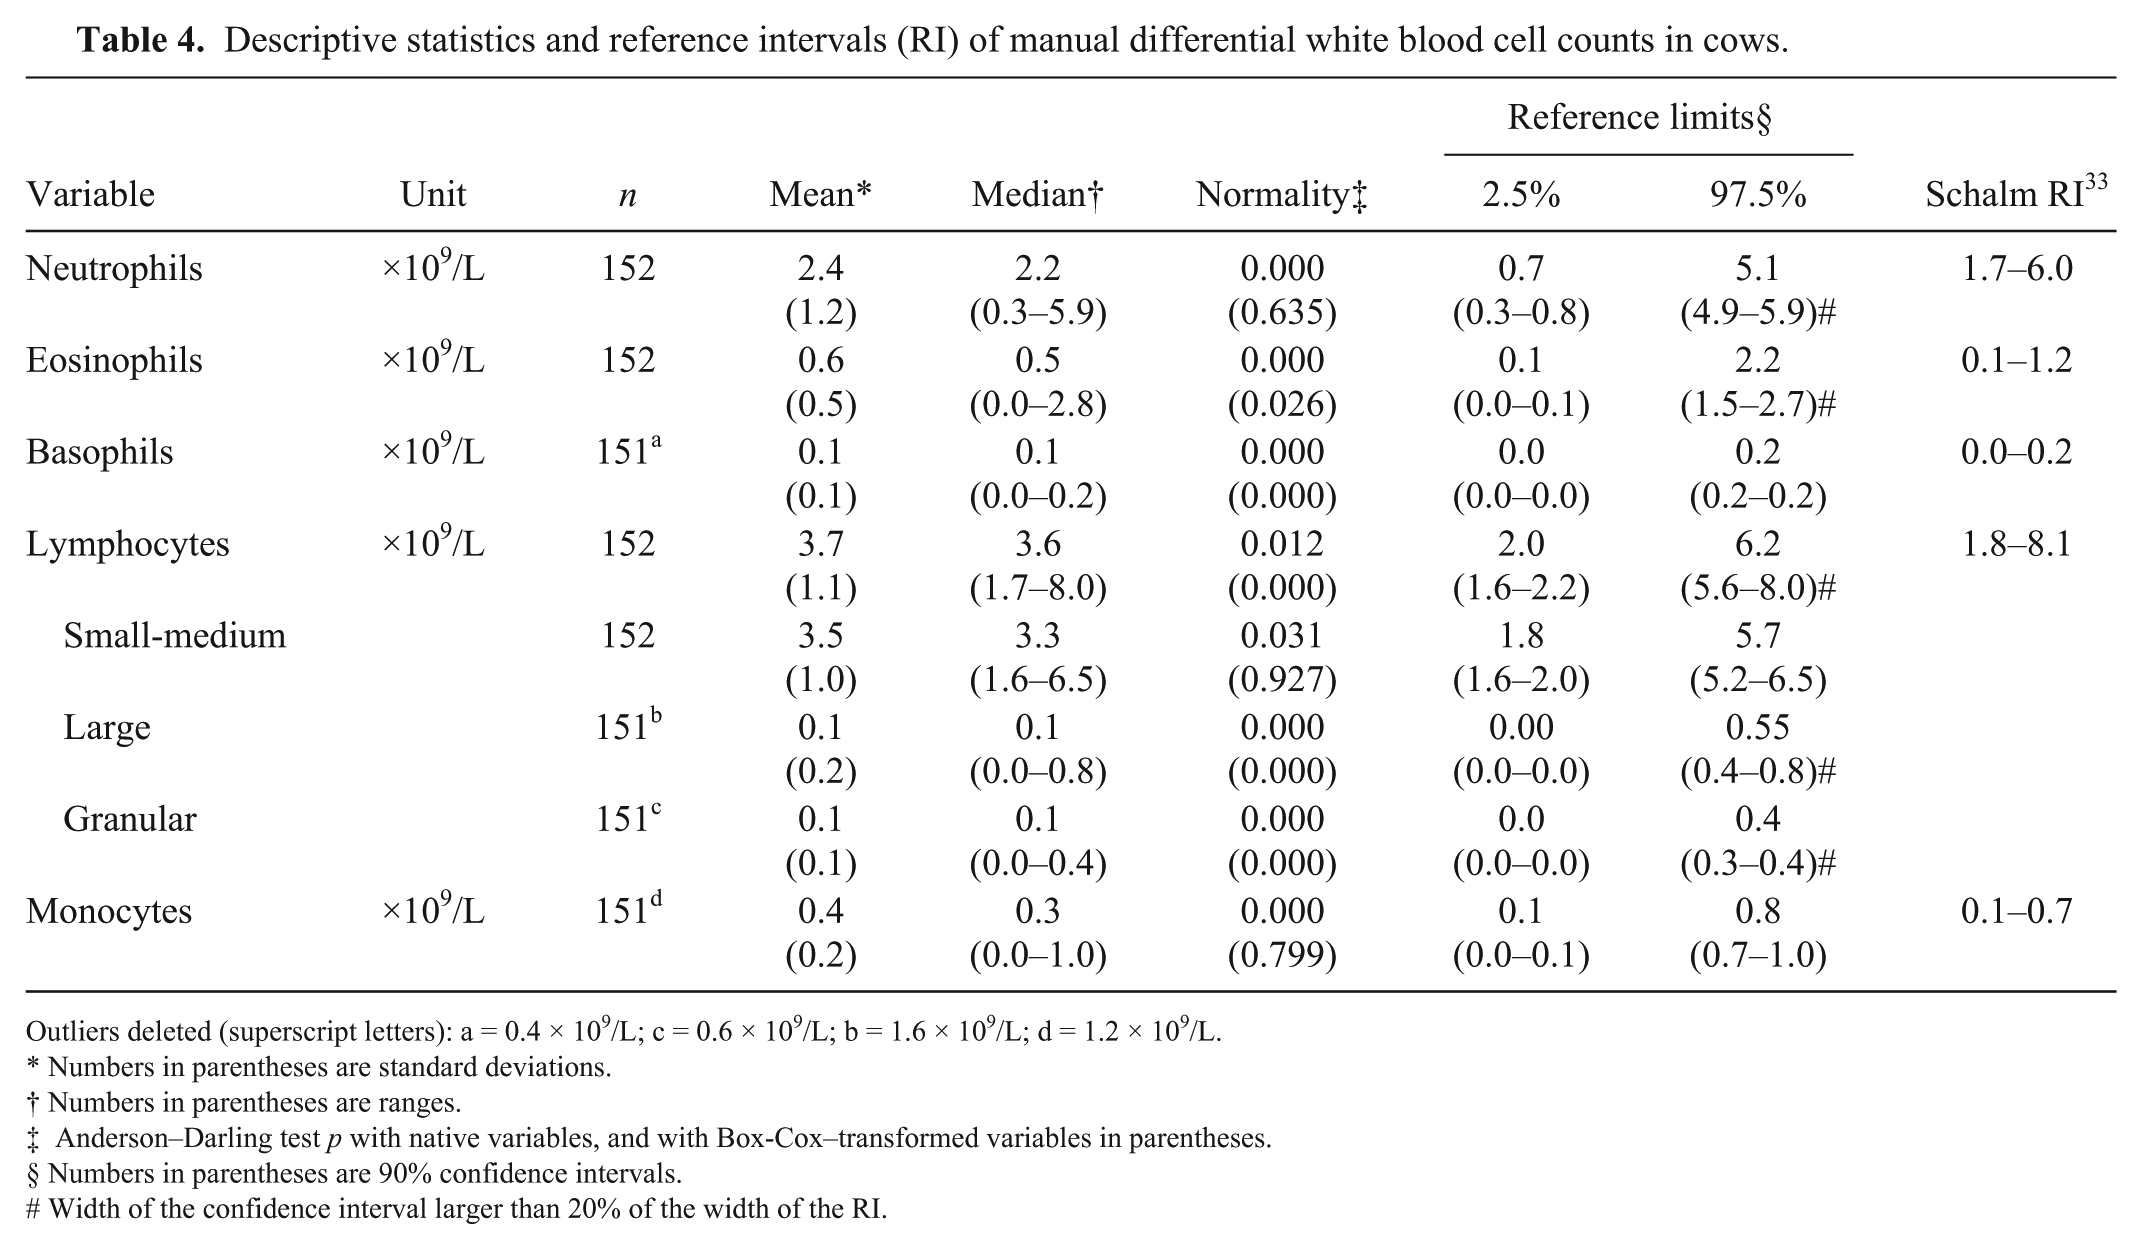
Outliers deleted (superscript letters): a = 0.4 × 10⁹/L; c = 0.6 × 10⁹/L; b = 1.6 × 10⁹/L; d = 1.2 × 10⁹/L.
Numbers in parentheses are standard deviations.
Numbers in parentheses are ranges.
Anderson–Darling test p with native variables, and with Box-Cox–transformed variables in parentheses.
§ Numbers in parentheses are 90% confidence intervals.
# Width of the confidence interval larger than 20% of the width of the RI.
Most distributions were significantly different from Gaussian, except for RBC variables and WBC count. Some were better fitted to Gaussian after Box–Cox transformation, but others could not be transformed to fit a Gaussian distribution. The width of the 90% CI of the reference limits was frequently higher than the recommended 20% of the RI width suggested by CLSI. 5 Calculation of RIs for reticulocyte fluorescence indexes was not possible because, in 65.5% of the cows, LFR was 100%, and MFR, HFR, and IRF in 74.3%, 84.5%, and 65.5% of the cows, respectively, were equal to zero.
Examples of complete scattergrams and histograms from a cow are shown with dot plots indicated on the WBC differential (DIFF), BASO, RET, and PLT scattergrams, and the normal aspect of RBC and PLT histograms (Fig. 2A). Abnormal scattergrams showing the erroneous separation of WBC dot plots (Fig. 2B) or the presence of an additional unidentified gray dot plot (Fig. 2C) were observed occasionally, but the corresponding results were not excluded from RI determinations.
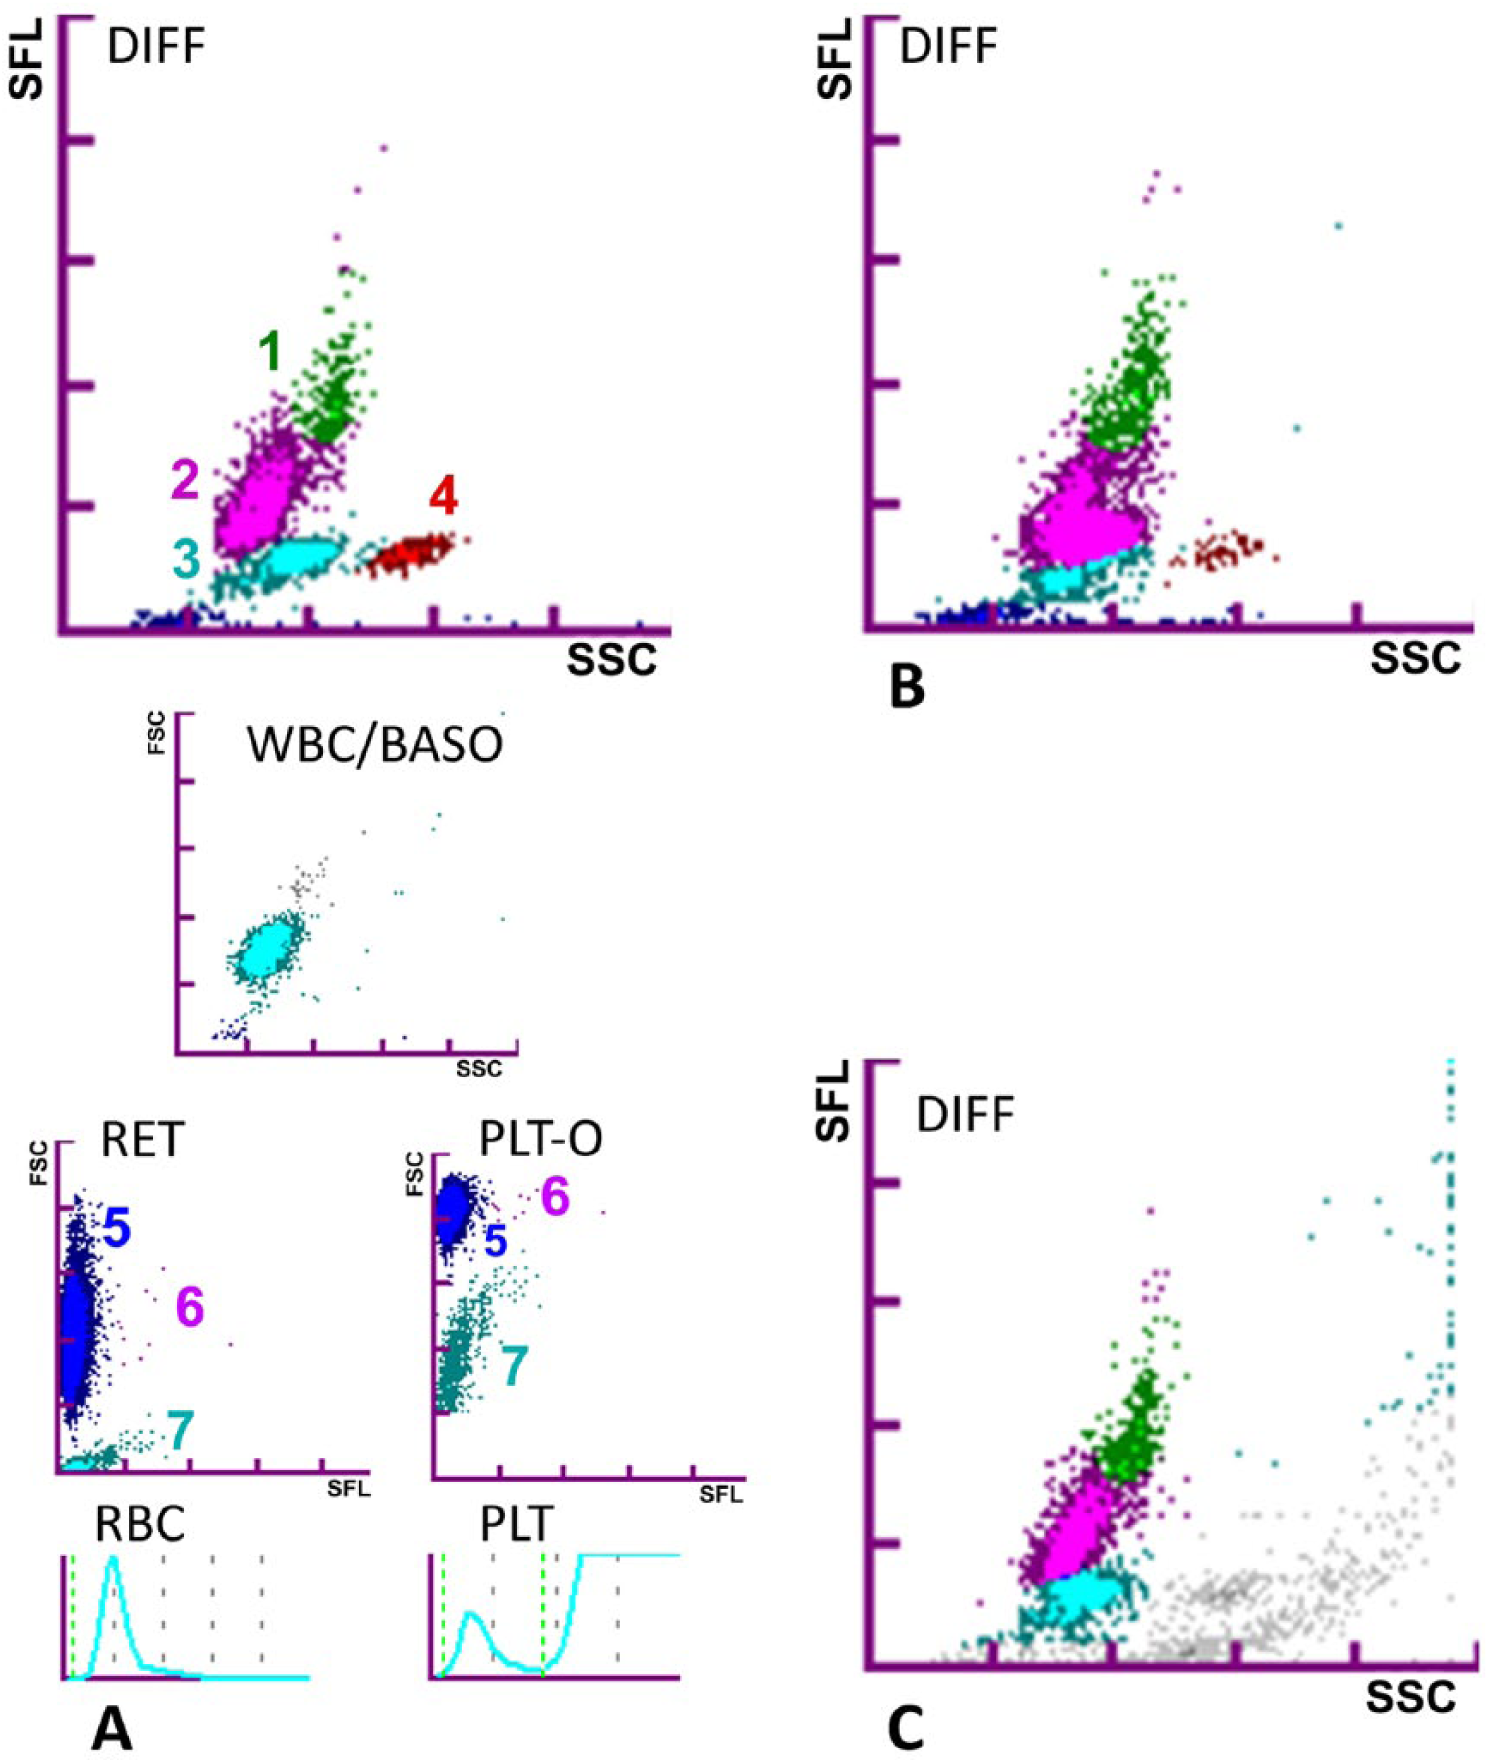
Examples of the Sysmex XT-2000iV automated hematology analyzer histograms for bovine EDTA blood specimens. 1 = monocytes, 2 = lymphocytes, 3 = neutrophils, 4 = eosinophils, 5 = red blood cells, 6 = reticulocytes, and 7 = platelets.
RBC-I and RBC-O appeared almost identical, and no bias was identified on Passing–Bablok regression analysis: RBC-O = 0.98 (0.97/1.00) RBC-I + 0.04 (–0.05/0.15). MCH and RBC-HGB were not correlated (Spearman r = 0.05), and there was a large scatter of the differences as shown by the wide CI of the parameters of Passing–Bablok agreement equation: RBC-HGB = 0.78 (0.56/1.07) MCH + 3.10 (–1.79/6.98). However, the mean difference between MCH and RBC-HGB was 0.6 pg (range: –1.6 to 2.3 pg).
Platelet clumps were observed by microscopy in 121 cases (80%) with 24, 21, 30, and 46 cases of 1–4 aggregation grades. PLT-I and PLT-O measurements were strongly correlated (Spearman r = 0.84), with a constant bias: Passing–Bablok equation was PLT-O = 0.98 (0.93/1.03) PLT-I + 23 (19/35). Mean (PLT-O minus PLT-I) difference was 42 × 109/L. However, no significant difference was observed between the measurements according to aggregation grade, except that PLT-I was lower in grade 4 aggregated specimens than in non-aggregated ones (Tukey HSD test, p = 0.021). Comparison of the latter 2 subgroups revealed similar minimum–maximum ranges of 11–672 × 109/L and 57–546 × 109/L, respectively. Under these conditions, it was inappropriate to establish RIs for platelet counts and related indices.
The correlations between manual and automatic WBC differentials were mostly weak for all cell types (Spearman r values ≤ 0.63). Moreover, manual counting allowed identification of small-medium, large, and granular lymphocytes (Table 4); non-segmented neutrophils were not observed. The manual RIs do not significantly differ from those of the analyzer, with the exception of lymphocytes (Harris and Boyd test, z < z*).
Some DIFF scattergram abnormalities helped to detect or explain the WBC differential values obtained with the analyzer (e.g., invalid separations of dot plots were paired with erroneous WBC counts and abnormal gray dot plots were highly suggestive of large PLT aggregates, as observed on blood smears; Fig. 2B, 2C).
Covariable effects
The type of production had a statistically significant effect only on HCT, which was significantly higher in beef than in dairy cows, and the corresponding RIs were significantly different (Harris and Boyd test, z > z*). The stage of lactation was a factor of variation for some RBC variables and basophils when counted with the analyzer. According to the Harris and Boyd test, partitioning was not relevant for HCT and HGB, but significant differences were observed between some of the subgroup RIs (Table 5).
Hematology reference intervals in cows by lactation stage and measured with the Sysmex XT-2000iV analyzer.
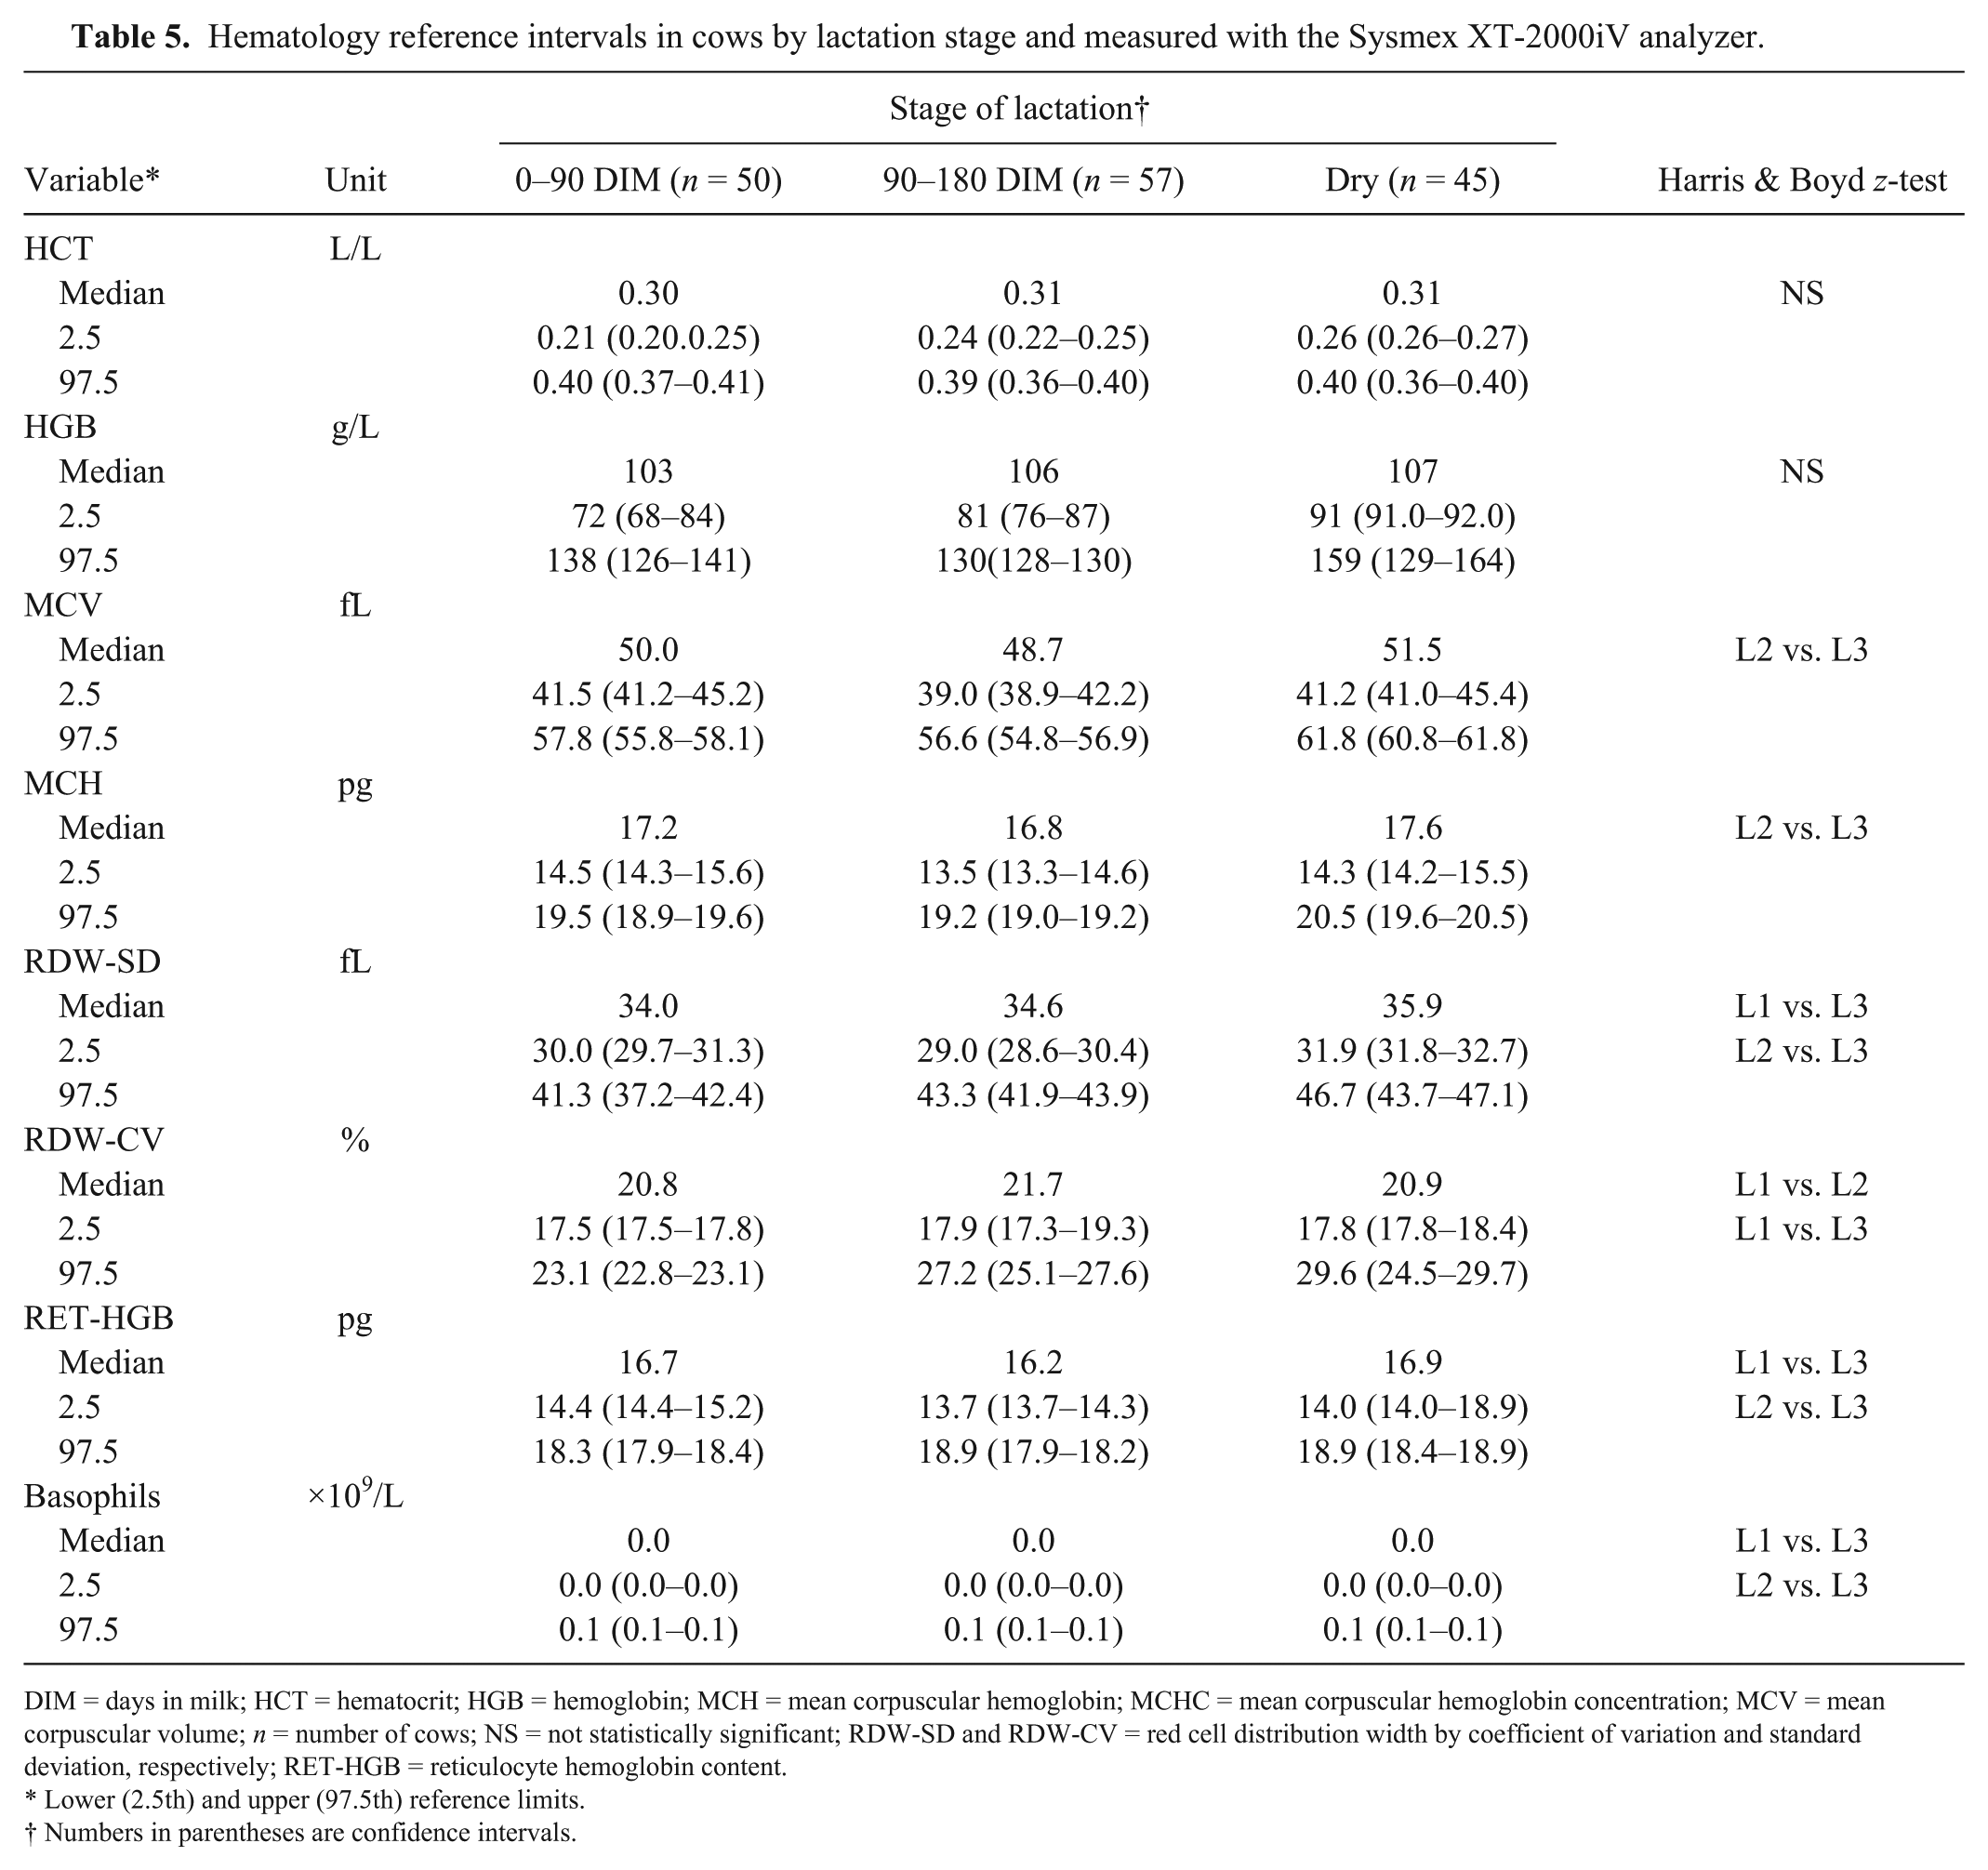
DIM = days in milk; HCT = hematocrit; HGB = hemoglobin; MCH = mean corpuscular hemoglobin; MCHC = mean corpuscular hemoglobin concentration; MCV = mean corpuscular volume; n = number of cows; NS = not statistically significant; RDW-SD and RDW-CV = red cell distribution width by coefficient of variation and standard deviation, respectively; RET-HGB = reticulocyte hemoglobin content.
Lower (2.5th) and upper (97.5th) reference limits.
Numbers in parentheses are confidence intervals.
Age had an effect on RBC indices using both methods of measurement, on the RBC-HGB, MCV, MCH, RDW-CV, WBC, and neutrophil counts obtained with the analyzer, and on the lymphocyte and large lymphocyte counts obtained manually (Supplementary Fig. 2). Although an overall effect of age was seen, RBC-I and RBC-O decreased slightly, and the difference between the 25% of younger cows and the 25% of older cows was not significant (Student t-test, p = 0.3829 and 0.2760, respectively). RBC-HGB remained almost stable: the mean 0.39 pg decrease between the 25% of younger cows and the 25% of older cows was not significant (Student t-test, p = 0.1340). MCV increased with age up to 10 y, and the mean difference of 1.2 fL between the 25% of younger cows and the 25% of older cows was significant (Student t-test, p = 0.005). MCH increased with age up to 10 y, but the difference in MCH between the 25% of younger cows and the 25% of older cows was not significant (Student t-test, p = 0.3829).The mean difference in RDW-CV of −0.67% between the 25% of younger cows and the 25% of older cows was also not significant (Student t-test, p = 0.0843). RDW-SD was not significantly altered by age. There was a decrease of WBC and neutrophil counts with age. The mean difference between the analyzer counts for the 25% of younger cows and the 25% of older cows was 1.6 × 10⁹/L (Student t-test, p < 0.001) for WBC and 0.7 × 10⁹/L (Student t-test, p = 0.0021) for neutrophils, respectively.
Discussion
To our knowledge, bovine hematology RIs have not been previously reported based on current ASVCP recommendations (Reference interval guideline, https://www.asvcp.org/general/custom.asp?page=QALS_Guidelines, accessed May 24, 2018), which include demographics of the reference sample group, the pre-analytical and analytical methods including QC, and the method of data analysis based on the nonparametric establishment of RIs with 90% confidence intervals (CIs). Partitions according to covariables were also based on the ASVCP-recommended methods using the Harris and Boyd test. 12 However, when age had a significant effect on a variable, the regression-based approach 31 was preferred as it provides better visualization of the continuous evolution of the variable rather than its arbitrary separation into classes.
The number of animals was sufficiently large to allow the use of the nonparametric method to determine RIs and their 90% CIs according to international recommendations. The reference sample group in our study included a balanced mix of dairy and beef breeds, at different stages of the production cycle, in various husbandry systems. The sample group was not selected by stratified random sampling because data on all farms of western France are not available, and consent by farmers was not guaranteed. We thus determined a priori the number of animals in each subgroup and sampled them on as many different farms as possible. We consider that this reference sample group is as representative as possible of the adult cow population in western France, but a possible bias may remain, the extent of which cannot be estimated.
Most specimens (80%) were analyzed within 8 h after blood collection but a 24-h delay was required when farms were distant from Toulouse, and a long delay before analysis is common practice in bovine clinics. Platelet clumping when blood exposure to EDTA exceeds 5 h has been reported in secondary sources without any reference to an original study.15,25,26 Given the 8–24-h delay before blood specimen analysis, the low PLT-I and PLT-O concentrations detected were not unexpected. The absence of correlation between the platelet clumps observed in blood smears and the measured platelet concentrations could be accounted for by the delay between blood smear preparation and CBC measurement, and the non-homogeneity of platelet clumping within a tube. The latter, as reported in canine blood, results in variation in size and concentration of the platelet aggregates, which can range from inconspicuous clumping to obvious large clumps in several smears from the same aliquot of blood. 17 This pre-analytical effect, and the resulting pseudo-thrombocytopenia, can also be expected when blood specimens from diseased cattle are handled in similar conditions, which limit the diagnostic possibilities of platelet analysis and require the confirmation of platelet concentration by microscopic examination of blood smears.
The QCs reported in our study were not based on a CLSI procedure, which we had reported previously. 2 Daily QC measurement obtained throughout our study period were considered more relevant. Between-series imprecision and bias were similar between the previous study and our current study except for a higher imprecision of reticulocyte indices in our current study. The imprecision of the manual differential was not evaluated in our study because it has already been reported that inherent imprecision is high given the low number of cells counted. 16 This implies that the manual differential WBC RIs must be used with corresponding caution. However, WBC differentials were necessary to identify cell subtypes that are not separated by the automatic analyzer.
Distributions of RBC counts, most of the RBC-derived variables (HGB, RBC-HGB, HCT, MCV, MCH and MCHC), and WBC counts were almost symmetrical and close to Gaussian as observed visually, which was confirmed by comparing the means and medians, and by normality tests. Nevertheless, many other distributions were skewed to the right with a broadening of the CI for the upper limit of the RI, as is frequently observed for hematology variables even in more homogeneous groups such as laboratory Beagles.2,3
Most of the RIs for erythrocyte variables established in our study are similar to those reported previously 33 using a flow cytometry analyzer (Table 2). Except for MCHC, the RIs for the RBC counts and related indices are slightly wider than those obtained in previous studies. For example, the RI for HGB in our study (82–130 g/L) is wider than in previous studies in which it was 84–120 g/L 33 and 85–122 g/L. 9 This difference may be partly explained by the equal division of the reference sample group into beef and dairy cows, and lactating and non-lactating animals, whereas the previous RIs were solely established in milking dairy cows. Although a statistically significant effect of the stage of lactation was observed for HGB, the partitioning of RI into subclasses was not appropriate. A similar trend was observed for HCT. Breed and stage-of-lactation differences have already been reported for RBC counts in reviews and textbooks, with beef cattle or non-lactating cows having higher RBC counts than dairy or lactating cattle.18,23 To our knowledge, the only recent study that partitioned RIs in cattle according to the type of production obtained narrower RIs for HGB with 118–121 g/L and 88–92 g/L for beef and dairy cows, respectively. 16 However, in that previous study, all of the animals were bred by the same institute, and the stage of lactation of the dairy cows was not mentioned.
To our knowledge, RBC-HGB, RET-HGB, and Delta-HGB have not been investigated in cattle. These novel RIs may provide a basis to investigate iron deficiency anemia.22,24,27,32
The RI for WBC (Table 3) was narrower than reported previously. 10 , 33 The lower limit of the RI for the neutrophil count was similar to the cattle values published initially,4,25 and lower than those established more recently in dairy cattle.9,33 Our results are not consistent with the trend toward a higher neutrophil count described in a previous study. 9 Potential causes could be related to the reference population, in particular the breed and genetics, stage of lactation, and even the environment or diet. The specific impact of breed should be further examined.
Comparison of the manual and analytical methods used to determine the concentrations of leukocyte types revealed a difference in the upper limit of the lymphocyte count. This may be the result of the morphologic characteristics of cattle lymphocytes.9,33 The traditional manual grading of lymphocytes as small, medium, or large was simplified in our study to small-or-medium and large in view of the paucity of the smallest lymphocytes and the difficulty of distinguishing them from the predominant medium-sized lymphocytes. Large agranular lymphocytes were challenging, if not impossible, to distinguish from monocytes. These microscopic observations may explain the typical cattle DIFF scattergram in which the dot plots of lymphocytes and monocytes are very close together or even contiguous (Fig. 2A). As reported in previous studies and other species,1,19 careful observation of the DIFF scattergrams could be used as a screening tool to detect CBC abnormalities before blood film evaluation. Such abnormalities could result from the presence of abnormal cells or pre-analytical problems. Abnormal scattergrams were observed in our study when numerous platelet clumps were present on the blood smear (Fig. 2B, 2C).
Although subject to high imprecision, the manual differentials of our study provided a novel opportunity to identify and count the different types of lymphocytes and neutrophils in a large reference sample group, compare them to DIFF scattergrams, and determine corresponding RIs for those types of cells that are not differentiated by automatic analyzers. These differentials revealed that most of the lymphocytes were small or medium-sized and provided new information about the large granular lymphocytes often associated with natural killer cells. 28 It would be interesting to explore the clinical value of enumerating large granular lymphocytes in diseased cows.
Effects of age on bovine hematologic variables have been reported but mainly concern changes in young animals.4,18,20,29 A decrease in RBC counts and increase in MCV were previously reported during the first 6 mo of life, 4 and total WBC counts tended to be higher in animals <3-y-old than in older ones. 18 In our study, most age-related variations associated with the wide age range of the adult cows seemed to follow the trends already observed in previous studies.4,18,20,29
RIs were determined under controlled pre-analytical and analytical conditions in a well-characterized sample group of cows representative of the larger French cattle population, and according to international recommendations. These RIs cannot be adopted without validation or transfer procedures using other equipment, and would not be valid for other populations of cows including those that differ from this sample group in sex, age, breed, etc. Laboratories should establish their own appropriate RIs as per ASVCP guidelines. 6
Supplemental Material
DS1_JVDI_10.1177_1040638718790310 – Supplemental material for Hematology reference intervals for adult cows in France using the Sysmex XT-2000iV analyzer
Supplemental material, DS1_JVDI_10.1177_1040638718790310 for Hematology reference intervals for adult cows in France using the Sysmex XT-2000iV analyzer by Nicolas Herman, Catherine Trumel, Anne Geffré, Jean-Pierre Braun, Marion Thibault, François Schelcher and Nathalie Bourgès-Abella in Journal of Veterinary Diagnostic Investigation
Supplemental Material
DS2_JVDI_10.1177_1040638718790310 – Supplemental material for Hematology reference intervals for adult cows in France using the Sysmex XT-2000iV analyzer
Supplemental material, DS2_JVDI_10.1177_1040638718790310 for Hematology reference intervals for adult cows in France using the Sysmex XT-2000iV analyzer by Nicolas Herman, Catherine Trumel, Anne Geffré, Jean-Pierre Braun, Marion Thibault, François Schelcher and Nathalie Bourgès-Abella in Journal of Veterinary Diagnostic Investigation
Supplemental Material
DS3_JVDI_10.1177_1040638718790310 – Supplemental material for Hematology reference intervals for adult cows in France using the Sysmex XT-2000iV analyzer
Supplemental material, DS3_JVDI_10.1177_1040638718790310 for Hematology reference intervals for adult cows in France using the Sysmex XT-2000iV analyzer by Nicolas Herman, Catherine Trumel, Anne Geffré, Jean-Pierre Braun, Marion Thibault, François Schelcher and Nathalie Bourgès-Abella in Journal of Veterinary Diagnostic Investigation
Footnotes
Declaration of conflicting interests
The authors declared no potential conflicts of interest with respect to the research, authorship, and/or publication of this article.
Funding
The authors received no financial support for the research, authorship, and/or publication of this article.
References
Supplementary Material
Please find the following supplemental material available below.
For Open Access articles published under a Creative Commons License, all supplemental material carries the same license as the article it is associated with.
For non-Open Access articles published, all supplemental material carries a non-exclusive license, and permission requests for re-use of supplemental material or any part of supplemental material shall be sent directly to the copyright owner as specified in the copyright notice associated with the article.