
Abstract
Virulent ovine foot rot is a contagious foot disease. Given the development and validation of a real-time PCR to detect Dichelobacter nodosus isolates that contain the virulence-associated protease genes aprV2 and aprB2, the diagnosis of foot rot has made considerable progress. We evaluated pooling methods to reduce the number of samples during a foot rot control program. Samples of individual feet were compared to a 4-feet sample of the same sheep. All further analyses based on 4-feet samples (pools-of-5 and pools-of-10 4-feet samples) were compared to samples of individual sheep, and a risk-based herd sampling was evaluated and compared to the whole flock. The sensitivity and specificity of the 4-feet samples for detection of aprV2-positive strains was 93.8% (CI: 87.6–97.5%) and 98.3% (CI: 96.5–99.3%), respectively. The sensitivity and specificity of the pools-of-10 was 86.7% (CI: 78.4–92.7%) and 100.0% (CI: 97.4–100%), respectively. Pools-of-5 were not significantly more sensitive than pools-of-10. The pooling of 4 individual foot samples into one 4-feet sample is an adequate method to reduce the number of samples of individual sheep. The sensitivity of pools-of-5 and pools-of-10 is too imprecise for a control program. Risk-based sampling allowed for a substantial reduction of samples to be tested, had a sensitivity of 95.8% (CI: 78.9–99.9%) and specificity of 100.0% (CI: 88.1–100.0%) when determining the foot rot flock status, and represents an adequate methodology to predict within-flock freedom from infection.
Introduction
Dichelobacter nodosus is the infectious agent of ovine foot rot.2,3,6,13 Foot rot is a contagious foot disease and the most common cause of lameness in sheep.1,21 In many countries, foot rot is endemic.16,20 The clinical forms of foot rot may vary from slight interdigital dermatitis (clinically benign foot rot) to severe under-running and separation of the sole and claw horn (clinically virulent foot rot).17,22 The clinically virulent form represents a major animal welfare issue and leads to economic losses. 22 Different methods to control ovine foot rot at the clinical level have been described. Control of virulent foot rot has been achieved by claw trimming, foot baths, vaccines, topical and systemic antibiotics, culling of infected sheep during a non-transmission period, and several combinations thereof.4 ,5,7,9 –11,15
The diagnosis of foot rot was traditionally based on the characteristic clinical signs 17 and was, therefore, a subjective evaluation. In 2014, a competitive real-time (rt)PCR, detecting the genes coding for the proteases AprV2/AprB2, was established and represents a useful tool that can also be used in a foot rot control program. 18 This rtPCR test distinguishes between the protease genes aprV2 and aprB2 and thereby allows for the direct detection and differentiation of virulent and benign strains of D. nodosus. AprV2 encoded by the gene (aprV2) has been identified as the main virulence factor of D. nodosus, 13 and samples from sheep with clinically virulent foot rot were almost always positive for aprV2.8,18,19 In a longitudinal study of 9 sheep flocks without clinical signs of foot rot over 12 mo, aprV2-positive strains of D. nodosus were detected in 100 of 827 samples, indicating that silent carriers of aprV2-positive strains exist. 14
Because of rising public pressure, mainly based on animal welfare issues, the Swiss government decided to study the option of a nationwide foot rot control program. The aim of the control program is to reduce the proportion of flocks with sheep carrying aprV2-positive D. nodosus strains to <1% of the Swiss sheep population. In a proof-of-concept study, eradication of aprV2-positive D. nodosus from the feet of 28 sheep flocks was successfully achieved. 9 The program consisted of weekly foot baths of all sheep of the respective flocks in a 10% ZnSO4 solution for 6–8 wk, and segregation or culling of non-responders, thereby avoiding the use of antibiotics or vaccinations. 9 A flock was given the status “free-of-virulent-foot rot” as soon as all 4 feet of all sheep in the flock tested negative for the presence of the aprV2 gene, using the competitive rtPCR. Given the large number of samples analyzed during treatment, different pooling methods on animal and flock level were tested. We evaluated and describe herein different possibilities to reduce the number of samples, using pooling methods that would be subsequently used during treatment and follow-up surveillance phases of a foot rot control program.
We evaluated pooling into 4-feet samples from individual sheep instead of testing individual foot samples. Based on these results, all other pooling methods were performed with 4-feet samples. Further, we compared pooling of 10 or five 4-feet samples versus testing of individual 4-feet samples. We additionally evaluated the risk-based sampling and the pooling of ten 4-feet samples of risk-based samples for analysis of the herd status.
Materials and methods
Our project was performed with the permission of the Veterinary Office of the canton of Grisons, Switzerland (animal experimentation permission GR 2011-02) and under the supervision of the Swiss Federal Food Safety and Veterinary Office.
Selection of sheep and status definition of flocks and sheep
The samples analyzed and used for evaluation of the different pooling methods were collected from October 2013 until May 2016 from 2 published studies, one a proof-of-concept study for flock treatment 9 and the other an evaluation of the prevalence of D. nodosus in a longitudinal study. 14 Additional samples came from specimens collected at sheep shows. The status of an individual sheep was defined as aprV2-positive if at least one foot tested positive for aprV2 by rtPCR. The status of a flock was aprV2-positive if at least one sheep tested positive for aprV2 by rtPCR.
Lesion scoring and collection of samples
Each individual foot was visually scored according to the scoring system of the Swiss Consulting and Health Service for small ruminants (Beratungs- und Gesundheitsdienst für Kleinwiederkäuer; Table 1), which was adapted from a previously described scoring system. 6 The foot with the highest score determined the clinical score of the sheep (maximum foot score). The samples were harvested with previously sterilized cotton swabs (Applimed, Châtel-St-Denis, Switzerland) from the axial aspect of the interdigital space. If a typical clinical foot rot lesion was evident, the sample was taken from the outer rim of the lesion. The following standardized protocol was used. Before sampling, the interdigital space was cleaned from gross dirt by wiping one thumb through the interdigital space without touching the interdigital skin. Fresh disposable gloves were used for every sheep that was tested. For the individual foot sample, an individual swab was taken of each foot and completely rotated around its long axis (360°). For a 4-feet sample of a single sheep, a 90° sector of one swab was used for each foot. Afterwards, each swab was put into a well in a 96 deep-well plate (Axygen 96 well clear round bottom 2 mL polypropylene deep well plate, Chemie Brunschwig, Basel, Switzerland) that contained 1 mL per well of SV lysis buffer (4 M guanidine thiocyanate, 0.01 M Tris–HCl [pH 7.5], 1% β-mercaptoethanol) for at least 1 min and then discarded. In the 96 deep-well plate, only the odd-lines and every other row were filled to prevent contamination of samples within the plate during charging and transportation; hence each plate contained a maximum of 24 samples. The filled deep-well plate was sealed with a silicone cover (Chemie Brunschwig), transported within 36 h to the laboratory, and then stored in a refrigerator at 4°C until further processing (DNA extraction for the rtPCR analysis, or freezing at −20°C) within 1 wk. During the sampling process in the field and the transportation to the laboratory, no special cooling was applied. Unless otherwise stated, samples were processed and analyzed in a single laboratory (Amt für Lebensmittelsicherheit und Tiergesundheit, Biologie-Labor, Veterinärdiagnostik, Chur, Switzerland).
Foot rot clinical lesion scoring according to Swiss Consulting and Health Service for small ruminants.
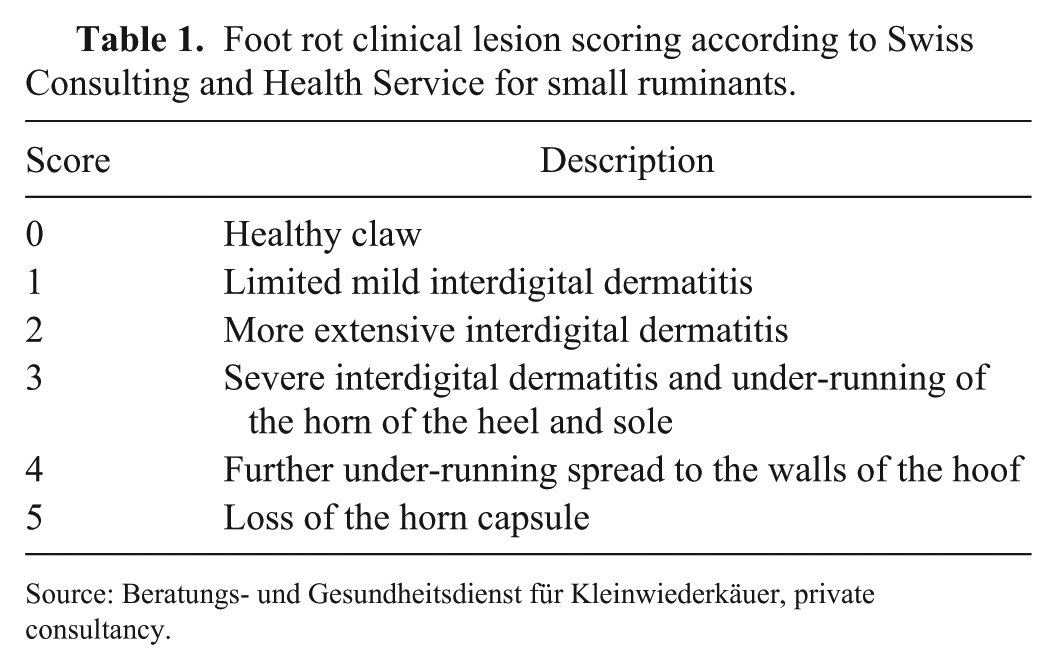
Source: Beratungs- und Gesundheitsdienst für Kleinwiederkäuer, private consultancy.
Laboratory analyses: DNA extraction, rtPCR analysis, interpretation of threshold cycle value
The DNA was extracted semi-automatically from a 500-µL sample using a previously described protocol 18 (KingFisher Flex extraction robot, Thermo Fisher Scientific, Reinach, Switzerland). The surplus of the original sample was pipetted into tubes or remained in the deep-well plate and was frozen within 1 wk at −20°C. In addition, the extracted DNA was frozen at −20°C until further processing within 1 wk. Extracted DNA was analyzed by competitive rtPCR as described 20 (LightCycler 480 real-time PCR system, Roche Diagnostics, Rotkreuz, Switzerland). This rtPCR distinguished between the virulent thermostable protease gene aprV2 and the benign thermosensitive protease gene aprB2. All rtPCR reactions were analyzed in duplicate, the mean threshold cycle (Ct) value was used for further analyses, and values ≥40 were rated negative. As an exception, in pools-of-10 and pools-of-5, a Ct of 40 of only one of the duplicates was rated as a weakly positive result because a 1:10 dilution causes a mathematical increase of 3.3 Ct values (23.3 ~ 10). The interpretation of the Ct values was strongly positive (Ct < 30), positive (Ct 30–37), and weakly positive (Ct 37 ≤ 40).
Individual foot samples versus one 4-feet sample
For this analysis, 522 sheep from the proof-of-concept study 9 and the longitudinal study 14 were used, of which 296 originated from flocks without clinical signs of foot rot (scores of all sheep <2) and 226 were from flocks with at least 1 sheep with clinical signs of foot rot (score ≥2) and an aprV2-positive rtPCR result in at least 1 individual foot sample. The individual foot samples were always collected prior to the 4-feet samples from the same sheep. The individual foot samples were used as the gold standard on sheep level. This gold standard status was compared with the result of the 4-feet sample. All further evaluated pooling methods were based on the results of this pooling method and were thus performed with 4-feet samples.
Ten 4-feet samples versus one pool-of-10
In total, 240 pools-of-10 were analyzed. For this analysis, 4-feet samples from the proof-of-concept study 9 were used and consisted of 154 frozen samples and 86 fresh samples. We sought to achieve an accurate total pooled volume of 500 µL before extraction. Hence, 54 µL of each 10 samples were pipetted (as there is always some loss of liquid at the pipette tip) and then mixed into a new tube for DNA extraction. Only animals from within the same flock were added to the same pool. The 4-feet samples were used as the gold standard (i.e., if at least 1 of the ten 4-feet samples was positive for aprV2, the status of the 10 sheep pooled was rated aprV2-positive).
Pools-of-5 versus pools-of-10
For this analysis, 280 fresh 4-feet samples collected from sheep at shows were used. To prepare a pool-of-5, 108 µL from each of the five 4-feet samples was pipetted into a tube and then further processed. The amount of 108 µL was used to allow direct comparison with the pools-of-10. The pools-of-10 were prepared as mentioned above. All samples (280 4-feet samples, 56 pools-of-5, and 28 pools-of-10) were processed and analyzed at the Institute of Veterinary Bacteriology of the Vetsuisse-Faculty, University of Bern. The extraction was performed (KingFisher Flex extraction robot, Thermo Fisher Scientific) as described above. The analysis of the extracted DNA followed the described protocol 18 except for the master mix (TaqMan Fast Advanced Master Mix, Thermo Fisher Scientific) and the PCR machine (ABI 7500 Real-Time PCR system, Thermo Fisher Scientific). The 4-feet samples were used as the gold standard. If at least 1 of the 5 or 1 of the ten 4-feet samples was positive for aprV2, the status of the 5 or the 10 pooled sheep was rated aprV2-positive, respectively.
Risk-based sampling for herd-level surveillance
Overall, risk-based sampling was performed with 53 flocks from the proof-of-concept study. 9 Of these 53 flocks, 23 flocks included at least 1 sheep that was clinically affected and positive for aprV2. The analyses of these flocks were performed with frozen 4-feet samples. The other 30 flocks were free of clinical disease and had no aprV2-positive result at the last control check after the successful elimination of the aprV2-positive strains of D. nodosus (the analysis of these flocks used fresh 4-feet samples). The sample size for detecting aprV2-positive flocks was estimated using EpiTools (https://goo.gl/2K7X9U) for calculation of sample size for demonstrating disease freedom (Supplementary Table 1). We assumed a minimal within-flock prevalence of 20% based on a previous study. 9 Diagnostic test sensitivity of 90% and specificity of 98% were assumed to determine the sample size needed for a 95% chance of detecting positive flocks. The following factors were defined as high-risk in descending order of importance according to reported risk: clinical lameness present, newly purchased sheep, sheep that recently participated in a sheep show, and sheep for which previous contact with other flocks could not be excluded. 1 A sheep was classified as high-risk if at least one of these factors was present. The following factors were defined as moderate-risk in descending order of importance: sheep with known previous claw problems, and rams and sheep with poor claw quality, the latter according to the subjective estimation of the farmer. If necessary, additional sheep were randomly selected from the flock to reach the calculated sample size.
Pooling of ten 4-feet samples of the risk-based samples (risk-based pool-of-10)
In total, samples from 45 flocks, which were also used for the risk-based sampling for herd-level surveillance, were included in this analysis. A total of 15 flocks included at least 1 sheep that was clinically and aprV2-positive. However, from 8 of these 15 flocks, not enough frozen material was available for the risk-based pool-of-10. The risk-based samples of each flock were allocated to 2 or 3 pools-of-10, depending on the calculated sample size for the respective flock size. In pool I, all high-risk animals were included; if the number of high-risk animals was <10, moderate-risk animals were added. In pools II and III, remaining high-risk and moderate-risk animals and randomly selected animals were included. The results of the 10 individual risk-based samples of each pool were used as the gold standard.
Statistical methods
The data were transferred onto a spreadsheet (MS Excel 2010, Microsoft, Redmond, WA). WinEpiscope 2.0 (Epidecon, Wageningen, The Netherlands) was used for further processing and analyses. The sensitivity and specificity of pooled samples and their respective confidence intervals (CI) compared to individual samples were calculated with the exact method. The sample size for determining the sensitivity and specificity of pooled versus individual samples was calculated with WinEpiscope 2.0. A minimal sample size of 100 pools per comparison was needed to allow estimation of sensitivity and specificity with a precision of ±4.3%, assuming 95% sensitivity or specificity, respectively, and a level of confidence of 95%. For the comparison of pools-of-5 versus pools-of-10, a considerably smaller sample size was available, resulting in less precise estimates (precision of ±9.3 to ±11.9%).
Results
Individual foot samples versus one 4-feet sample
A total of 2,088 individual foot samples and 522 4-feet samples from 522 sheep were analyzed, with 410 sheep being aprV2-negative and 112 being aprV2-positive. The sensitivity and specificity of the 4-feet samples for detection of aprV2-positive strains of D. nodosus were 93.8% (CI: 87.6–97.5%) and 98.3% (CI: 96.5–99.3%), respectively (Table 2). Of the 112 aprV2-positive sheep, 7 were false negative in the 4-feet sample. The Ct range of values of individual foot samples of these 7 false-negative sheep was 36.8–39.4 (Supplementary Table 2). In 6 of these 7 sheep, only 1 of the 4 individual foot samples was aprV2-positive and, in 1 sheep, 2 individual foot samples were aprV2-positive.
Sensitivity and specificity of different pooling methods to detect aprV2-positive samples.
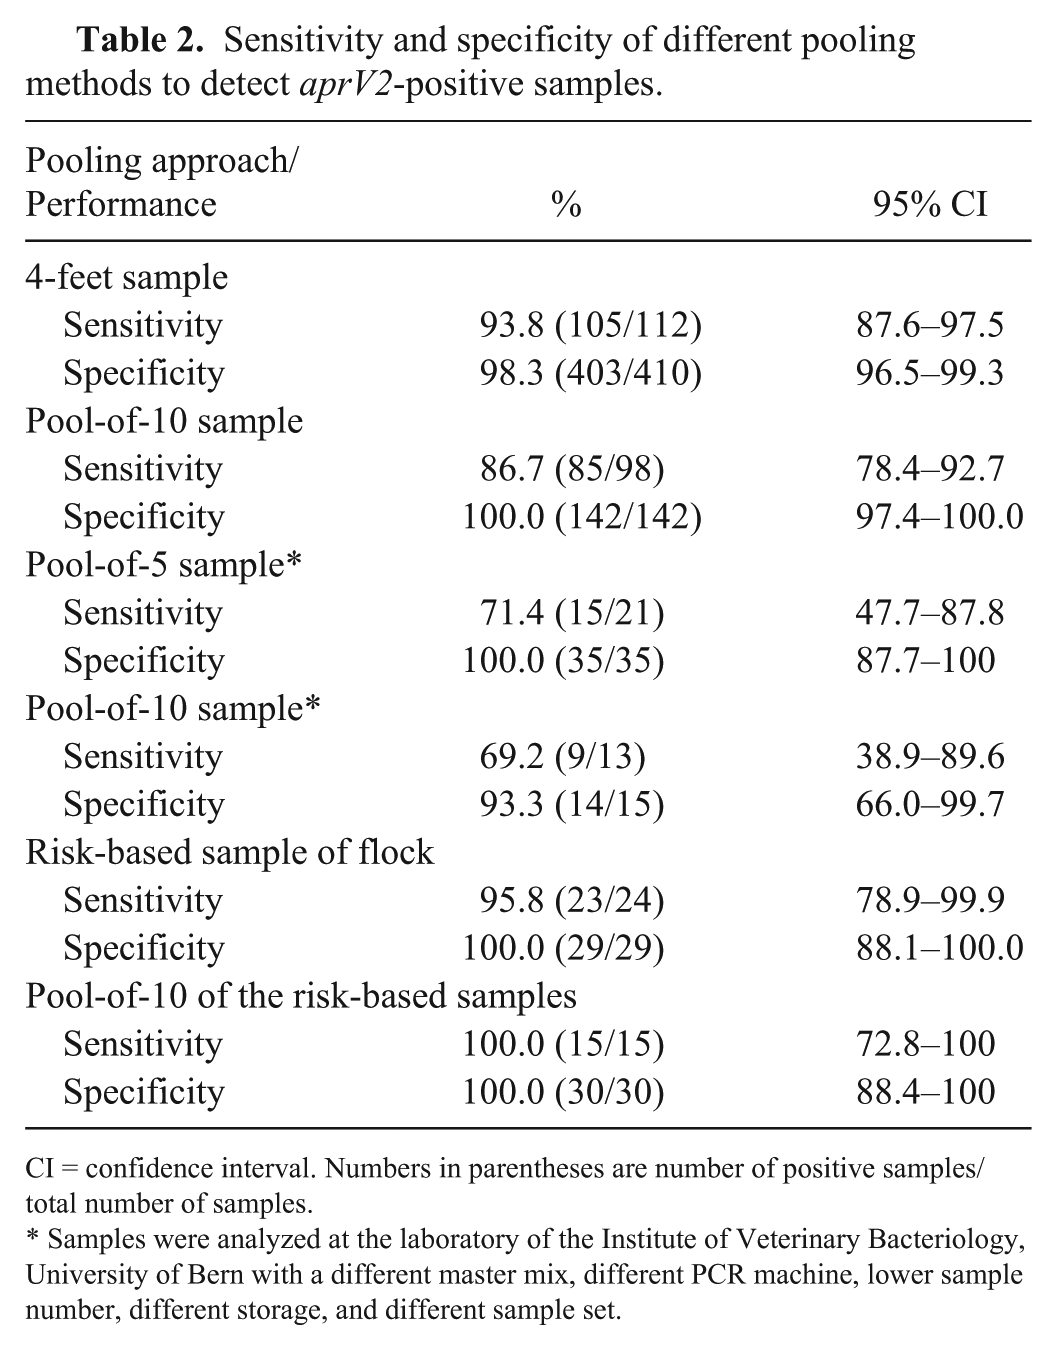
CI = confidence interval. Numbers in parentheses are number of positive samples/total number of samples.
Samples were analyzed at the laboratory of the Institute of Veterinary Bacteriology, University of Bern with a different master mix, different PCR machine, lower sample number, different storage, and different sample set.
Pooling of ten 4-feet samples in the laboratory (pool-of-10)
In total, 240 pools-of-10 were assembled and analyzed, 98 being aprV2-positive and 142 being aprV2-negative. The sensitivity and specificity of the pools-of-10 was 86.7% (CI: 78.4–92.7%) and 100.0% (CI: 97.4–100%), respectively (Table 2). According to the gold standard, 13 of the 98 aprV2-positive pools were false negatives in the pools-of-10. The Ct range of values of the 4-feet samples included in the false-negative pools-of-10 was 31.1–39.8 and is listed in detail in Supplementary Table 3.
Pools-of-5 versus pools-of-10
Of the 56 pools-of-5, 21 were aprV2-positive and 35 were aprV2-negative. The sensitivity and specificity of the pools-of-5 was 71.4% (CI: 47.7–87.8%) and 100% (CI: 87.7–100%), respectively (Table 2). Six of the 35 aprV2-negative samples were determined to be false negative according to the 4-feet samples. The Ct range of values of the 4-feet samples included in the false-negative pools-of-5 was 35.0–36.2 and is shown in detail in Supplementary Table 4. Analysis of the 28 pools-of-10 showed that 13 pools-of-10 were aprV2-positive and 15 were aprV2-negative. The sensitivity and specificity of the pools-of-10 were 69.2% (CI: 38.9–89.6%) and 93.3% (CI: 66–99.7%), respectively (Table 2). The 4 aprV2 false-negative pools contained 4-feet samples with a Ct value range of 35.1–36.2; the aprV2 false-positive pool showed a Ct value of 35.3. More details are listed in Supplementary Table 4.
Risk-based sampling of flocks
Risk-based sampling was examined in 53 flocks. All 23 flocks with known clinically affected sheep and with individual sheep revealing an aprV2-positive result in the 4-feet samples were also identified as aprV2-positive in the risk-based selection. One of the 30 flocks with clinically negative status, but with 1 sheep giving a weakly aprV2-positive (Ct = 39.05) result in the 4-feet sample, tested negative in the risk-based sample. This weakly positive sheep was not included in the risk-based selection, and the flock was clinically examined and retested 3 wk later. In the follow-up, all sheep in the flock were aprV2-negative and clinically negative. The sensitivity and specificity on the flock level using risk-based sampling were 95.8% (CI: 78.9–99.9%) and 100.0% (CI: 88.1–100%), respectively (Table 2).
Risk-based samples versus risk-based pool-of-10
All 15 flocks that were identified as aprV2-positive in the risk-based samples also tested positive in at least 1 risk-based pool-of-10. Pool I (high-risk sheep) was aprV2-positive in all 15 tested flocks (100%; 95% CI: 72.8–100%). All 30 flocks that were identified as aprV2-negative in the risk-based samples also tested negative in all risk-based pools-of-10 (Table 3).
Threshold cycle (Ct) values of the 3 pools-of-10 of the risk-based samples of 15 clinically positive and aprV2-positive flocks.
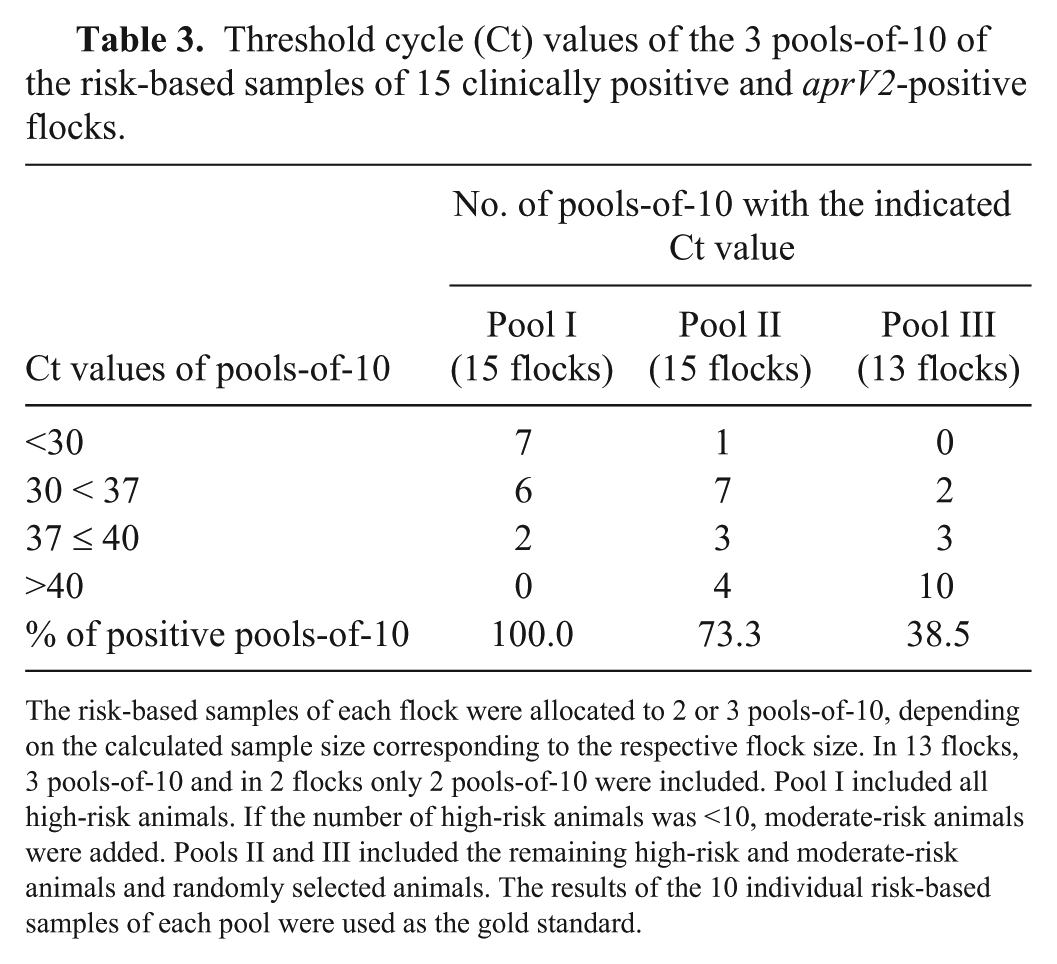
The risk-based samples of each flock were allocated to 2 or 3 pools-of-10, depending on the calculated sample size corresponding to the respective flock size. In 13 flocks, 3 pools-of-10 and in 2 flocks only 2 pools-of-10 were included. Pool I included all high-risk animals. If the number of high-risk animals was <10, moderate-risk animals were added. Pools II and III included the remaining high-risk and moderate-risk animals and randomly selected animals. The results of the 10 individual risk-based samples of each pool were used as the gold standard.
Discussion
Four-feet pooling led to a minor loss of sensitivity to 93.8% and of specificity to 98.3%. Real-time PCR results with a Ct value >37 are inaccurate, because the amount of DNA is very small. 12 It must be considered that the 4-feet sample swab was taken after the individual foot sample swabs. Therefore, it seems possible that existing DNA had already been removed by the first sampling, and the 4-feet sample underestimated the true results. On the other hand, it seems likely that in a few sheep, DNA material was only present in the 4-feet samples but not in the individual foot samples, explaining the imperfect specificity of 98.3%. It cannot be completely excluded that cross-contamination occurred in the laboratory during pooling. However, no evidence was found for cross-contamination. Although both sensitivity and specificity of the 4-feet samples were not perfect, this pooling method was used as the gold standard for further analyses. This was justified by the following reasons: 1) reduction of the samples to be analyzed was considerable, and 2) sensitivity of individual foot samples was not 100% because the sampling method did not aim at removing all of the affected interdigital tissue. We concluded that the small loss of sensitivity caused by using 4-feet samples as compared to 4 individual foot samples can be ignored in practical settings, as several animals were to be tested to determine the foot rot status of a flock. All further pooling investigations were, therefore, based on 4-feet samples.
As expected, pooling of ten 4-feet samples to a pool-of-10 led to a considerable loss of sensitivity because a dilution of factor 10 corresponds to ~3.3 Ct values, given a doubling of PCR products every cycle. 12 Pooling with a dilution of 10 is safe and meaningful only if at least 1 sheep with a strongly positive result (<31) is part of the pool. Therefore, we investigated the use of smaller pools by comparing sensitivity and specificity of pools-of-5 and pools-of-10. Although, during statistical analysis, the CIs were not corrected for clustering at the flock level, our results clearly suggest that the considerable loss of sensitivity of both pooling approaches precludes use of these approaches as a tool in a foot rot treatment program. The differences in sensitivity and specificity between the laboratories, in particular with the pool-of-10, can be explained by the difference in PCR machine and master mix used, and/or that a much smaller sample size was used for the direct comparison. However, the most influential difference might be the difference in prevalence between the sample sets used, as it is well known that the amount of DNA present in foot rot lesions depends, to a considerable degree, on the stage of the lesion.9,18,19 Although mainly positive flocks undergoing treatment were sampled in the first round, for direct comparison, sheep at markets were sampled. In the latter case, mainly clinically healthy animals are brought to these places. It can be expected that the sensitivity of pooled samples is higher if the pools contain sheep with clinical disease and low Ct values.
Risk-based sampling proved to be a very suitable tool to determine the foot rot status of individual flocks. The estimated sample size was based on empirical data from different investigations performed by the authors during previous years. The sample size should be re-evaluated as soon as exact prevalence data of a population of interest are available. The definition of high-risk animals as a potential source of infection of herd mates was performed as described previously. 1 Selection of the sheep to be sampled should be performed with the utmost care to achieve a reliable result. The selection procedure may be time consuming because individual sheep must be identified within the flock and physically picked out thereafter. The risk-based pool-of-10 seems to be a suitable technique for analysis of the status of a certain flock. However, careful selection of the high-risk and moderate-risk animals is again extremely important.
Footnotes
Acknowledgements
We thank R Lüchinger, G Bearth, R Hanimann, J Eitel, and C Haerdi for stimulating discussion leading to this project, the laboratory team of Chur for technical support, and E Hehenberger and A Pilot for editorial revision of this manuscript.
Declaration of conflicting interests
The authors declared no potential conflicts of interest with respect to the research, authorship, and/or publication of this article.
Funding
This study was supported by a grant from the Swiss Federal Food Safety and Veterinary Office FSVO (1.15.04).
References
Supplementary Material
Please find the following supplemental material available below.
For Open Access articles published under a Creative Commons License, all supplemental material carries the same license as the article it is associated with.
For non-Open Access articles published, all supplemental material carries a non-exclusive license, and permission requests for re-use of supplemental material or any part of supplemental material shall be sent directly to the copyright owner as specified in the copyright notice associated with the article.