
Abstract
Microbial overgrowth can interfere with Mycobacterium avium subsp. paratuberculosis (MAP) growth and detection. We estimated the percentage of positive samples by PCR performed on the incubated media of individual fecal samples classified as non-interpretable (NI) by bacteriologic culture of liquid media. A total of 262 liquid cultures declared NI and 88 samples declared negative were included in the study. MAP DNA was detected in 7 NI samples (2.7%; 95% CI: 1.1–5.4%) and in 1 negative sample (1.1%; 95% CI: 0.3–6.2%). The PCR allowed the detection of MAP-positive samples that had been missed in the initial bacteriologic culture. However, the benefit of these few additional positive results must be weighed against the additional costs incurred. Using PCR to classify overgrown cultures optimizes the detection process and eliminates the NI outcome.
Mycobacterium avium subsp. paratuberculosis (MAP) is the etiologic agent of paratuberculosis, a chronic incurable contagious enteric disease of ruminants found the world over. 6 Fecal culture is challenging because the presence of normal microbial flora may interfere with the slow growth and identification of MAP. 10 Nevertheless, bacteriologic culture remains the reference antemortem detection test despite the overgrowth of other microorganisms, the long laboratory turnaround time, and the relatively high cost. 10 To reduce microbial overgrowth, a decontamination step is performed before samples are inoculated into the culture medium. This step involves double incubation centrifugation and the addition of antimicrobials to the culture medium prior to incubation in the automated system. After incubation, confirmation of MAP detection is made by phenotypic or genotypic techniques such as acid-fast bacilli (AFB) stain or PCR.
When microbial overgrowth occurs and MAP is not identified by AFB, culture results are classified as non-interpretable (NI). This outcome does not provide useful information. The proportion of overgrown samples (classified as NI) is variable across studies (0.13–60%) 10 and is associated with multiple factors such as diet, geographic location, or culture medium used. 9 A previous study evaluating a PCR assay found MAP DNA in 1.6% of the NI environmental samples 2 when applied before and after incubation of the samples in an automated system. The NI environmental samples in that study (n = 62) were matched by farm, environmental site, and sampling season with 62 negative environmental samples. All of the available positive environmental samples (n = 30) were also analyzed.
We evaluated the overgrowth of samples cultured for MAP but from a different perspective: using individual fecal samples. Environmental samples contain substances that may inhibit MAP identification by PCR. Because inhibitors present in environmental samples may differ from those present in individual fecal samples, 7 the proportion of samples found positive by PCR might be different among NI individual fecal samples and NI environmental samples.
PCR inhibitors are a very heterogeneous group of organic and inorganic chemical substances. Fecal samples contain highly variable components depending on nutrition, environment, and other factors. Polysaccharides are the most common inhibitors found in fecal samples (as well as chlorophyll, bile salts, urea, and glycolipids). 7 Inhibitors contribute to the degradation or sequestration of nucleic acids by changing their chemical properties, and inhibiting DNA polymerase or reverse transcriptase activity. 7 Our objective was to estimate the percentage of positive samples by PCR performed on the incubated media of individual fecal samples classified as NI.
Stored individual fecal samples analyzed as part of other paratuberculosis research projects were selected based on culture result. In 2010, 1,276 individual fecal samples from 17 dairy farms were analyzed. Of these, 262 (20%) were NI and were included in our study. Negative samples (n = 88) were prospectively selected among negative cultures collected from 3 herds in 2011.
Individual fecal samples were initially processed as described previously, 1 following the recommendations of the manufacturer and the U.S. Department of Agriculture (USDA; Harris B, et al. Laboratory methods for isolation and identification of Mycobacterium avium ssp. paratuberculosis (Johne’s disease). Ames, IA: USDA, National Veterinary Services Laboratories, 2009). Isolation of MAP was achieved using a liquid medium (MGIT Para TB culture medium, BD, Franklin Lakes, NJ) and an automated system (BACTEC MGIT 960 system, BD); MAP culture was performed at the Québec Animal Disease Surveillance Laboratory in Saint-Hyacinthe (Québec, Canada).
An initial 3-d decontamination was carried out on the samples. Initially, a 2 ± 0.2 g sample of feces was diluted into 17.5 mL of sterile distilled water and allowed to settle at room temperature for 30 min. Then, 2.5 mL of the supernatant was transferred aseptically to a 50-mL tube containing 2.5 mL of 15% yeast extract and 0.2 mL of 10% sodium pyruvate. This solution was mixed briefly and incubated for 90 min at 36 ± 1°C. For each fecal sample preparation, 0.3 mL of sterile 5% malachite green solution was added to a solution of 25 mL of sterile half-strength brain heart infusion (BHI) medium and 0.9% hexadecylpyridinium chloride (HPC). Finally, all 5.2 mL of the feces-germination mix were added to the BHI-HPC solution to complete a 30-mL decontamination suspension, which was vortexed briefly and incubated overnight (18–24 h) at 36 ± 1°C. The next day, this decontaminated suspension was centrifuged for 30 min at 900 × g. The supernatant was gently poured off. Then, 1 mL of an antibiotic mix (vancomycin at 100 µg/mL, nalidixic acid at 100 µg/mL, and potency-adjusted amphotericin B at 25 µg/mL) was added to the pellet. The suspension was incubated overnight (18–24 h) at 36 ± 1°C. Also, 1.5 mL of an additive cocktail was added to each culture tube (BD MGIT Para TB culture media, BD). The additive cocktail was composed of bovine albumin, catalase, casein, oleic acid, egg yolk enrichment, sterile water, and antimicrobials (2.5% vancomycin, 2.5% nalidixic acid, and 1% amphotericin B). The tubes were held in a biosafety cabinet at room temperature for 18–24 h. On the third day of the fecal sample processing, the concentrated specimen suspension was mixed by swirling, and 0.1 mL was inoculated into the commercial culture tubes before they were introduced into the automated system (BACTEC MGIT 960 system, BD).
The samples were incubated in the automated system for 49 d. For samples flagged as positive by the automated system, an AFB stain (TB fluorescent stain kit, Fisher Scientific, Ottawa, Ontario, Canada) was performed, and the remaining incubated medium was stored at −80°C for further analysis if required. If the AFB stain was positive, samples were analyzed (TaqMan MAP [Johne’s] reagents, Applied Biosystems, Foster City, CA), DNA extraction was performed (MagMax total nucleic isolation kit, Applied Biosystems), and amplification was achieved using the reagents recommended by the manufacturer. A quantification cycle (Cq) value was used to establish a cutoff to discriminate positive from negative results. Samples were declared positive if Cq < 37. The results of these tests were interpreted as described previously 2 and according to USDA recommendations (Harris B, et al. Laboratory methods). Four scenarios were possible for each sample: (1) absence of growth: considered MAP negative; (2) positive result by the automated system but negative AFB staining: considered NI; (3) positive result by the automated system and positive AFB staining but PCR negative: classified as Mycobacteria other than MAP; (4) positive by all 3 tests (automated system, AFB stain, and PCR): considered MAP positive.
The incubated media for NI and negative samples were analyzed using the commercial real-time PCR (TaqMan MAP [Johne’s] reagents, Applied Biosystems) described previously. Distribution of data was graphically assessed with histograms and normal probability plots. Descriptive analyses were used to estimate the proportion and the 95% confidence intervals (95% CI) of PCR-positive samples among the NI and negatives samples.
After collection, fecal samples were initially stored at −80°C for 71 d on average (range: 7–121 d; median = 60 d; 25% percentile = 56 d; 75% percentile = 91 d) until they were processed for initial MAP culture. The average freezing time for NI samples was 65 days (range: 7–99 d; median = 57 d; 25% percentile = 56 d; 75% percentile = 77 d). For negative samples, mean freezing time was 88 d (range: 53–121 d; median = 93 d; 25% = 69 d; 75% = 108 d). After the initial culture, the incubated media of both NI and negative samples were stored at −80°C for 483 d on average (range: 146–655 d; median = 554; 25% percentile = 168; 75% percentile = 626) until the PCR analysis was performed. It has been suggested that the detection of MAP DNA should not be influenced by the freezing period (especially with a holding temperature of −70°C and with no repetitive freezing and thawing). 3 Hence, in theory, despite a possible decrease in viable MAP, the MAP PCR should be able to detect the target DNA. 3
Time to detection was recorded for initial bacteriologic culture of NI samples. Mean time to detection was 26 d (95% CI: 24.7–27.6), and 64% (n = 168 of 262) of these samples signaled positive before 30 d of incubation.
Overall, MAP DNA was found in 8 of the 350 fecal samples analyzed. The PCR-positive samples originated from 5 different farms. Among NI samples (n = 262), MAP DNA was found in 7 samples (2.7%; 95% CI: 1.1–5.4%) collected from 4 MAP-positive farms. Among the negative samples (n = 88), 1 sample was positive by PCR (1.1%; 95% CI: 0.3–6.2%). This sample was collected from a farm presumed to be negative for MAP.
If only the herds from which NI samples were obtained (n = 13; Table 1) are considered, the mean percentage of NI samples by herd was 19.6% (min: 0.9%; max: 65.0%). However, in 7 of these herds, the percentage of NI samples was <9%. All of the positive PCR results originated from samples taken from 4 herds with a percentage of NI samples >30%. During whole herd screening, 3 of these herds had been identified as MAP positive by at least 1 positive fecal culture (herds: I, K, and L). The herd that had not been identified previously as MAP positive (herd M) had the highest percentage of NI samples (65%) and the highest number of PCR-positive NI samples (n = 3; Table 1).
Distribution of positive samples by PCR performed on incubated medium of non-interpretable (NI) Mycobacterium avium subsp. paratuberculosis individual fecal cultures in 13 Québec dairy herds.*
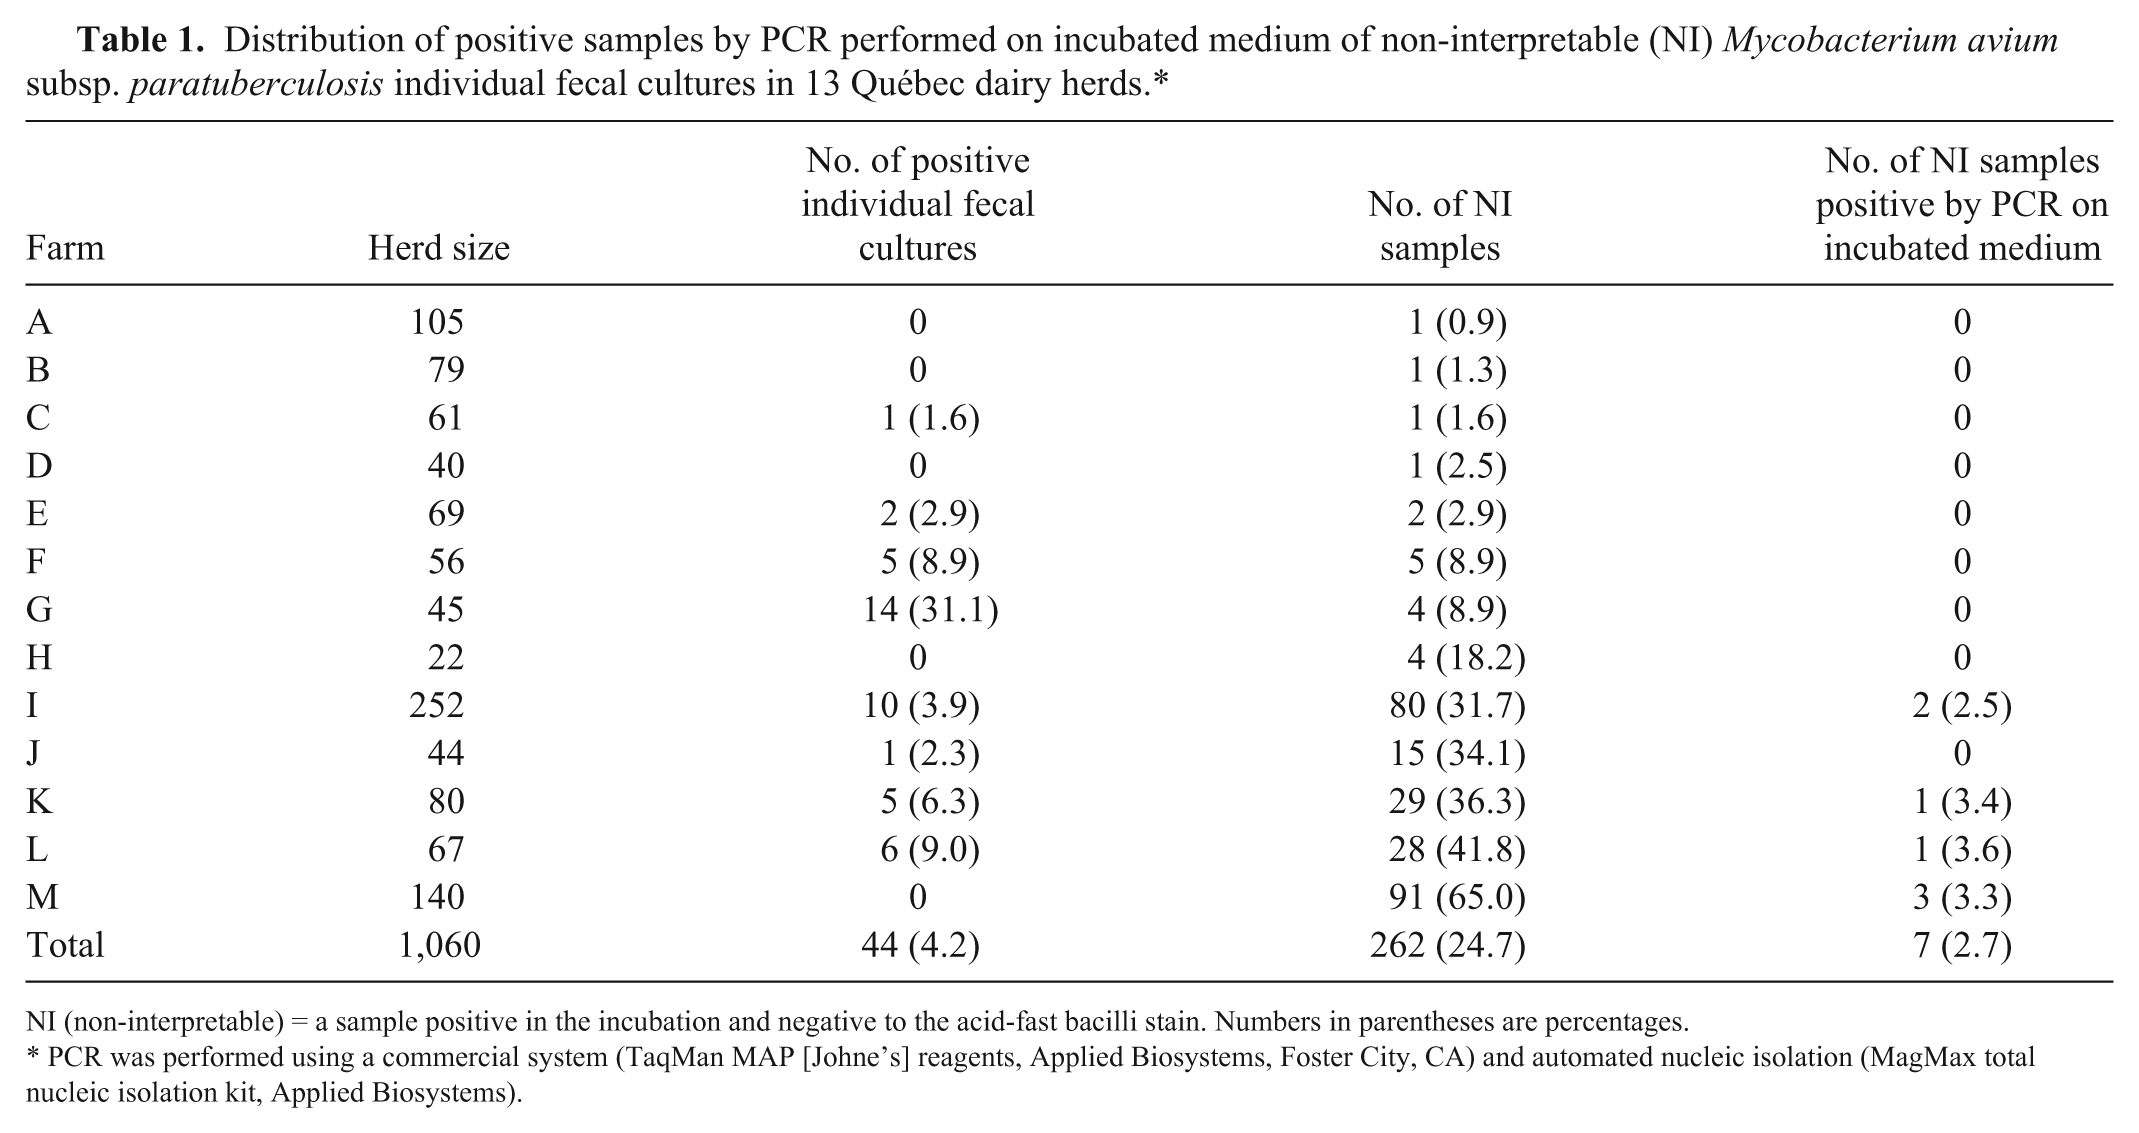
NI (non-interpretable) = a sample positive in the incubation and negative to the acid-fast bacilli stain. Numbers in parentheses are percentages.
PCR was performed using a commercial system (TaqMan MAP [Johne’s] reagents, Applied Biosystems, Foster City, CA) and automated nucleic isolation (MagMax total nucleic isolation kit, Applied Biosystems).
MAP DNA was recovered from 2.7% of NI samples from infected farms. NI samples are believed to be the consequence of the fast growth of other microorganisms that survived the decontamination process. 10 These microorganisms were detected by the automated system and could have competed with and/or inhibited the growth of MAP, thus preventing identification of MAP by AFB staining and lowering the diagnostic sensitivity of culture. There is also a possibility that very low quantities or nonviable MAP were present in those samples. Given that the PCR assay used in our study has a diagnostic specificity estimated to be 100%, 5 false positives are not likely. Microbial overgrowth can interfere with PCR 9 because inhibitors in the sample can change the chemical properties of nucleic acids. 7 Hence, it appears that false negatives are more likely to occur than false positives.
MAP DNA was recovered from one negative sample. The history of the PCR-positive sample from the negative group was examined. This sample originated from a 7.5-y-old Holstein cow with 120 d in milk at the time of sampling. This cow was sampled again during another study 1 with a negative result, and the herd it resided in has never been identified as MAP positive. Given these facts, this PCR result is likely a false-positive result. Avoiding false-positive results is one of the critical control points of laboratory procedures. 4 False positives could be the consequence of cross-contamination at different steps of the laboratory process (e.g., between samples or previous PCR products). 4
Obtaining a NI result can be frustrating for laboratories, veterinarians, and producers, considering the long and costly process of bacteriologic culture and given that the animal or herd status remains in question. The purpose of our study was to estimate the percentage of NI samples that could be MAP-positive. We also considered analyzing the consequences and benefits of using PCR on individual fecal samples declared NI (Table 2). Upon attaining an NI sample, a decision of whether to perform a PCR on the sample has to be made. The benefit of performing a PCR on all NI fecal samples (collected from individual cows) is limited by the cost and the apparently small percentage of positive samples that might be recovered. Moreover, a positive PCR result only indicates that MAP DNA is present in the sample but does not provide information about the viability of the pathogen. The true infection status of the animal sampled may or may not be reflected by the PCR result. At the herd level, this positive PCR result indicates the presence of MAP on the farm. However, if the goal is to determine herd status, individual fecal sampling is not the most cost-efficient strategy. 8 An alternative approach may be to consider NI samples as negative, without performing the PCR. In our study, using this approach would have misclassified <3% of the animals.
Consequences or benefits of using PCR on non-interpretable (NI) samples cultured for Mycobacterium avium subsp. paratuberculosis.
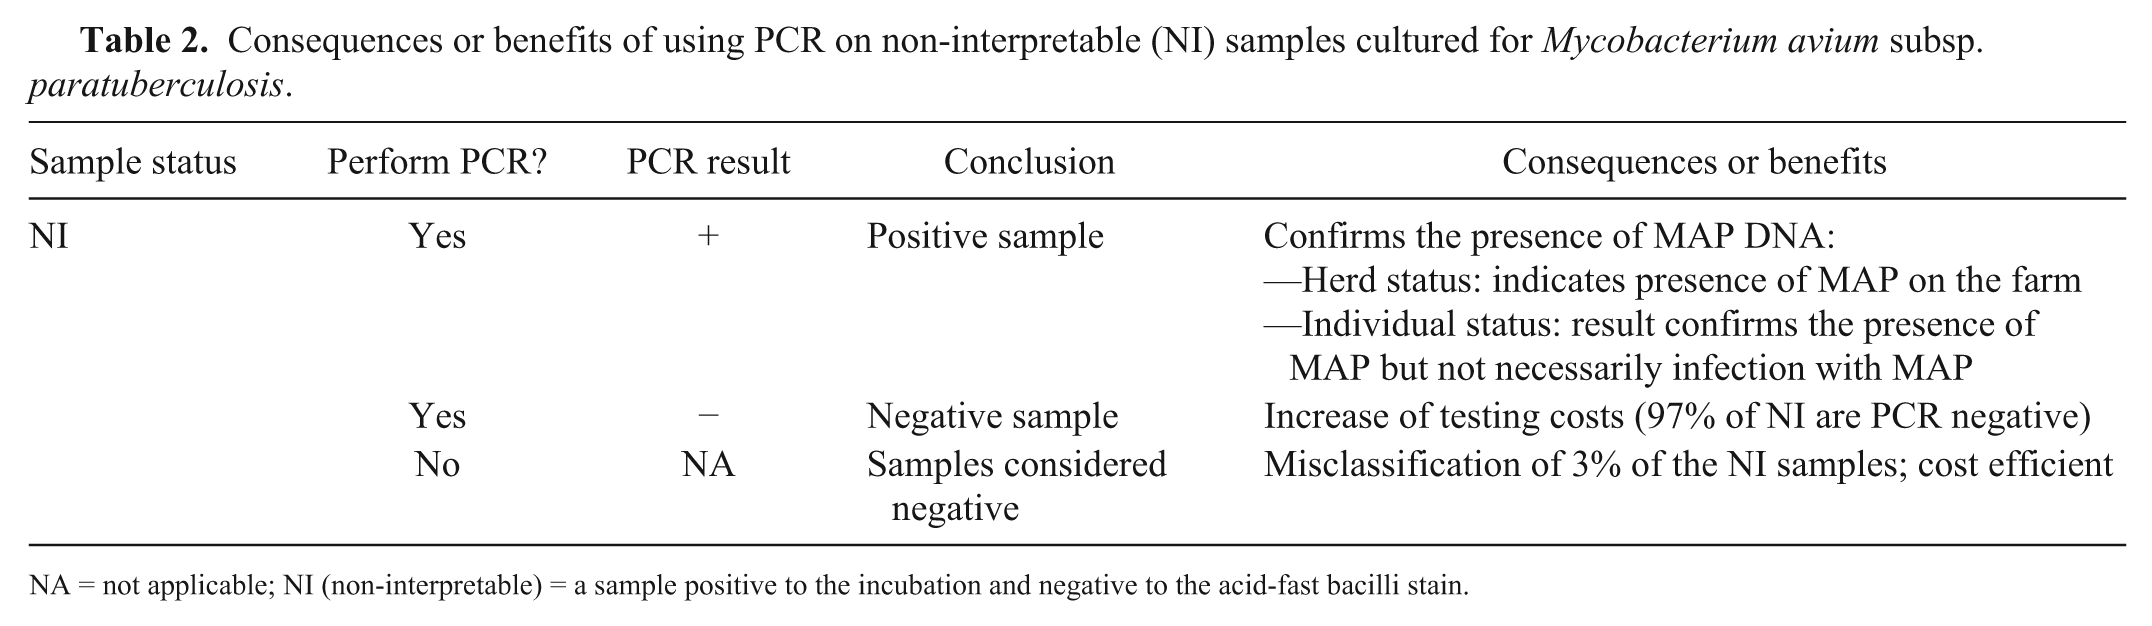
NA = not applicable; NI (non-interpretable) = a sample positive to the incubation and negative to the acid-fast bacilli stain.
In our study, the percentage of NI samples was highly variable among herds. Although the percentage was acceptable for several herds, in some herds the percentage was extremely high. We also observed that all of the positive PCR results were obtained from samples that originated from herds with a high percentage of NI samples. Running a PCR on NI samples can contribute to recovering positive samples that were missed by culture as a result of microbial overgrowth and can help identify an additional MAP-positive herd (e.g., herd M). Performing a PCR on herds with a high percentage of NI results for individual fecal samples (e.g., >20–30%) may be useful to gain confidence in individual and herd MAP status.
Footnotes
Declaration of conflicting interests
The authors declared no potential conflicts of interest with respect to the research, authorship, and/or publication of this article.
Funding
This study was funded by Pfizer-Zoetis and the “Programme de Soutien à l’Innovation en Agroalimentaire” of Ministry of Agriculture, Fisheries and Food of Québec.