
Abstract
Trichechid herpesvirus 1 (TrHV-1) is currently the only known herpesvirus in any sirenian. We hypothesized that stress may lead to recrudescence of TrHV-1 in manatees, thus making TrHV-1 a potential biomarker of stress. We optimized and validated a TrHV-1 real-time quantitative probe hybridization PCR (qPCR) assay that was used to quantify TrHV-1 in manatee peripheral blood mononuclear cells (PBMCs). Average baseline TrHV-1 loads in a clinically healthy wild Florida manatee (Trichechus manatus latirostris) population (n = 42) were 40.9 ± SD 21.2 copies/100 ng DNA; 19 of 42 manatees were positive. TrHV-1 loads were significantly different between the 2 field seasons (p < 0.025). This optimized and validated qPCR assay may be used as a tool for further research into TrHV-1 in Florida manatees.
Introduction
Species Trichechid herpesvirus 1 (TrHV-1; family Herpesviridae, subfamily Gammaherpesvirinae) was first identified in Florida manatees (Trichechus manatus latirostris) in 2007, 32 and is the only known herpesvirus in any sirenian. Herpesviruses are enveloped viruses with relatively large, double-stranded, linear DNA genomes of 120–240 kbp.15,23 Herpesviruses are also characteristically host specific, generally having evolved with their host species.13,20,21,23
In a healthy host, gammaherpesviruses often use white blood cells as a site of latency.2,3,33 Reactivation often occurs following cellular stress or when the cellular immune system is compromised.4,12,22,27,28 Manatee-specific viral infections have been minimally investigated. As with other herpesviruses, TrHV-1 may be present in healthy as well as clinically ill manatees, but in a latent state. 32 Although herpesviral loads may increase in immunosuppressed animals, the factors causing recrudescence, or reactivation, are often unknown. The recrudescence of herpesviruses has been well documented to occur during periods of stress in humans and other mammals.17,24,27,34 It is hypothesized that stress may also lead to recrudescence of TrHV-1 in manatees. Additionally, herpesviral recrudescence has been detected in experimental situations prior to detection of elevated cortisol, suggesting that increases in herpesvirus load may have use as an “early warning” biomarker of stress.7,9 Our objectives for this study were to optimize and validate a TrHV-1 real-time quantitative PCR (qPCR) assay and to then quantify TrHV-1 in manatee peripheral blood mononuclear cells (PBMCs), thus establishing baseline data of TrHV-1 loads in the clinically healthy wild Florida manatee population. With this data, further investigation of the use of TrHV-1 loads as a biomarker of immunosuppression will be possible.
Materials and methods
Study population
Whole blood samples were collected from 42 free-ranging Florida manatees during health assessments performed in a collaboration between the U.S. Geological Survey (USGS) Sirenia Project and the Florida Fish and Wildlife Conservation Commission following established protocols. 5 Florida manatees were sampled from Crystal River (n = 18), on the central west coast of Florida, and near Titusville, in Brevard County (n = 24) on the central east coast of Florida (hereafter, Crystal River and Brevard groups, respectively). Of the 42 Florida manatees sampled, 17 were females and 25 were males; 14 were subadults, with total lengths of 235–264 cm, and 28 were adults with total lengths >264 cm. 5 Samples were all collected during the winter months (December and January) of 2012–2013 and 2013–2014 field seasons. For the Brevard site, 12 manatees were collected during the 2012–2013 field season (December 14 and 15, 2012), and 12 were collected during the 2013–2014 season (December 3 and 4, 2013). All Crystal River manatee samples were collected over 2 separate health assessments in the 2013–2014 field season. Ten manatees were assessed on the first effort (December 3 and 4, 2013) and 8 during the second (January 31, 2014). All manatees from both sites and field seasons were evaluated to be in “excellent” or “good” condition, which indicates “healthy” free-ranging manatees. These descriptions are assigned to manatees with RAPTR (reflexes, activity, pulse, temperature, and respiration) scores of 9–10 upon release, a BCS (body condition score) of “normal,” absence of cold stress syndrome or recent injury (specifically healthy skin), and an evaluation by the clinician or biologist of good health and safe to release (Ferrante J. Characterization of cytokine levels and TrHV-1 load in the Florida manatee (Trichechus manatus latirostris) [dissertation]. Gainesville, FL: University of Florida; 2014). 5
Sample collection and processing
Whole blood was collected following established protocols. 6 Peripheral blood was drawn from the brachial vascular bundle of the manatee’s front flipper into lithium–heparin blood tubes (Vacutainer, BD, Franklin Lakes, NJ). The tubes were then centrifuged on site at 400 × g for 10 min, concentrating peripheral PBMCs in the buffy coat. Buffy coats were collected with sterile plastic pipettes into sterile, 2-mL cryovials and immediately frozen on dry ice. Samples were transported on dry ice to the Wildlife and Aquatic Animal Disease Laboratory at the University of Florida (Gainesville, Florida) and stored at −80°C until nucleotide extraction was performed.
To extract DNA, buffy coats were thawed on ice, then vortexed briefly. A 200-µL volume of the buffy coat was used for each extraction. DNA was extracted from all samples using a commercial kit (Maxwell 16, Promega, Madison, WI) according to the manufacturer’s protocols. DNA concentration was measured via spectrophotometry (QIAquick gel extraction kit, Qiagen, Valencia, CA), after which the extracts were aliquoted and stored at −80°C.
PCR assay
Nested (n)PCR amplification was performed on the DNA extracted from the manatee samples using previously described methods for the amplification of diverse herpesvirus species.30,32 Products were resolved on 1% agarose gels with an in-house positive herpesvirus DNA control. Bands 220 bp in size were considered putatively positive for amplification of the target. If present, bands were excised, and DNA was extracted using the QIAquick gel extraction kit (Qiagen) before being sent for Sanger sequencing.
Quantitative PCR assay
Target standards were produced using conventional PCR on a TrHV-1–positive sample, verified by sequencing. The target sequence was amplified by PCR using nested consensus primers for diverse herpesviruses. 30 The PCR product was resolved on 1% agarose gels, extracted, and confirmed as TrHV-1 polymerase by direct Sanger sequencing. The DNA concentration of the PCR product was measured via spectrophotometry (NanoDrop 8000, Thermo Fisher Scientific, Waltham, MA). A standard concentration of 2.5 million copies/µL was prepared in TE buffer (10 mm Tris, 1 mm EDTA) and aliquoted for single use with each run. Aliquots were stored at −80°C until the day of use. The qPCR standard curve, run on each plate, was made using 10-fold serial dilutions in TE buffer, ranging from 2.5 million copies/µL to 2.5 copies/µL from the original standard.
Primers were designed using Primer Express software v.3.0.1 (Life Technologies, Carlsbad, CA) based on the available TrHV-1 polymerase gene sequence (GenBank DQ238847.2), and targeting a 78-bp region inside the region of the gene used to produce the standard (forward primer, GCCATGCTGGAGAAGTCGAA; reverse primer, GAAGGGCTCGGGAACCA; and probe, [6FAM]CATCACCCCGGAGAGACTACGCGA[MGB]). Primer concentrations were optimized by testing 3 final concentrations (300, 600, and 900 nm) in a 3 × 3 matrix in triplicate. The probe concentration was optimized by testing 4 final concentrations (100, 150, 200, and 250 nm) in quadruplicate. Optimal concentrations were defined as those that yielded the lowest quantification cycle (Cq) and highest ΔRn (change in normalized reporter) at 45 cycles. Final primer concentrations of 600 nm and a probe concentration of 250 nm were subsequently chosen for the assays.
The qPCR reactions were run in a mix of 10 µL of 2× Taq buffer (TaqMan Fast universal PCR master mix, no AmpErase UNG, Life Technologies), 1 µL each of TrHV-1–specific primers and probe (12 µm forward and reverse primers [600 nm final concentration]; 5 µm probe [250 nm final concentration]), and 3 µL of nuclease-free water pre-combined, vortexed, and dispensed as 16-µL volumes into the wells of 96-well MicroAmp Fast optical reaction plates (Life Technologies). To each well, 4 µL of extracted DNA template, standards, or nuclease-free water no-template controls (NTCs) were added for a total reaction volume of 20 µL. Manatee sample volumes were diluted to allow for loading a DNA concentration as close as possible to 100 ng in a 4-µL volume. Each plate included serially diluted standards in triplicate, 3 NTCs, a positive control in triplicate, and unknown samples in triplicate with an additional 18S rRNA gene control to verify the presence of DNA in the sample. The 18S control was also prepared as 16-µL volumes comprised of 10 µL of 2× Taq buffer (Life Technologies), 1 µL of 18S rRNA (20×; Life Technologies), and 5 µL of nuclease-free water, to which 4 µL of sample DNA was added at concentrations of 50–100 ng of total DNA, as above. After the plate was prepared, MicroAmp optical adhesive film (PCR compatible, DNA/RNA/RNase free, Life Technologies) was used to seal the plate. The plate was then vortexed and centrifuged for 10 s using a MPS 1,000 mini plate spinner (Labnet, Edison, NJ). The qPCR analysis was performed using the 7500 Fast real-time PCR system (Life Technologies) with the manufacturer’s software (7500 software v.2.0.6, Life Technologies). Run conditions included performing a quantitation standard curve experiment using the fast ramp speed protocol, the ROX passive reference dye, and the run method: 95°C for 20 s holding stage, and 45 amplification cycles of 95°C melting temperature for 3 s and 61°C annealing temperature for 30 s.
Optimization and validation metrics
This assay was optimized and validated according to the minimum standards for the provision of information for qPCR experiments (MIQE). 11 Primer and probe concentrations were optimized as mentioned above. The analysis of the metrics was performed on 7 qPCR plate replicates in which the standards, a stock sample, and NTC replicates were assayed. Key metrics for the validation of this assay are as follows.
qPCR standard curve efficiency
A dilution series (1:10) of the TrHV-1 polymerase amplicon, beginning with 1 × 10⁷ copies/reaction and ending with 10 copies/reaction, were assayed in triplicate on each plate. The recommended target efficiency values were 85–110%, and the target coefficients of determination (R2) were values >0.98 for assessment of standard curve precision. 16
Linear dynamic range and limit of detection
The linear dynamic range was determined via a plot of the Cq values versus the standard concentration in a base 10 semi-logarithmic graph, produced by the qPCR software (7500 software, Life Technologies), which fit the data to a straight line. The lowest concentration standard that consistently yielded at least 66% of replicates with reproducible curves above the threshold was deemed to be the limit of detection (LOD).
Precision
To compare the reproducibility (inter-assay variation) and repeatability (intra-assay variation) of the assay, a positive control sample was produced by pooling DNA extracts from 7 of the manatee samples with the highest DNA concentrations. This sample was run in triplicate during each assay to compare variation within and between plates.
Analytical specificity
The analytical specificity (exclusivity) of the assay refers to the effectiveness of the assay to exclude amplification of other herpesviruses. The exclusivity of this assay was assessed by performing the qPCR assay on DNA samples containing the following non–TrHV-1 gammaherpesvirus species: Geoffroy’s marmoset lymphocryptovirus (2 samples from Geoffroy’s marmosets), ursid gammaherpesvirus 1 (2 samples from sun bears), elephantid herpesvirus 4 (2 samples from Asian elephants), mustelid herpesvirus 2 (from a southern sea otter), otarine herpesvirus 3 (from a California sea lion), phocid herpesvirus 2 (from a harbor seal), macropodid herpesvirus 3 (from an eastern gray kangaroo), and otariid herpesvirus 1 (from a California sea lion).
Baseline TrHV-1 loads in healthy Florida manatees
To establish baseline values of TrHV-1 loads in manatee buffy coat DNA, DNA concentrations of 50–100 ng/reaction were used for the assay. The qPCR results were normalized to TrHV-1 copies per 100 ng DNA. Sample values above the LOD were used to determine the average and standard deviation (SD) of qPCR-positive TrHV-1 copies/100 ng DNA. From these data, the prevalence of this virus can be calculated as the number of positive samples (with values exceeding the LOD) divided by the total sample size (n = 42). Statistical comparisons of the TrHV-1 values were made using the Mann–Whitney U nonparametric test (2-tailed), with Bonferroni corrections.
Results
Optimization and validation
The qPCR reaction standard curve efficiencies from 7 separate assays were 88.6–103.1% (mean = 97.0%), falling within the acceptable range of 85–110%. The regressions (R2) calculated from regression coefficients of those 7 plates were 0.989–0.998 (mean R2 = 0.995) and were all greater than the acceptable limit of 0.98. The linear dynamic range for this assay is 10–1 × 10⁷ copies/ reaction. Thus, the LOD is 10 copies/reaction. The NTCs were negative for amplification.
The pooled sample for precision testing was run in all 7 plates with at least 3 replicates per plate (n = 19 total). The samples from each plate were normalized to 100 copies/100 ng DNA, and average load value and SD were calculated. The mean normalized load for the pooled sample was 52.1 copies/100 ng, with an average SD of 29.7 copies/100 ng DNA and standard error of 8.2 copies/100 ng DNA. The SD of the averages from all 7 plates was 20.2 copies/100 ng DNA. These values were then used to calculate the reproducibility (inter-assay variability between plates) of 38.7 copies/100 ng DNA and repeatability (intra-assay variability in same plate) of 56.9 copies/100 ng DNA. The distribution of the pooled sample values included 12 of the 19 replicates within 1 SD of the mean, and all sample values were within ~1 order of magnitude of each other (11–115 copies/100 ng DNA). The exclusivity assay resulted in amplification of only the Florida manatee DNA samples, indicating that the assay itself was exclusive to the manatee herpesvirus and did not cross-react with other gammaherpesvirus-positive samples.
Baseline TrHV-1 loads in healthy Florida manatees
Normalized TrHV-1 copy numbers for the 42 samples ranged from below the LOD (<10 copies) to 74.2 copies/100 ng DNA. An average value of 40.9 copies/100 ng DNA (SD ± 21.2) was calculated based on the 19 samples with a value above the LOD. These 19 samples represented a range of 13.2–74.2 copies/100 ng DNA, with a median of 40.2 (Fig. 1). The prevalence of TrHV-1 in this group of healthy, free-ranging manatees is 45%, as 19 of 42 had copy numbers above the LOD.
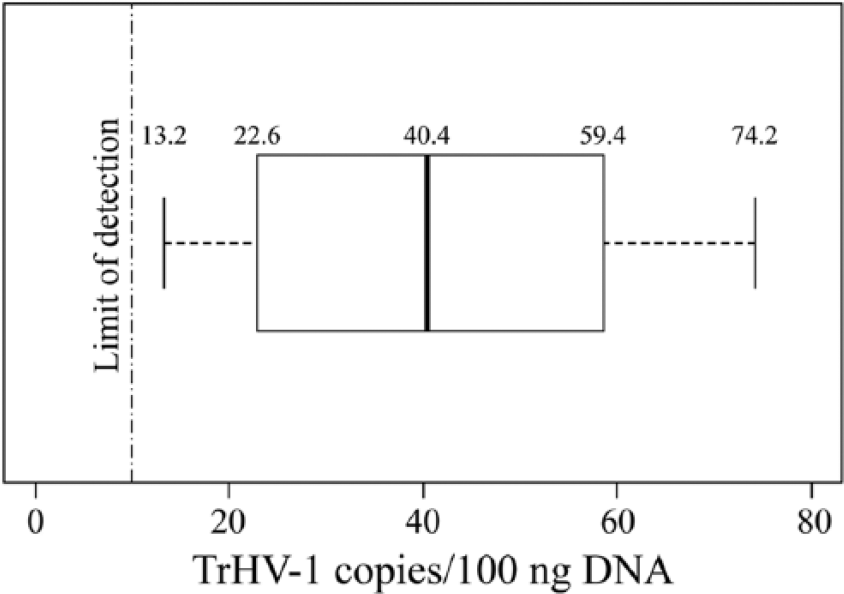
The axis represents the copies of trichechid herpesvirus 1 (TrHV-1) per 100 ng DNA. The boxplot represents values from the 19 (of 42) manatees that had TrHV-1 values above the LOD (10 copies/100 ng DNA). The median is 40.4 copies/100 ng DNA, the first and third quartiles are 22.6 and 59.4 copies/100 ng, respectively, and the minimum and maximum values are 13.2 and 74.2 copies/100 ng, respectively. The average TrHV-1 value is 40.9 copies/100 ng DNA, with SD of ± 21.2.
Further statistical analysis of the samples indicated changes in TrHV-1 loads between the 2 sampling efforts in Brevard and the 2 sampling efforts in Crystal River when compared using a Mann–Whitney U statistical analysis (2-tailed) with a Bonferroni correction for 2 planned comparisons (significance = p ≤ 0.05/2 or p ≤ 0.025). The Brevard site values in December 2012 were higher than in December 2013 (Mann–Whitney U = 3, n1 = 4, n2 = 7, p ≤ 0.02), and the December 2013 Crystal River manatee TrHV-1 values were lower on average than the TrHV-1 values from the manatees sampled in January 2014 (Mann–Whitney U = 3, n1 = 3, n2 = 5, p ≤ 0.02). In both comparisons, the sample sizes are very low, with the Brevard comparison between groups of 7 and 4 animals and the Crystal River comparison between groups of 5 and 3 animals. Viral load differences between sexes and age classes were considered, and additional statistical analysis was performed (t-test) to determine if a correlation existed in this group of manatees. No difference in viral load was observed between sexes (p = 0.71) or between age class (subadult vs. adult; p = 0.83).
Products of the nPCR were run on a gel and resulted in 34 of the 42 samples showing bands at 220 bp. Sequencing results for the excised bands identified TrHV-1 in 9 of the 34 samples; 19 were manatee genome and 6 did not result in legible sequence (Table 1). All 9 TrHV-1 DNA–positive samples were also positive in the qPCR assays (Table 1). Therefore, the diagnostic sensitivity of this assay is 100% when considering the nPCR to be the gold standard. There were 33 samples in the nPCR assay that either did not produce a band at 220 bp or sequencing did not report the bands as containing TrHV-1 DNA. The qPCR assay was in agreement with the absence of TrHV-1 in all 23 of its negative samples, but found 10 additional samples to be positive for TrHV-1. Thus, the diagnostic specificity is 76.7% using the nPCR as the gold standard.
Herpesvirus analysis results using VanDevanter PCR investigation for diverse herpesviruses and the TrHV-1–specific qPCR assay.*
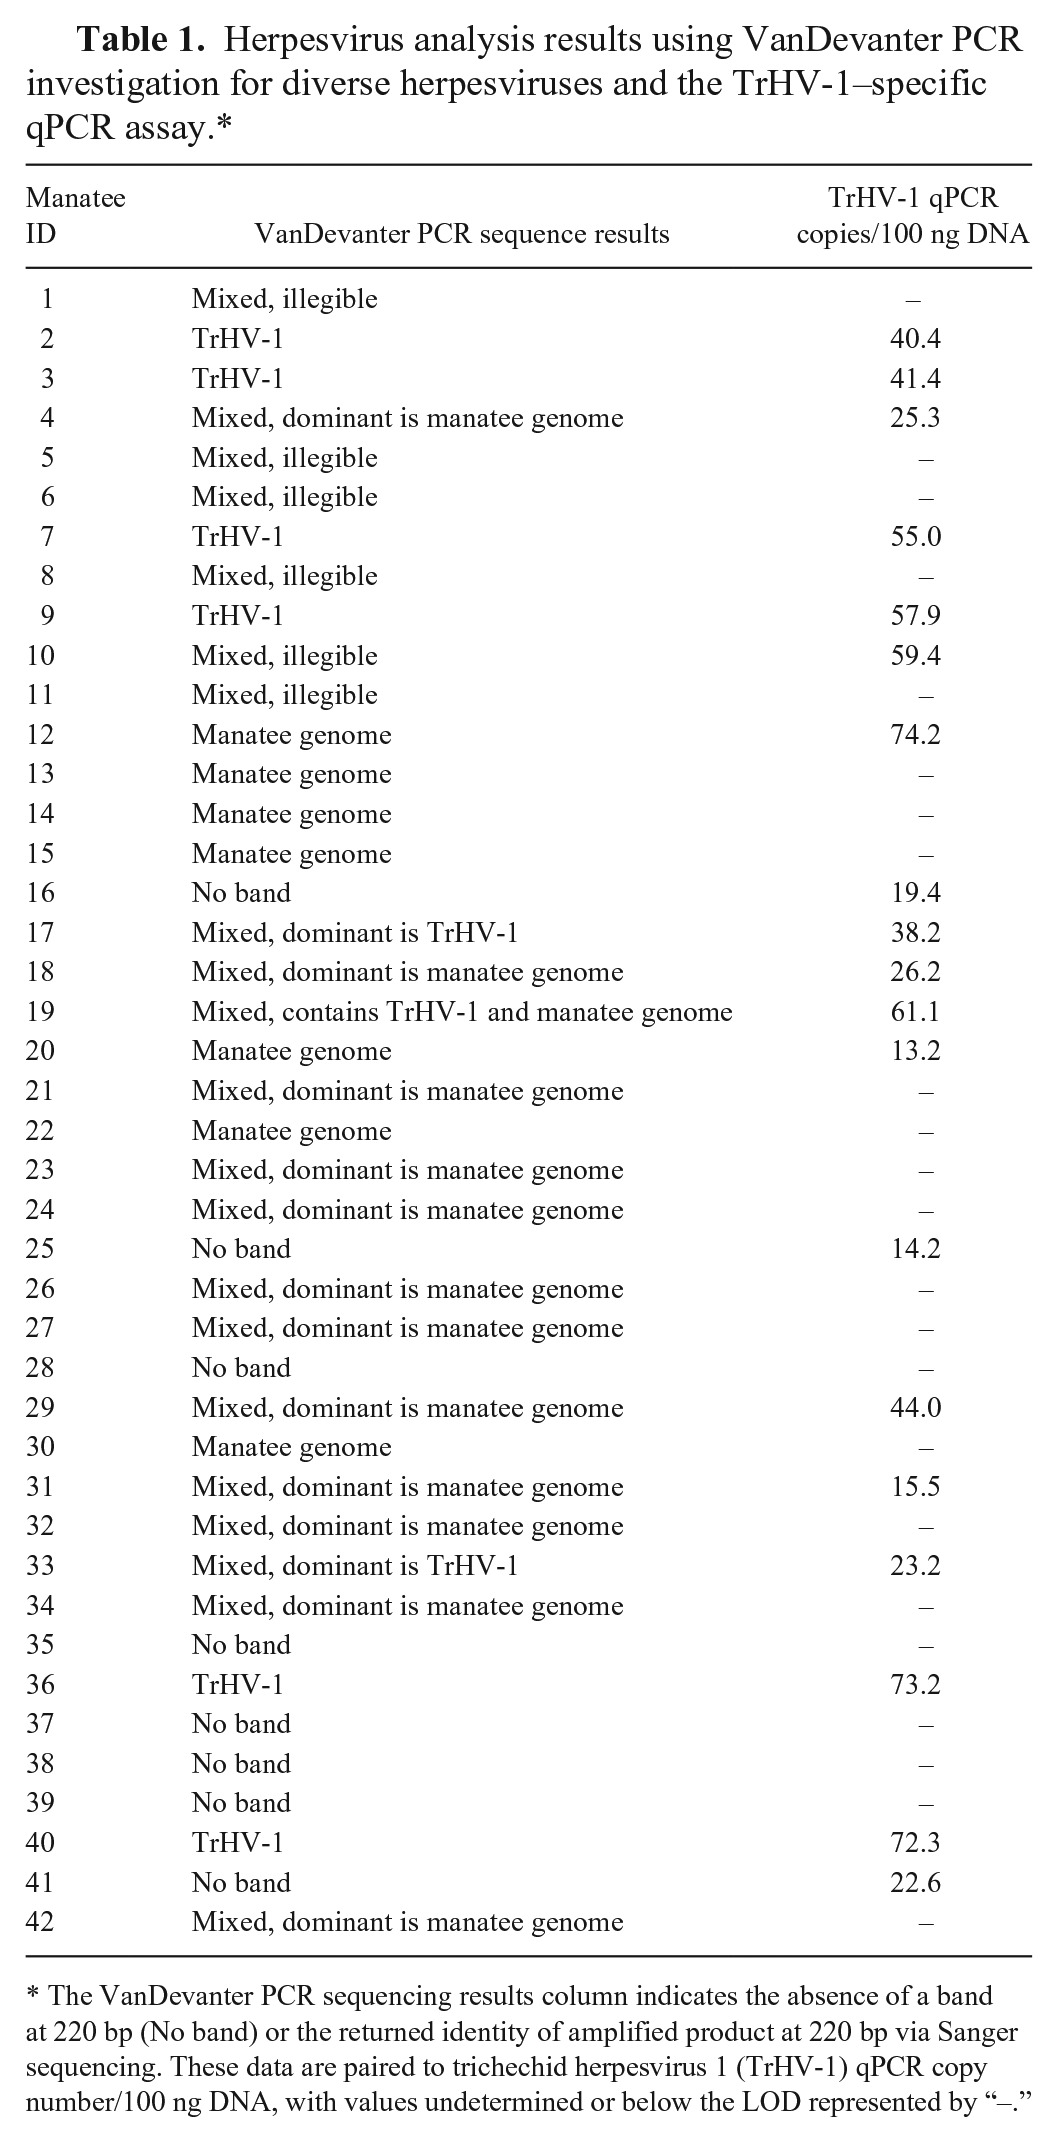
The VanDevanter PCR sequencing results column indicates the absence of a band at 220 bp (No band) or the returned identity of amplified product at 220 bp via Sanger sequencing. These data are paired to trichechid herpesvirus 1 (TrHV-1) qPCR copy number/100 ng DNA, with values undetermined or below the LOD represented by “–.”
Discussion
Our qPCR assay for TrHV-1 has been optimized and validated according to the MIQE guidelines for qPCR, and thus has relevance as a tool for future manatee research. 11 The assay has proven to be sensitive enough to detect viral DNA as low as 10 copies/100 ng DNA. The efficiency of the assay and the standard curves were well within the published acceptable ranges. There was some issue with the precision of this assay, with the inter- and intra-assay variability for the pooled sample being greater than desired (38.7 and 56.9 copies/100 ng, respectively). However, almost all of the replicate values are in the lowest order of magnitude of the standard curve (10–100 copies). Although the assay is sensitive to copy numbers <100, it may be less robust at reducing the effect of small variations in molecule numbers than is the case at higher concentrations. SDs did seem to improve with increasing concentration; the average SD of the Cq values was higher for the 10 copy standards (0.267) than the 1 million copy standards (0.035). As a result, the inter- and intra-assay variation may be reduced significantly if the samples were from manatees with higher viral loads. All manatees sampled with viral loads above the LOD had copy number values between the 2 lowest standards.
Test agreement between the traditional PCR assay and our newly optimized qPCR assay was comparable in that all nPCR samples that were positive for TrHV-1 through Sanger sequencing were also positive in the qPCR assay. In addition, 10 samples tested positive in the qPCR that did not have sequencing results, which indicated the presence of TrHV-1 in the nPCR assay. As the nPCR was considered the gold standard for detecting diverse herpesviruses, the statistical sensitivity of the new qPCR assay is 100% and the specificity is 76.7%. This assay also has a positive predictive value of 47.4% and a negative predictive value of 100% relative to the nPCR assay.
As the traditional nPCR assay was designed using degenerate primers for diverse herpesviruses, products that are not the target TrHV-1 may be amplified, which may have obscured sequence results from this assay, potentially causing false negatives. The primers and probe for the qPCR assay were designed using the actual TrHV-1 polymerase gene sequence, and there is an increased likelihood of improved binding and amplification of the target sequence. 10 To investigate the differential results of these assays, we performed a statistical analysis using the qPCR TrHV-1 values between the samples that were both PCR and qPCR positive and those that were only positive in the qPCR assay. The mean copy number for samples positive by both tests was 51.4, whereas the mean copy number of PCR negative/qPCR positive samples was 31.4. The 2 groups have unequal variances per a 2-tailed F-test (F = 0.54). A t-test comparing the groups using unequal variances results in a p value of 0.034, indicating they are significantly different. No samples were identified as TrHV-1 positive in the traditional PCR that paired with a qPCR value <23.2 copies/100 ng DNA, whereas 5 additional samples were positive in the qPCR assay below that value. It may be that the detection limit of the qPCR assay is lower than the traditional PCR assay.
These qPCR data provide preliminary baseline data for comparison to future studies investigating the effects of a disease or an environmental stressor in manatees from Crystal River or Brevard during winter health assessments. Such investigations may allow for a threshold TrHV-1 value or range to be defined and used for diagnosis of a disease state. Comparison of TrHV-1 qPCR data to cortisol levels in a temporal study of animals as they are exposed to an environmental stressor (i.e., throughout a winter season, over the course of a red-tide event, etc.) may provide insight as to the usefulness of TrHV-1 as a biomarker of stress response. It would be expected that increased exposure to stressors would result in relatively higher TrHV-1 loads in the manatee population. Seasonal variation in herpesviral loads has been observed in free-ranging wood mice, which show peaking levels of wood mouse herpesvirus in the spring and a decline over the summer, hypothesized to be related to reproductive class and rates of recapture. 18 Recrudescence during annual cycles may play a role in the persistence of viruses in populations. 29
Changes within sampling sites were observed between seasons (Brevard) and within seasons (Crystal River, 2013–2014 winter season). Most likely, this observation is an example of the variation that might be expected in a wild population, and it does not necessarily suggest a clinical issue. In fact, all of the animals sampled from both sites and dates were deemed of “excellent” or “good” health during their health assessments. Increasing the sample size surveyed is necessary to determine if the trends observed are an effect of low sample numbers or reflect a changing variable between sampling effort dates. However, it is interesting to note that the variation occurred between samples obtained from manatees at the Brevard site, but not the Crystal River site. The site used for health assessments in Crystal River is near a number of natural warm-water springs that keep a consistent water temperature throughout the year, making this a key location for manatee overwintering for the purpose of thermoregulation.19,25 The Brevard site waters are warmed by the effluent of a power plant, and thus are not consistently warm throughout the winter season. As such, environmental temperature fluctuations may have a greater effect on the water temperature in the area, and thus on the manatees. A dramatic drop in temperature was recorded in the area near the health assessment site the day before sampling occurred in 2012, with water temperatures dropping from ~22.5°C to 19.5°C (or 73°F to 67°F). Whether a day of reduced water temperatures is sufficient to affect an immunopathologic response in Florida manatees is not known. However, it is a metric that needs to be considered for future research.
The use of qPCR to investigate TrHV-1 in manatees has clear advantages over the use of traditional PCR. Quantitative PCR allows the investigator the ability to quantify the viral load and study disease associations relative to loads. Compared to conventional PCR, this assay is faster and less costly when testing multiple samples at a time.
Consistent with the understanding of many herpesviruses in other animals, TrHV-1 can be found in healthy, free-ranging Florida manatees that are not showing signs of disease.3,4,22,24,33 In the 2 studies that have investigated TrHV-1, the presence of the virus was observed in 45% (our study) and 47% of the total samples tested. 32 As of the time of this publication, the ecology, epidemiology, and potential clinical significance of TrHV-1 are not known. However, this assay may provide a tool for such studies of TrHV-1 infection in manatees as has been shown in non-manatee herpesviral epidemiologic research.1,8,14,26 A benefit that may allow an expansion of these studies of TrHV-1 is the stability of DNA over RNA, as well as potential protection by capsid, which makes this DNA virus more likely to be retrieved from recently deceased manatees, or perhaps even able to be isolated from degraded manatee carcasses. This type of postmortem sampling may help to determine if the manatee was immunosuppressed prior to its death, and perhaps whether the cause of mortality was human-induced or natural.
Our assay can also be used to look at the host cell range of TrHV-1. Our study focused on utilizing leukocytes, as TrHV-1 has previously been found in blood. TrHV-1 has also been detected in manatee skin. 32 In other mammalian species, gammaherpesviruses may be found in many tissues.2,7,8,31,32 A majority of these sites are only easily available from the manatee after death. However, by assessing the viral loads from these tissues, further understanding of the biology of TrHV-1 may be gained.
Footnotes
Acknowledgements
We thank the USGS Sirenia Project, the University of Florida Aquatic Animal Health Program, and the Lowry Park Zoo for help with sample collection. Samples were collected under IACUC and permits UF IACUC 201207704; MA791721-5; MA067116-1. We thank Drs. B Bonde, M Hunter, M Davis, M Walsh, M deWit, R Ball, A Barratclough, and the efforts of A Garrett, P Thompson, and R Dailey. JA Ferrante thanks Dr. M Ferrante, LK Ferrante, S Lockard, and Zucca for manuscript editing, review and suggestions.
Declaration of conflicting interests
The authors declared no potential conflicts of interest with respect to the research, authorship, and/or publication of this article.
Funding
The authors disclosed receipt of the following financial support for the research, authorship, and/or publication of this article: The authors received financial support for this research from an American Association of Zoo Veterinarians Zoological Medicine and Wildlife Health Research grant. Additional graduate funding was provided through the Florida Fish and Wildlife Conservation Commission, the UF Whitney Marine Laboratory for Marine Bioscience, and the UF Aquatic Animal Health program at the College of Veterinary Medicine.