
Abstract
We performed analytical validation of 3 automated assays of the total antioxidant capacity (TAC) in canine serum and evaluated their use in dogs with inflammatory bowel disease. The assays were based on the generation of a 2,2′-azino-bis(3-ethylbenzthiazoline-6-sulfonic acid) radical cation (ABTS•+) in aqueous media, which produces a blue-green color. The antioxidants present in the sample remove the chromogen in proportion to their concentrations. The assays differed mainly in the way in which this radical was produced. All 3 assays produced acceptable results in the analytical validation. However, only 2 of the assays were capable of detecting significantly different TAC values in healthy and diseased animals.
Introduction
Total antioxidant capacity (TAC) is the analytical method used most frequently to determine the antioxidant balance in biological samples. 11 Antioxidants are molecules that inhibit the action of oxidants, protecting cells from the oxidative damage caused by reactive oxygen species. A decrease of antioxidants may indicate overproduction of oxidants resulting in DNA, lipid, and protein injury, a situation known as oxidative stress.10,12 Oxidative stress plays an important role in the etiology or progression of a number of diseases.11,27
The 2 spectrophotometric assays used most widely to measure TAC in serum samples are based in the generation of 2,2′-azino-bis(3-ethylbenzthiazoline-6-sulfonic acid) (ABTS) radical cation (ABTS•+).9,24 Both assays measure the ability of a sample to reduce ABTS•+. However, they differ in the way ABTS•+ is generated. ABTS may be incubated with metmyoglobin and hydrogen peroxide (H2O2) to produce ABTS•+ (assay A) 24 ; or may be oxidized to ABTS•+ using H2O2 alone in acidic medium (assay B). 9 Both assays use 6-hydroxy-2,5,7,8-tetramethylchroman-2-carboxylic acid (Trolox a ), an α-tocopherol analogue, as standard material, and have been named Trolox equivalent antioxidant capacity assays. In addition, an assay using horseradish peroxidase (HRP) as an enzyme source to produce ABTS•+ more efficiently (assay C) has been described.4,5
In dogs, when assay A was used to measure TAC, no differences between healthy dogs and dogs with different diseases such as heart disease, 14 atopic dermatitis, 16 and babesiosis 8 were detected. However, the assay was capable of detecting lower TAC values in dogs with symptomatic leishmaniasis. 13 When assay B was used, lower TAC values were detected in dogs with eccentrocytosis 31 and visceral leishmaniasis, 1 after surgical procedures, 21,20 and after vaccination against canine monocytic ehrlichiosis. 29 In contrast, increased TAC values were observed in dogs with demodicosis 23 or parvoviral enteritis. 17 Assay C has been mainly used to measure TAC in plant material and foods2–6; however, some studies have used it to determine TAC in rat plasma 19 and boar seminal plasma (Hernandez M, et al. Antioxidant capacity of boar seminal plasma [abstract]. Reprod Fertil Devel 2004;17:283).
To our knowledge, no analytical validation with canine serum samples of any of the 3 assays described above has been published and, in addition, there is a lack of comparative studies of the behavior of these assays in individual diseases. For this reason, we performed analytical and clinical validation of the assays based on the generation of ABTS•+ utilizing metmyoglobin and H2O2 (assay A), H2O2 in acidic medium (assay B), and HRP and H2O2 (assay C) for determination of TAC in the serum of dogs. For analytical validation, we studied imprecision, inaccuracy, and detection limit. For clinical validation, the behavior of the 3 TAC assays was evaluated in inflammatory bowel disease (IBD), which is known to cause oxidative disturbances.
Material and methods
Reagent concentrations and reaction mode
In assay A, a commercial kit b was used. Reagent 1 contained 0.61 mmol/L of ABTS and 6.1 µmol/L of metmyoglobin in 80 mmol/L of phosphate buffer (pH 7.4). Reagent 2 contained 250 µmol/L of H2O2 in 80 mmol/L of phosphate buffer (pH 7.4). In assay B, the first reagent consisted of 40 mmol/L of acetate buffer (pH 5.8), and the second reagent contained 2 mmol/L of H2O2 a and 10 mmol/L of ABTS a in 30 mmol/L of acetate buffer solution (pH 3.6). In assay C, the reaction mixture contained 2 mmol/L of ABTS, 0.25 µmol/L of HRP, a and 40 µmol/L of H2O2 in 50 mmol/L of phosphate buffer (pH 7.5). The HRP concentration was determined by measuring the absorbance at 403 nm using ϵ403nm = 100 mM/cm.
Briefly, in assays A and B, the sample was added 18 s after reagent 1, and absorbance was measured at 600 nm. Reagent 2 was then added to the reaction, and a second reading was taken. In assay C, the reagent was added, and a first reading was taken at 700 nm. Eighteen seconds later the sample was added, and a second reading was taken. The difference between the first and second absorbance was used to calculate the antioxidant capacity of the sample in all assays. An automated biochemistry analyzer c was used to perform each assay.
A Trolox standard (2.29 mmol/L) provided with the commercial kit b was used to validate assay A. In order to calibrate assays B and C, Trolox a solution at 2.0 mmol/L was prepared and then serially diluted with ultrapure water in the range of 0.045–2.0 mmol/L. Ultrapure water was obtained using a purification system. d The assays results were expressed in millimoles of Trolox equivalents per liter.
Analytical validation of the assay
The analytical performance of the assays was assessed by calculating imprecision, inaccuracy, and detection limit according to protocols described previously.15,31 Inter- and intra-assay imprecision were expressed as the coefficient of variation (CV; mean divided by standard deviation [SD]) based on 5 replicate determinations of TAC in 3 canine serum pools (1 with high, 1 with medium, and 1 with low concentration) within the same analytical run (same day) and across analytical runs (different days), respectively. For the determination of interassay imprecision, the 3 serum pools were stored at −20°C in aliquots, and only vials needed for each analytical run were thawed.
Inaccuracy was determined through assessment of linearity and spike recovery. For linearity checks, 1 canine serum sample was serially diluted using ultrapure water and evaluated in duplicate. In order to establish spike recovery, 1 canine serum sample containing a high TAC concentration and 1 sample containing a low TAC concentration were selected and mixed at different percentages (87.5%, 75%, 50%, 25%, 12.5% of the sample with high TAC contractions with 12.5%, 25%, 50%, 75%, and 87.5% of the sample with low concentration, respectively). The ratios of the measured TAC values to the expected TAC values were calculated. The detection limit for each assay was calculated based on data from 20 replicate TAC determinations of ultrapure water as mean plus 3 SDs.
Effects of hemolysis and lipemia
Fresh hemolysate was prepared from canine red cells by lysing erythrocytes in ultrapure water. Amounts of saline solution, estimated by calculation, were added to the hemolysate, and the hemoglobin concentration was adjusted to 80, 40, 20, 10, 5, and 0.0 g/L. Ten microliters of each solution of hemoglobin was added to 90 µL samples of canine serum to produce test samples with final hemoglobin concentrations of 8, 4, 2, 1, 0.5, and 0.0 g/L. The 0.0 g/L concentration was reached by adding 10 µL of saline solution to 90 µL of the serum sample. 22 Prepared samples were used to determine the TAC concentration.
A commercial lipid emulsion e with triglyceride concentration of 200 g/L was serially diluted to 50, 25, 12.5, 6.25, 3.125, and 0.0 g/L using ultrapure water. Ten microliters of each dilution were added to 90 µL of the serum sample and were used to determine the TAC concentration. The final concentrations of triglycerides in the samples were 5, 2.5, 1.25, 0.625, 0.3125, and 0.0 g/L (10 µL of ultrapure water was added to 90 µL of the serum sample). 22
Samples
Twenty serum samples from dogs with IBD were included in our study. The dogs were of various breeds, 1–12 years of age; 12 males, 8 females. IBD was diagnosed based on clinical signs (diarrhea, vomiting, weight loss) of at least 3 weeks’ duration and detection of lymphoplasmacytic inflammation observed on histologic examination of duodenal biopsy samples.25,28
Control samples were from 8 clinically healthy dogs of different breeds, 2–8 years of age; 5 males, 3 females. Dogs were presented for routine checkups and physical examination; laboratory test results were normal.
Serum samples of the healthy and diseased dogs were stored in plastic vials at −20°C until analysis. The study was approved by the University of Murcia ethics committee.
Statistical analysis
Mean values, SD, and intra- and interassay CVs were calculated by routine descriptive statistical procedures and computer software.f,g The CV of each assay was calculated as the SD divided by the mean value of analyzed replicates × 100%. Linearity under dilution was investigated by linear regression. Interferograms were prepared to show the differences in TAC concentrations when hemoglobin or lipids were added. Kolmogorov–Smirnov test was performed to assess normality of data. Data showed a nonnormal distribution with assays A and C and a normal distribution with assay B. Mann–Whitney U test was used to compare TAC concentrations of assays A and C, whereas unpaired t-test was used to compare TAC concentrations of assay B. The 3 validated assays were compared using the Spearman correlation and Bland–Altman analyses using the values obtained in all samples of healthy and IBD dogs. A value of p < 0.05 was considered statistically significant in all cases.
Results
For assay A, intra-assay CVs were 3.2–6.8%, and interassay CVs were 3.7–9.8%. Serial dilution of a canine serum sample resulted in linear regression equations with an r2 value of 0.9764 (Fig. 1A). The results of spike recovery were 99–105%. The limit of detection was 0.0730 mmol/L (0.006 ± 0.022, mean ± SD).
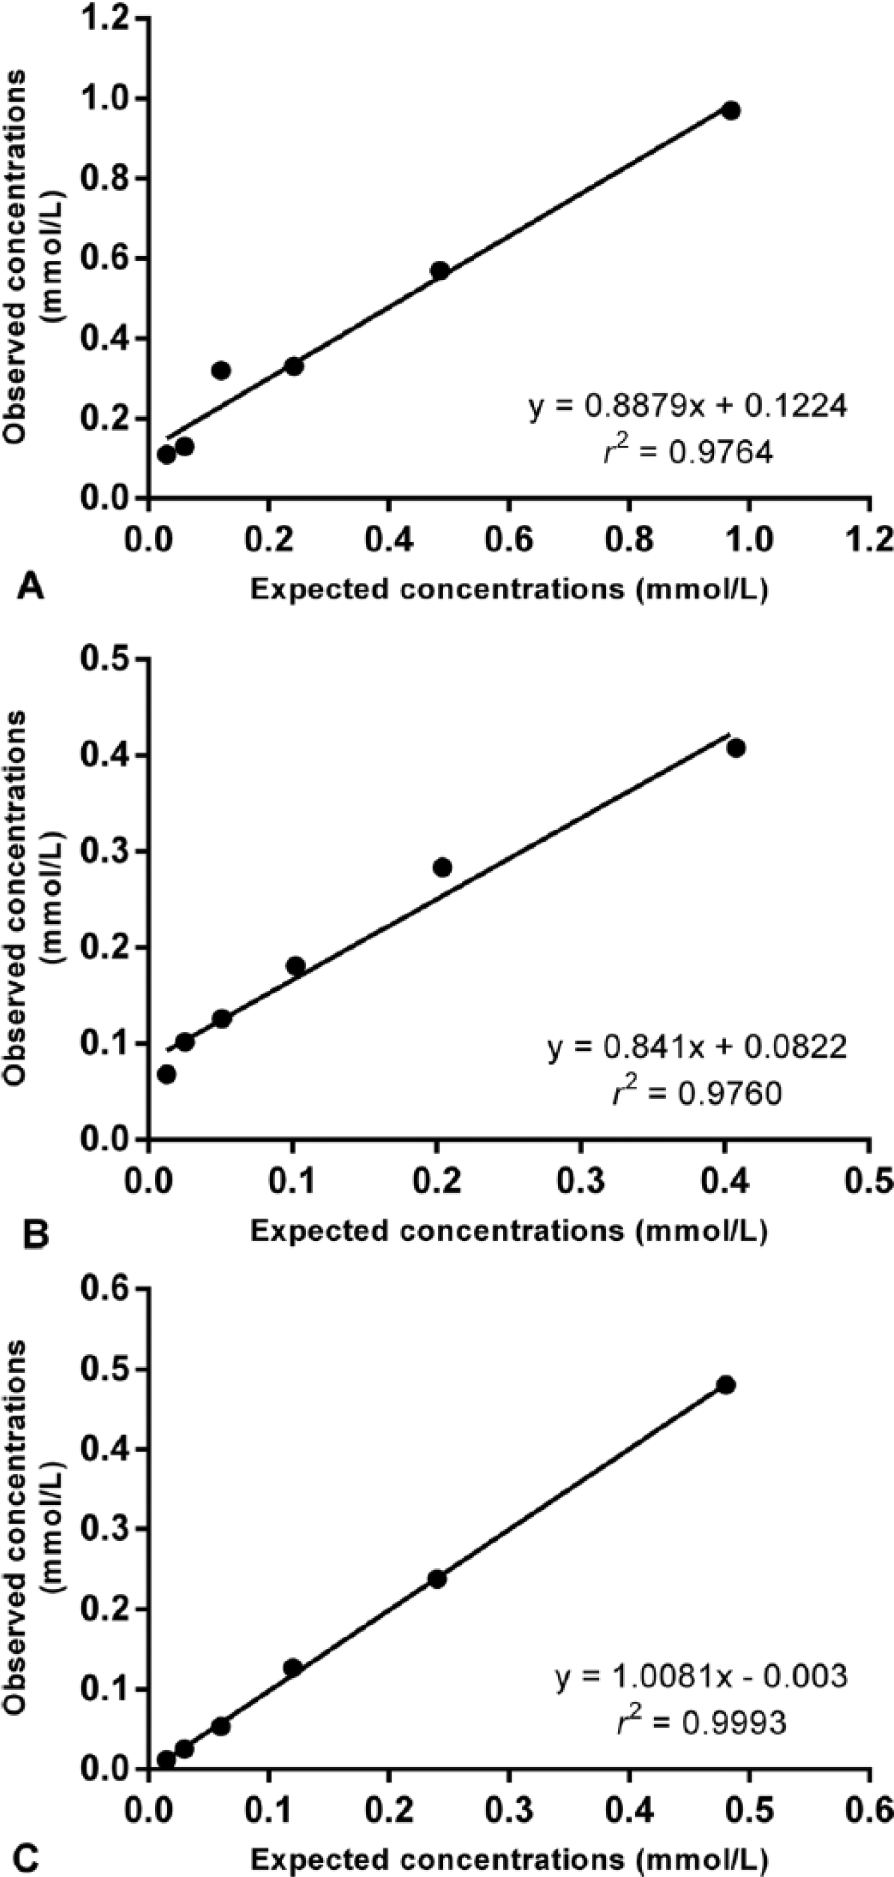
Regression lines showing the linearity of total antioxidant capacity (TAC) concentrations in 1 canine serum sample at various dilutions by 3 assays.
For assay B, intra-assay CVs were 2.8–3.9%, and interassay CVs were 4.2–11.4%. Serial dilution of a canine serum sample resulted in linear regression equations with an r2 value of 0.9760 (Fig. 1B). The results of spike recovery were 94–102%. The limit of detection was 0.0505 mmol/L (0.0243 ± 0.009).
For assay C, intra-assay CVs were 0.4–0.9%, and interassay CVs were 9.2–10.7%. Serial dilution of a canine serum sample resulted in linear regression equations with an r2 value of 0.9993 (Fig. 1C). The results of spike recovery were 97–106%. The limit of detection was 0.0906 mmol/L (0.0106 ± 0.027).
With hemoglobin concentrations of 4 g/L or higher, TAC values decreased in assay A and increased in assay C, whereas TAC values decreased in assay B even with low concentrations of hemoglobin (0.5 g/L; Fig. 2A). The addition of triglycerides to the sample caused a proportional decrease in TAC concentrations in assay C (Fig. 2B). Addition of triglycerides did not cause interferences in assays A or B (Fig. 2B). TAC values in dogs with IBD were significantly lower than those in healthy dogs when analyzed with assay A (Fig. 3A) and assay C (Fig. 3B); however, with assay B, there was no difference between the groups (Fig. 3C).
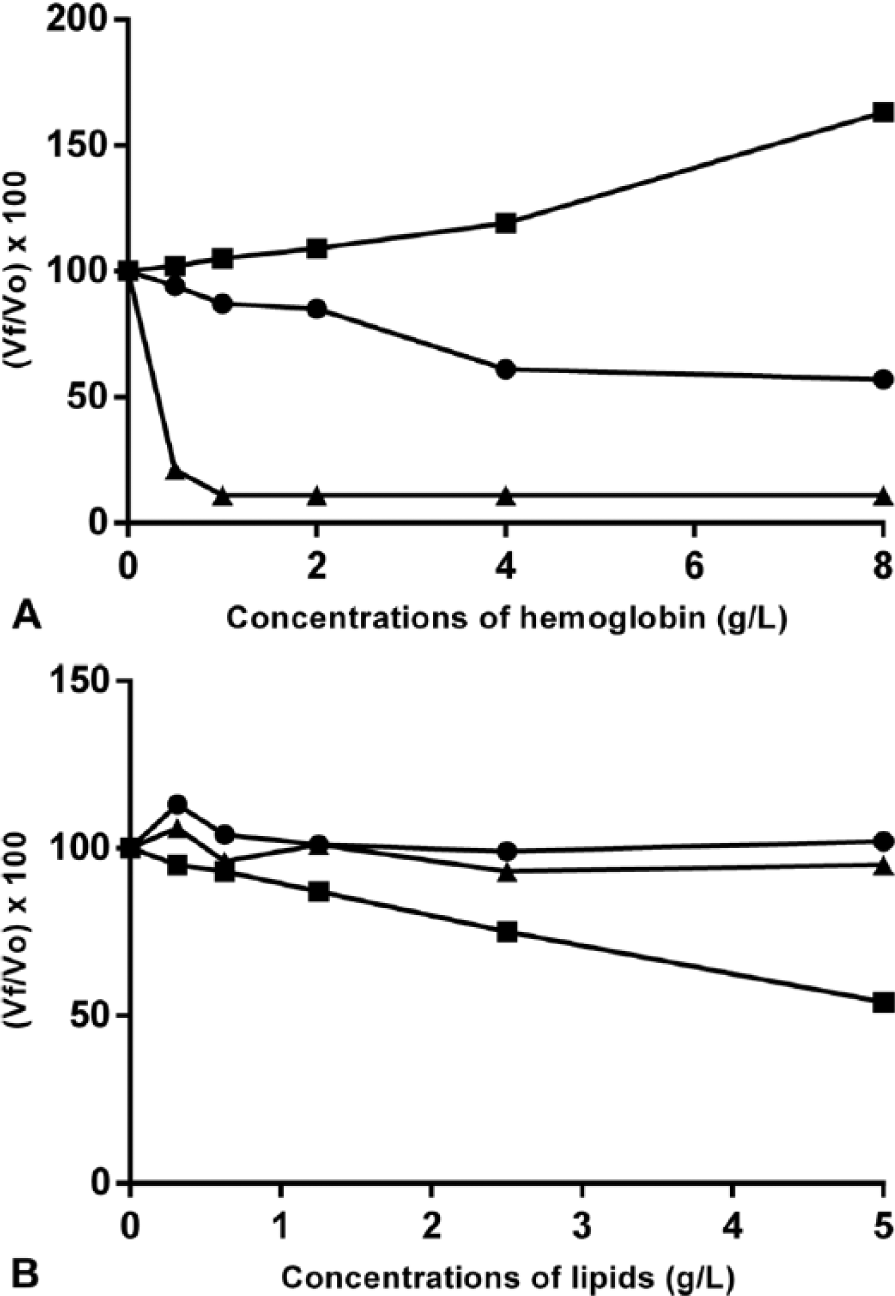
Interferograms showing the effect of hemolysis (
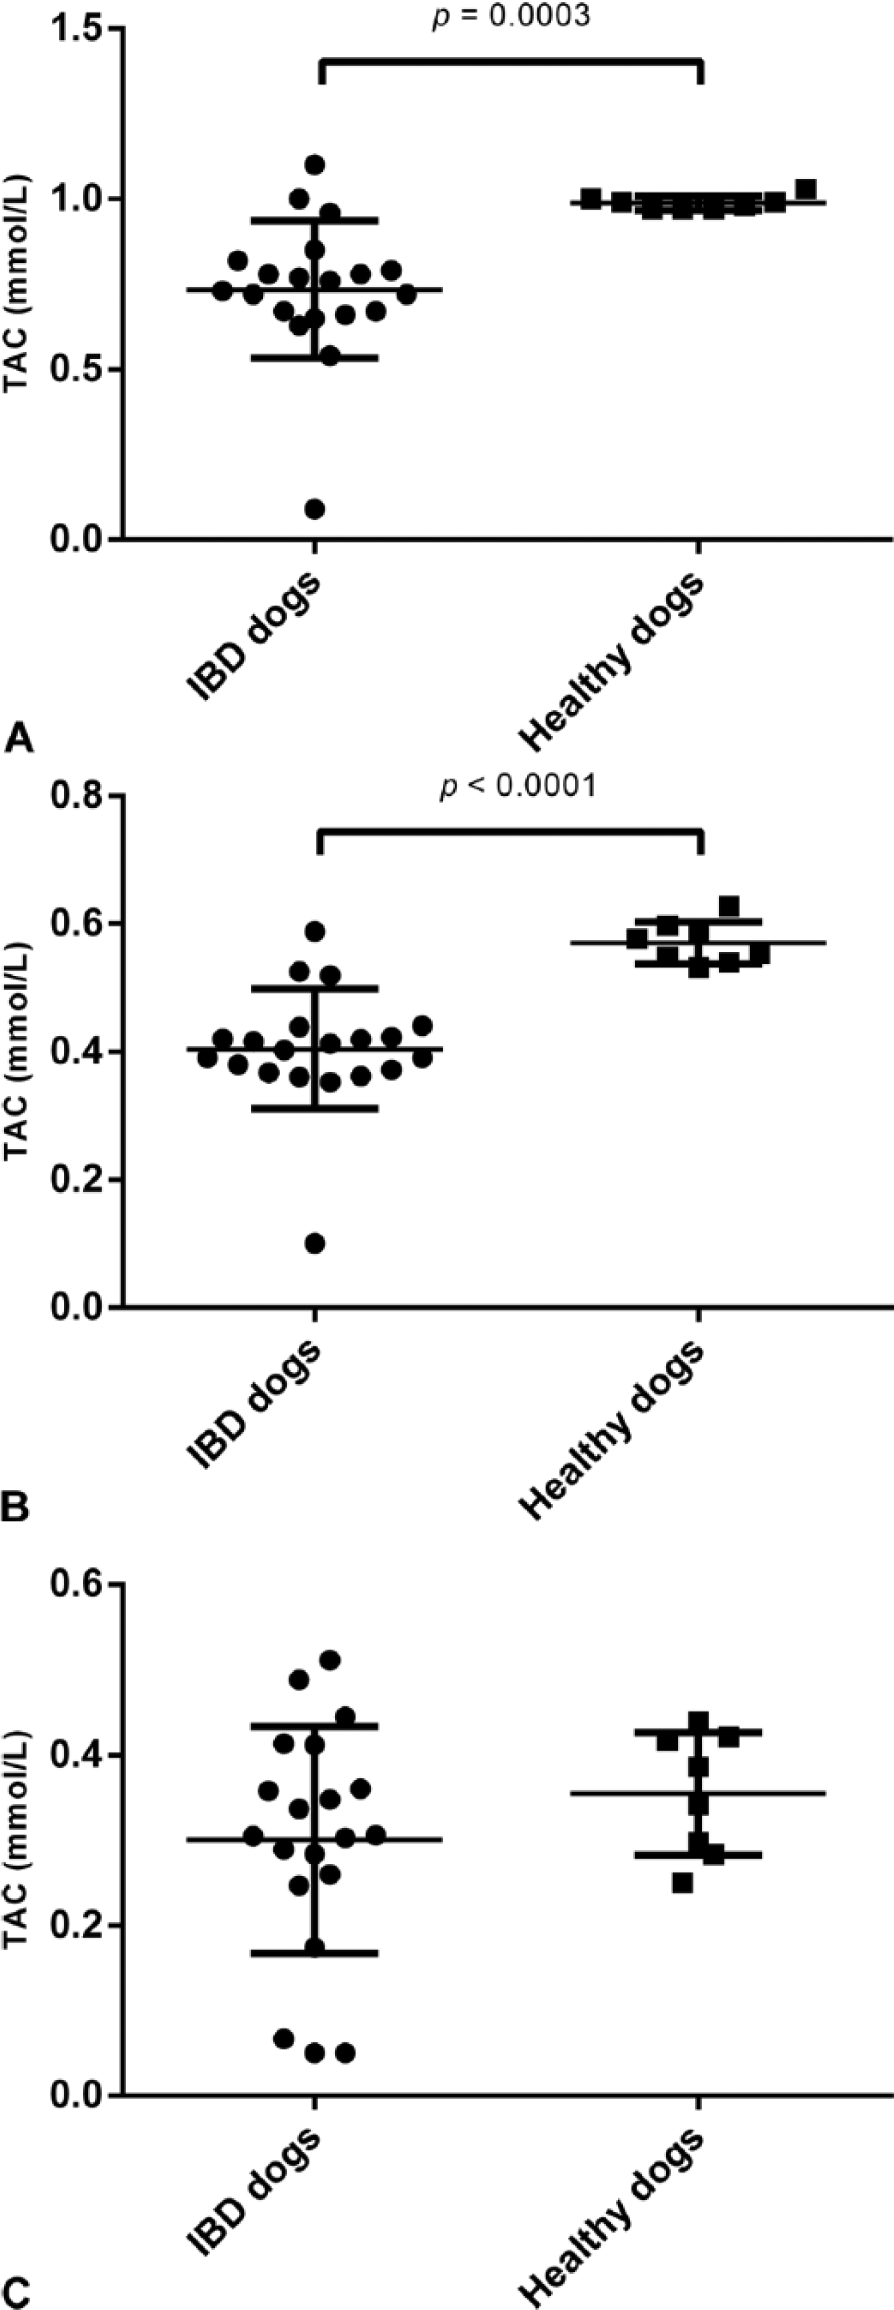
Values of total antioxidant capacity (TAC) in healthy dogs (n = 8) and in dogs with inflammatory bowel disease (IBD; n = 20) determined by the 3 assays evaluated: assay A (
Assays A and C were significantly correlated (r = 0.82, p < 0.001). Lower correlations were found between assays A and B (r = 0.66, p < 0.001) and between assays B and C (r = 0.47, p = 0.01). Bland–Altman analysis showed a random error between assays A and B (bias = 0.4909, SD = 0.1439; Fig. 4A) and between assays B and C (bias = 0.1360, SD = 0.1085; Fig. 4B). A proportional error was seen between assays A and C (bias = 0.3549, SD = 0.1107; Fig. 4C).
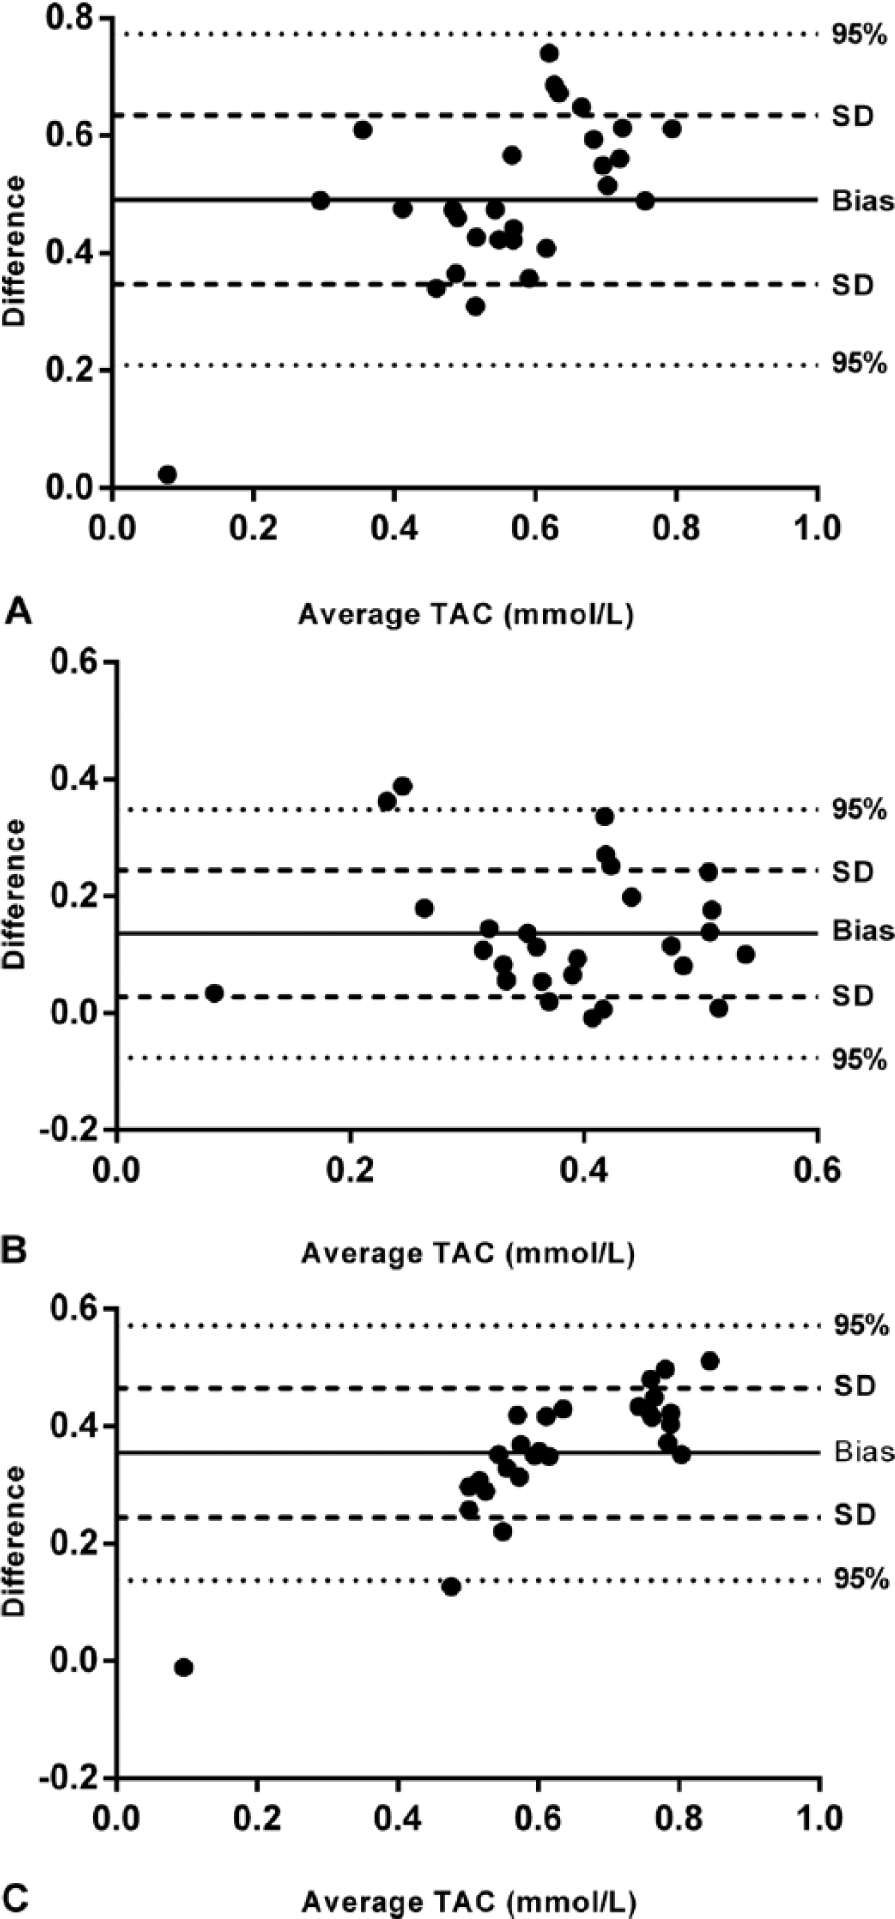
Comparison of methodologies for measurement of total antioxidant capacity (TAC) in serum of dogs by Bland–Altman plot.
Discussion
All the TAC assays investigated had imprecision values <15%, the limit considered as acceptable. 30 Values <15% have also been found by other authors using assays A 24 and B 9 in human serum. The 3 assays measured TAC in a linear manner, but serial dilution showed that assay C had a higher coefficient of determination. Spike recovery results of 94–106% were similar for the 3 assays. In all 3 assays, the limit of detection was low enough to quantify TAC in all samples studied.
Results of the 3 assays evaluated should be interpreted with caution when hemolyzed samples are used, given the interference noted with hemolysis, as noted by others. 24 The interference varied depending on the assay, producing increases in TAC in assay C and decreases in assay A and especially in assay B. Lipemia produced significant interference only in assay C, wherein decreased TAC values were observed.
IBD is a progressive gastrointestinal tract disorder of unknown cause (Jackson M, Jewell D. Metabolomic and clinical disturbances in canine inflammatory bowel disease [abstract]. FASEB J 2015;29(Suppl):265). In humans, uncontrolled overproduction of free radicals during active episodes of this disease has been suggested to cause a decrease in serum antioxidants, which may be responsible for a more harmful effect of inflammation in patients, resulting in cell and tissue damage. 26 In our study, decreased TAC values in dogs with IBD were observed when evaluated by assays A and C, but not by assay B. In humans, TAC was also diminished during IBD episodes, when evaluated by a crocin bleaching assay. 18 The reason why assays A and C, but not B, could detect differences in TAC between dogs with IBD and healthy dogs is unknown. The main difference among the 3 assays is that assays A and C use a physiologic pH medium (pH 7.4 and 7.5, respectively), whereas assay B uses an acidic medium (with pH 3.6 and 5.8 buffers). In addition, an enzyme source is used to generate ABTS•+ in assays A (metmyoglobin) and C (HRP), but not in assay B. The wavelength used in the assays probably does not influence the results obtained with assay B because the 600 nm wavelength of B is the same in assay A, whereas assay C is monitored at 700 nm. Hence, although changes in TAC occur in a disease such as IBD, the detection of these changes would depend on the assay used to measure TAC. A similar situation was described in dogs with heart disease 14 wherein higher TAC concentrations were found using the ferric-reducing ability of plasma (FRAP); however, the equivalent of assay A was not capable of detecting these differing TAC concentrations. In addition, others 7 found no correlation between, FRAP, and total antioxidant status (assay A) assays when determining TAC in human serum.
We would recommend assays A and C, which use a reaction medium at physiological pH and an enzyme source to generate ABTS•+ to measure TAC in the serum of dogs. However, further studies comparing assays in different diseases are warranted in order to confirm this recommendation.
Footnotes
Acknowledgements
We thank the National Council of Scientific and Technological Development (CNPq; Brazil) for the PhD scholarship of CP Rubio.
Authors’ contributions
CP Rubio and JJ Ceron contributed to conception and design of the study; contributed to acquisition, analysis, and interpretation of data; and drafted the manuscript. J Hernández-Ruiz contributed to conception of the study; contributed to analysis and interpretation of data; and gave final approval. S Martinez-Subiela and A Tvarijonaviciute contributed to conception and design of the study; contributed to interpretation of data; critically revised the manuscript; and gave final approval. MB Arnao critically revised the manuscript and gave final approval. All authors agreed to be accountable for all aspects of the work in ensuring that questions relating to the accuracy or integrity of any part of the work are appropriately investigated and resolved.
a.
Sigma-Aldrich Quimica S.A., Madrid, Spain.
b.
Total antioxidant status (TAS) kit, Randox Laboratories Ltd., Crumlin, UK.
c.
Olympus AU400 automatic chemistry analyser, Olympus Europe GmbH, Hamburg, Germany.
d.
Synergy water purification system, Darmstadt, Germany.
e.
Lipofundina 20%, Braun Medical S.A., Barcelona, Spain.
f.
Excel 2013, Microsoft Corp., Redmond, WA.
g.
Prism (version 5 for Windows), Graph Pad Software Inc., San Diego, CA.
Declaration of conflicting interests
The author(s) declared no potential conflicts of interest with respect to the research, authorship, and/or publication of this article.
Funding
The author(s) disclosed receipt of the following financial support for the research, authorship, and/or publication of this article: The Ministerio de Economia y Competitividad of Spain funded AT through a postdoctoral grant (Juan de la Cierva). This study was also funded by the Seneca Foundation of Murcia Region (19894/GERM/15).