
Abstract
In humans, homocysteine (Hcy) is employed to monitor renal, cardiovascular, and other diseases and their complications. The aim of the current study was to define the analytical performances of an enzymatic method not yet validated in dogs for measuring homocysteine, and to assess the possible clinical usefulness of Hcy measurement. Using conventional approaches, the analytical performances were investigated by assessing, imprecision, inaccuracy, and interference of hemoglobin, triglycerides, and bilirubin. The possible clinical usefulness of Hcy determination was assessed by comparing the results of healthy dogs (n = 8) with those of dogs with heart disease (n = 10), inflammation (n = 6), gastrointestinal disorders (n = 7), neoplasia (n = 8), renal failure (n = 4), trauma (n = 7), and other miscellaneous diseases (n = 6). Preliminary evaluation of this enzymatic method showed it to be precise at Hcy levels close to or higher than the values in dogs with renal or cardiac disorders that had the highest Hcy levels. By contrast, at low Hcy levels, which were recorded basically in control dogs, the method suffers from high imprecision. The sample of choice is serum. The use of icteric samples should be avoided, while hemoglobin and lipids have only a minor effect on Hcy measurement. In conclusion, the enzymatic method employed in the current study provides useful information in dogs and could be used to monitor cardiac and renal disorders, in which Hcy concentrations are elevated.
Homocysteine (Hcy) is a sulfur-containing intermediate product of methionine metabolism and is further metabolized by vitamin B12-or B6-dependent pathways. 17 In humans, hyperhomocysteinemia (HHcy) is a sensitive marker of folate and B-vitamin deficiency and is considered an independent risk factor for cardiovascular disease (CVD) and thrombotic-, neurodegenerative-, and Δ-pregnancy-associated diseases. 13,17 Specifically, HHcy is associated with an increased incidence of congestive heart failure (CHF), as well as with the severity of the disease. In high-risk populations, increased Hcy is a prognostic marker for an increased risk of new CVD events or mortality. 7 High plasma concentrations of Hcy and low levels of B vitamins are risk factors for coronary and cerebral atherosclerosis and peripheral vascular disease. 4 Moreover, HHcy has been shown to be an independent risk factor for cardiovascular disease in renal patients 5,12,16 ; plasmatic levels of Hcy are inversely correlated with the glomerular filtration rate (GFR) 5 and positively correlated with serum creatinine. 16 Further, an increased risk of mortality was found in patients with HHcy and diabetes. 18
In the veterinary literature, publications on the possible usefulness of Hcy as a risk factor or as a prognostic or diagnostic biomarker are rare. Studies in cats with heart diseases or arterial thromboembolism (ATE) provided controversial results (Hohenhaus AE, Simantov R, Fox PR, et al.: 1999, Evaluation of plasma homocysteine and B vitamin concentrations in cardiomyopathic cats with congestive heart failure and arterial thromboembolism. In: Proceedings of the Nestle Purina Nutrition Forum, p. 170. St. Louis, MO), 11 and studies on the relationship between Hcy concentration in cats and hypocobalaminemia or cobalamin therapy suggested that serum Hcy concentration does not depend upon cobalamin availability. 14,15 The only study for dogs 2 demonstrated that Hcy levels were not affected by the short-term administration of a peripheral parenteral nutrition product. All the studies published in veterinary medicine employed high-performance liquid chromatography (HPLC), which is accurate but unpractical, expensive, and requires long run-times and specialized personnel. The aims of the current study were to investigate the analytical performances of an enzymatic colorimetric method for measurement of Hcy on canine samples that had previously been validated with human samples 3 and to assess Hcy levels in healthy dogs and in dogs affected by different pathologic conditions to determine the possible clinical usefulness of this parameter.
Fifty-six canine blood samples were obtained, under informed consent, from client-owned dogs referred to the authors' respective institutions for various diagnostic or therapeutic measures. The samples were put in plastic tubes containing clot activator and separation gel. a Sera were obtained by centrifugation (1500 x g for 7 min) within 30 min, and subsequently stored in plastic tubes at −20°C until analysis, for no longer than 1 month. To assess the possible influence of anticoagulants in 8 cases, aliquots of blood were also put into ethylenediamine tetra-acetic acid (EDTA) plastic tubes b and lithium-heparin plastic tubes b filled to their maximum capacity. Sera or plasma samples from the dogs were collected within 30 min by centrifugation at 1500 x g for 15 min and immediately analyzed.
Based on clinical examination, hematology, clinical biochemistry, and additional diagnostic tests, such as radiography and ultrasonography, dogs were classified in the following groups:
Control: 8 dogs (3 males, 5 females; age range: 1–6 years; median age: 2.5 years) sampled during routine wellness visits or before spaying/neutering. When sampled, these dogs did not show any clinical or laboratory abnormalities, especially regarding heart and kidney functions.
Heart disease: 10 dogs (6 males, 4 females; age range: 1–14 years; median age: 8 years). This group included dogs with dilated cardiomyopathy, mitral insufficiency, pulmonic stenosis, congenital arrhythmia, and patent ductus arteriosus.
Inflammation: 6 dogs (1 male, 5 females; age range: 3–11 years; median age: 5.5 years) with pyometra (n = 2), eosinophilic pneumonia, ehrlichiosis, leishmaniasis, or pyoderma.
Gastrointestinal disorders: 7 dogs (3 males, 4 females; age range: 3–12 years; median age: 8 years) with pyloric stenosis (n = 3), intestinal obstruction (n = 3), or gastric ulceration (n = 1).
Neoplasia: 8 dogs (4 males, 4 females; age range: 7–12 years; median age: 10 years). Neoplasms diagnosed in these dogs included histiocytoma, pulmonary carcinoma, lipoma, mammary carcinoma, ovarian carcinoma, and synoviosarcoma. Insulinoma was suspected in 1 case. In another case, a splenic mass was identified but not further investigated by cytology or histology.
Kidney disease: 4 dogs (1 male, 3 females; age range: 10–17 years; median age: 11 years). All dogs in this group had increased creatinine and urea with additional biochemical changes consistent with renal azotemia caused by chronic renal failure (n = 3) or acute renal failure (n = 1).
Trauma: 7 dogs (1 male, 6 female; age range: 1–10 years; median age: 3 years) that experienced traumatic events, including fractures or joint injuries.
Miscellaneous diseases: 6 dogs (3 males, 3 females; age range: 1–11 years; median age: 6.8 years). This group included dogs with gastric torsion, postsurgical hemorrhage, chronic diaphragmatic hernia, and neurological signs of undetermined origin (n = 2).
Homocysteine was measured with an automated spectrophotometer c using a commercially available kit based on an enzymatic cycling reaction that detects Hcy in human serum or plasma. d , 3 At the beginning of each batch of tests, the instrument was calibrated using the human-based calibrator provided by the manufacturer of the kit, d and human-based control solutions d (low control = 7.0 ± 1.1 μmol/l; high control = 29.0 ± 4.4 μmol/l) were employed to assess the efficiency of the calibration.
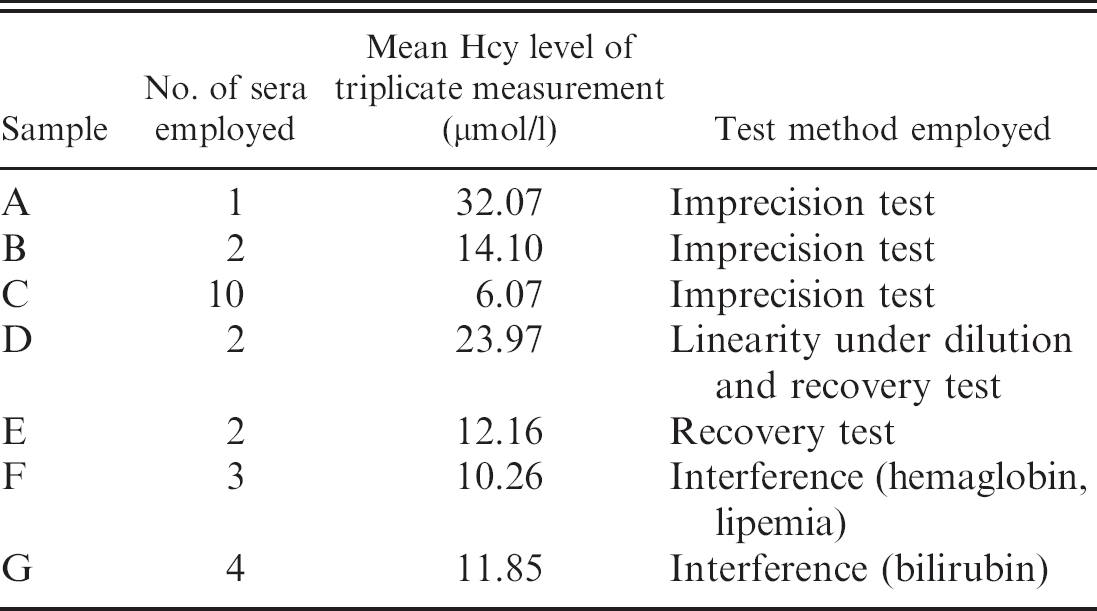
Reference material used to validate the enzymatic method for measuring homocysteine (Hcy) in dogs.
After thawing, Hcy concentration was determined for all serum samples by measuring each sample in triplicate. The mean value, the standard deviation (SD), and the coefficient of variation (CV = SD/mean x 100) were calculated using an Excel e spreadsheet with Analyse-it software. f The same software was used to perform all the statistical analyses.
Samples were then used to prepare the reference material listed in Table 1. Except for the “high Hcy level” sample (sample A), which was prepared by aliquoting the sample with the highest Hcy concentration, all the reference samples were obtained by pooling sera with medium-to-high (pools B and D) or medium-to-low (pools C, E, and F) concentrations of Hcy. Aliquots of each pool were assayed immediately or, as regards interassay variability, stored frozen at −20°C. The analytical characteristics of the tests on canine samples were assessed by a basic panel of validation procedures suggested in the published literature 19 and previously employed in similar studies. 8 Although less complete than other validation approaches (based on additional tests and on higher numbers of replicates), this basic panel was considered adequate to provide preliminary information on analytical aspects and on the possible clinical usefulness of Hcy concentration in the blood. 9,19
The intra-assay variability was determined by measuring the Hcy concentration of sample A, and of pools B and C, 20 consecutive times in a single run. The CVs, calculated as reported above, were 11.7%, 9.0%, and 4.1%, respectively. The interassay variability was assessed by analyzing samples A, B, and C in triplicate on 5 successive days. The CVs, calculated by measuring the pooled variance estimate, 8 were 10.6%, 7.0%, and 2.8%, respectively. The lower limit of detection (LLOD) was calculated from 10 replicate measurements of saline solution (0.9% NaCl), which always provided undetectable results. The results suggest that the analytical method is precise and has a very low LLOD, but the results of the interassay imprecision test were probably biased by the low number of runs. This bias was confirmed by data from individual dogs; the majority (15/18) of samples with less than 5.0 μmol/l had CVs >20%, whereas only 2 of the remaining 38 samples, which had >5.0 μmol/l, had CVs higher than 20% (considered the maximum allowable imprecision for many biochemical tests). 19
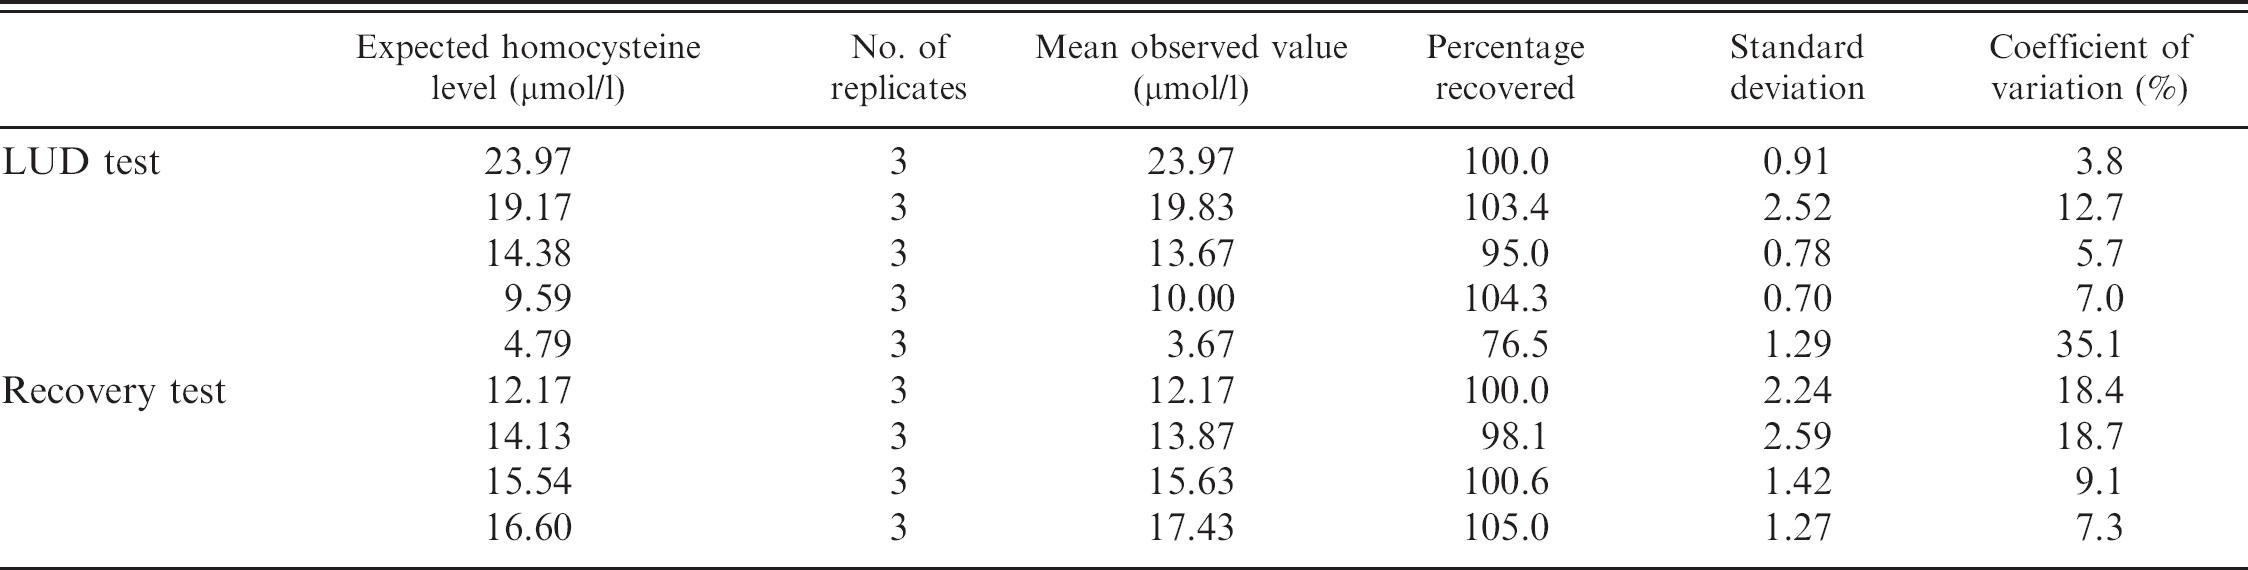
Although the lower limit of quantification (the lowest amount of the analyte that can be determined with suitable precision and accuracy) has not been statistically assessed in the current study, the poor precision at low Hcy levels was confirmed by the results of the linearity under dilution (LUD) test and the recovery tests. Although these 2 tests cannot replace conventional approaches to evaluate the inaccuracy of tests (e.g., method comparison and proficiency testing, which are not available for the Hcy method employed in this study), 9 in many papers, 8,10 LUD and recovery tests are used as indirect methods to “estimate” inaccuracy and to provide information about reportable ranges and proportional systematic errors, respectively. 9,19 The LUD test was performed by diluting pool D with saline solution to obtain samples containing 80%, 60%, 40%, and 20% of the analyte. The recovery test was performed by adding 3 aliquots (100 μl each) of pool E to 3 different volumes (25, 50, and 75 μl) of pool D. All the samples, including undiluted pools D and E, were analyzed in triplicate. The percentage of recovery compared with expected values (Table 2) was close to 100% for both the tests except for the sample corresponding to 20% dilution. Least square linear regression (Fig. 1) demonstrated an excellent degree of correlation for both LUD (R 2 = 0.99; P = 0.000) and recovery (R 2 = 0.98; P = 0.011) tests. In both cases, data fit the linear model. The results demonstrate that the analytical method was linear in the range of values examined and that no proportional systematic errors were present.
The effect of hemolysis and hyperlipemia was assessed using previously published protocols. 10 Aliquots of pooled sera were added with different concentrations of hemoglobin (Hb) g or commercial fat emulsion (Trig) h to pool F, or of bilirubin (Bil) i to pool G, followed by triplicate measurement of Hcy. The following levels of hemolysis, lipemia, and icterus were simulated: slight (Hb < 1.25 g/l; Trig <2.1 g/l; Bil = 0.0275 g/l), moderate (Hb = 2.5 g/l; Trigl = 3.6 g/l; Bil = 0.045 g/l), severe (Hb = 5.0 g/l; Trigl = 6.1 g/l; Bil = 0.08 g/l), and extreme (Hb = 7.5 g/l; Trigl = 8.6 g/l; Bil = 0.15 g/l). The final concentrations of Hb were verified by an hematology analyzer, j those of Trig by the enzymatic colorimetric glycerol-3-phosphate-oxidase-peroxidase (GPO-POD) method, k and those of Bil by the modified Jendrassik-Grof method. j The percentage changes of Hcy concentration compared with the basal sample (serum + distilled water), on which the concentrations of Hb, Trig, and Bil were 0 g/l, 1.1 g/l, and 0.01 g/l, respectively, were calculated and plotted versus the concentration of interfering substances to create the interferograms (Fig. 2). 10 Moreover, results obtained from serum with and without the different concentrations of interfering substances were compared using the Friedman test. The mean values observed in the presence of Hb and Trig fluctuated around the 100% value of the basal sample, without statistically significant differences. This suggests that Hb and Trig had only a limited effect on Hcy measurement, although in samples simulating severe or extreme hemolysis and lipemia the imprecision of the test increased, thus masking the possible statistical significance of the differences recorded in mean values. Regardless, these fluctuations were generally within a 10% variation from the expected value, as also occurs with human samples. 3 In contrast, Bil induced a significant increase of Hcy (P < 0.001) at a concentration corresponding to moderate icterus (0.045 g/liter). Although this could be a statistical artifact due to the low number of replicates, the deviation from the expected value was very high (32%), contrary to what has been reported in humans. 3 This suggests that measurement of Hcy in icteric samples can provide falsely elevated results. It would thus be inadvisable to measure Hcy in grossly icteric canine samples.
Results of linearity under dilution (LUD) and recovery tests.
Results obtained in serum, and in EDTA or lithium-heparin plasma, were compared using the Friedman test. The mean values obtained were 6.4 ± 4.1 μmol/l in serum, 4.7 ± 4.0 μmol/l in EDTA plasma (P < 0.001 vs. serum), and 4.2 ± 3.2 μmol/l in lithium-heparin plasma (P < 0.001 vs. serum). The reason why this decrease occurred cannot be hypothesized by the data presented in the current study. In humans, delayed centrifugation has been demonstrated to lead to increased Hcy values because of the release of Hcy from erythrocytes. 1 It is unlikely that this occurred in the present study because serum and plasma were centrifuged within 30 min. Also, a possible dilutional effect of the anticoagulant is unlikely because the decrease of Hcy in plasma was greater than the percentage of dilution of blood into the anticoagulant. Despite the reason for this decrease, serum should be considered the sample of choice for Hcy testing based on the imprecision of the method at low Hcy concentrations. This latter point was confirmed by data from samples with <2.0 μmol/l of Hcy in serum that had undetectable levels of Hcy in at least one of the triplicate measurements of plasma. Again, this decrease would become less relevant in samples with high Hcy levels. Nevertheless, reference intervals for serum should be different from those designed for plasma.
Although the definition of the precise diagnostic or prognostic role of Hcy measurement in different pathologic conditions, establishment of reference intervals and discrimination values, and the possible influence of variables such as sex and age on Hcy concentration were out of the scope of the current study, the potential role of Hcy as a biomarker in dogs was investigated by comparing particular categories of diseases. Data from the different groups of dogs were compared by the Kruskal-Wallis test, followed by the Dunn's multiple comparison test, to investigate possible group differences. Control dogs had a mean Hcy value of 5.72 ± 3.26 μmol/l (median = 5.82 μmol/l, min.-max. range: 1.43–11.23 μmol/l). This value demonstrated that test results >5.0 μmol/l are likely to be clinically relevant. It is thus unlikely that the imprecision of the method at low Hcy levels would affect clinical decisions. The other groups had Hcy values that were not significantly different from those of the control group, with the exception of dogs with renal diseases (18.86 ± 10.15 μmol/l; median: 16.99 μmol/l, min.-max. range: 9.38–32.07 μmol/liter) or with heart disease (10.21 ± 6.09 μmol/l; median: 7.64 μmol/l, min.-max. range: 4.47–24.50 μmol/l), which were significantly different (P < 0.001 and P < 0.05, respectively) from those of the control group (Fig. 3). The groups included in the present study were heterogeneous in terms of age, sex, type of pathophysiology, and severity of diseases. In addition, there was no information about the presence of complications that were potentially responsible for hypertension such as arterial stenosis or endothelial damage. Although statistically significant sex- or age-related differences were not detected, it is possible that the other factors mentioned above could influence the distribution of Hcy values in healthy and diseased dogs. Nevertheless, the results suggest that, as in humans, renal and cardiac diseases in dogs are characterized by increased Hcy levels. To assess the possible clinical usefulness of Hcy measurement, for each point value, the diagnostic specificity and sensitivity of high Hcy concentrations were calculated using standard formulae to identify a “positive” group composed of dogs with renal or cardiac diseases. 19 The discriminating power of Hcy for these conditions was assessed by designing a receiver operating characteristic (ROC) curve and by calculating the positive likelihood ratio. 6 The area under the ROC curve (Fig. 4) was 77%, and the likelihood ratio to distinguish these conditions from other diseases was >3 at Hcy values >9.1 μmol/l (data not shown). This information, coupled with the pretest probability of disease raised by other clinical, clinicopathological, or instrumental data, could improve diagnosticians' ability to detect and monitor renal and cardiac diseases.
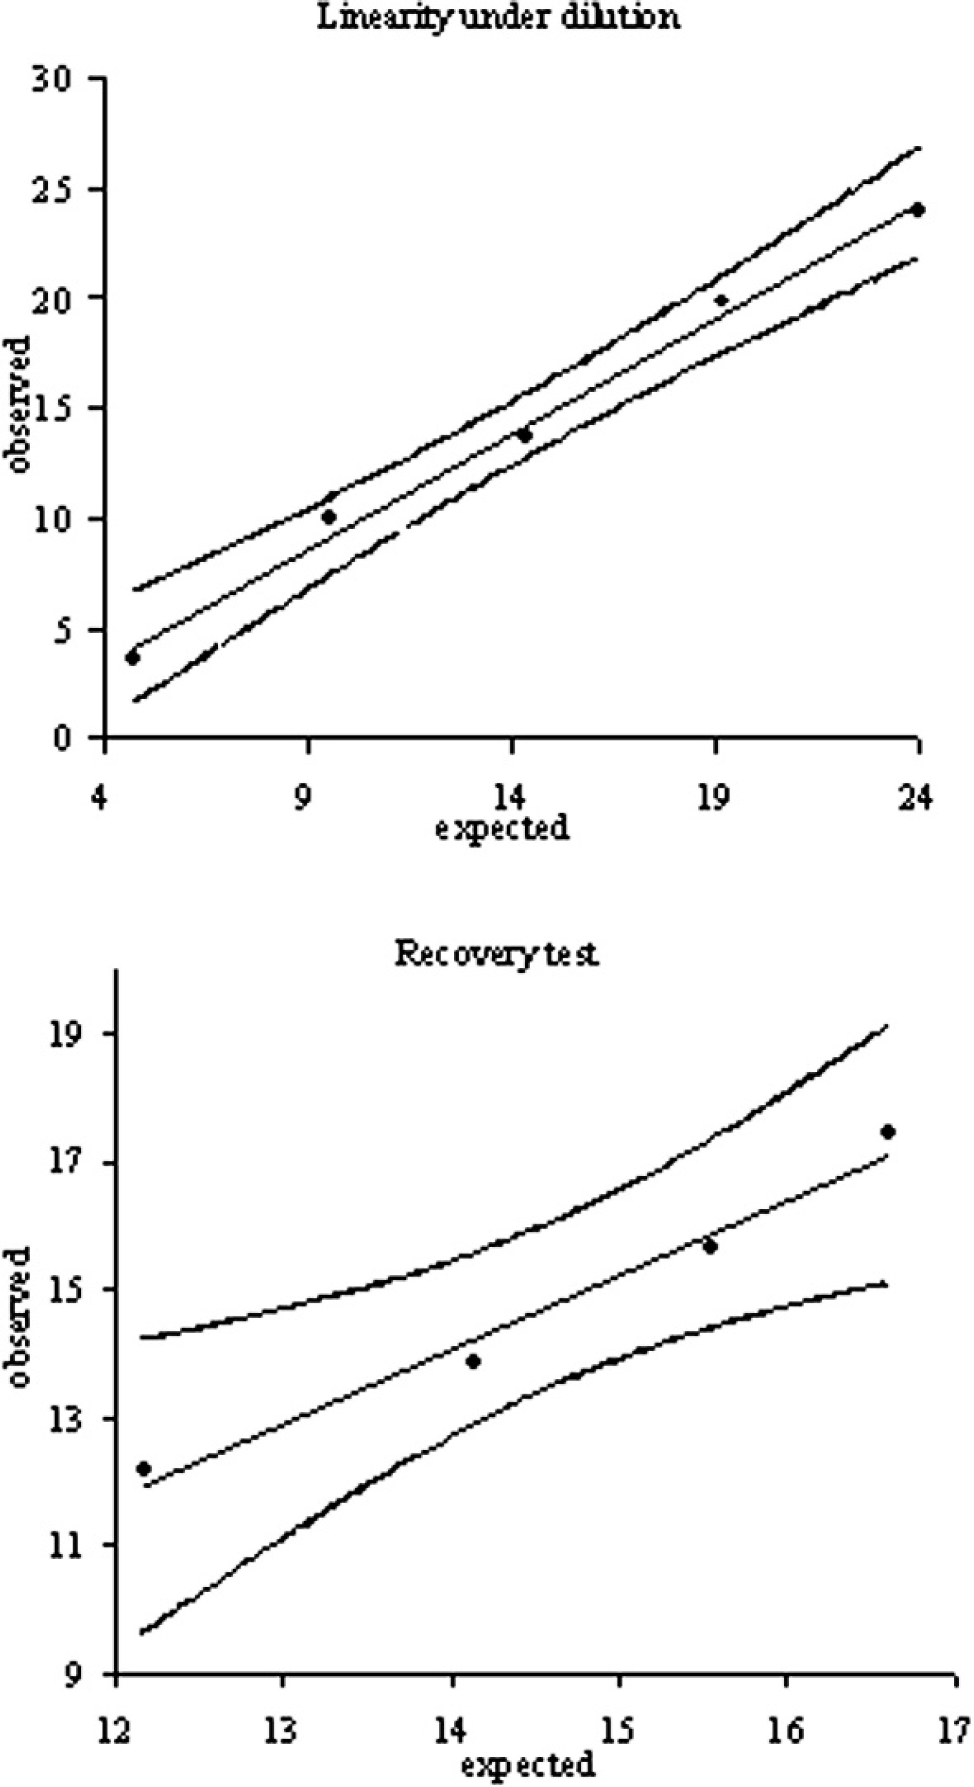
Linearity under dilution (LUD) of serum pool D and recovery tests obtained by mixing different amount of pool E with a fixed amount of pool D. Observed values (in μmol/l) were statistically correlated to the expected value according to a linear model, as demonstrated by the “lack of fit” test. LUD test—intercept: −0.90 (95% confidence interval [CI]: −3.37 to 1.57); slope: 1.05 (95% CI: 0.90–1.21); recovery test—intercept: −2.31 (95% CI: −10.27 to 5.64); slope: 1.17 (95% CI: 0.63–1.71).
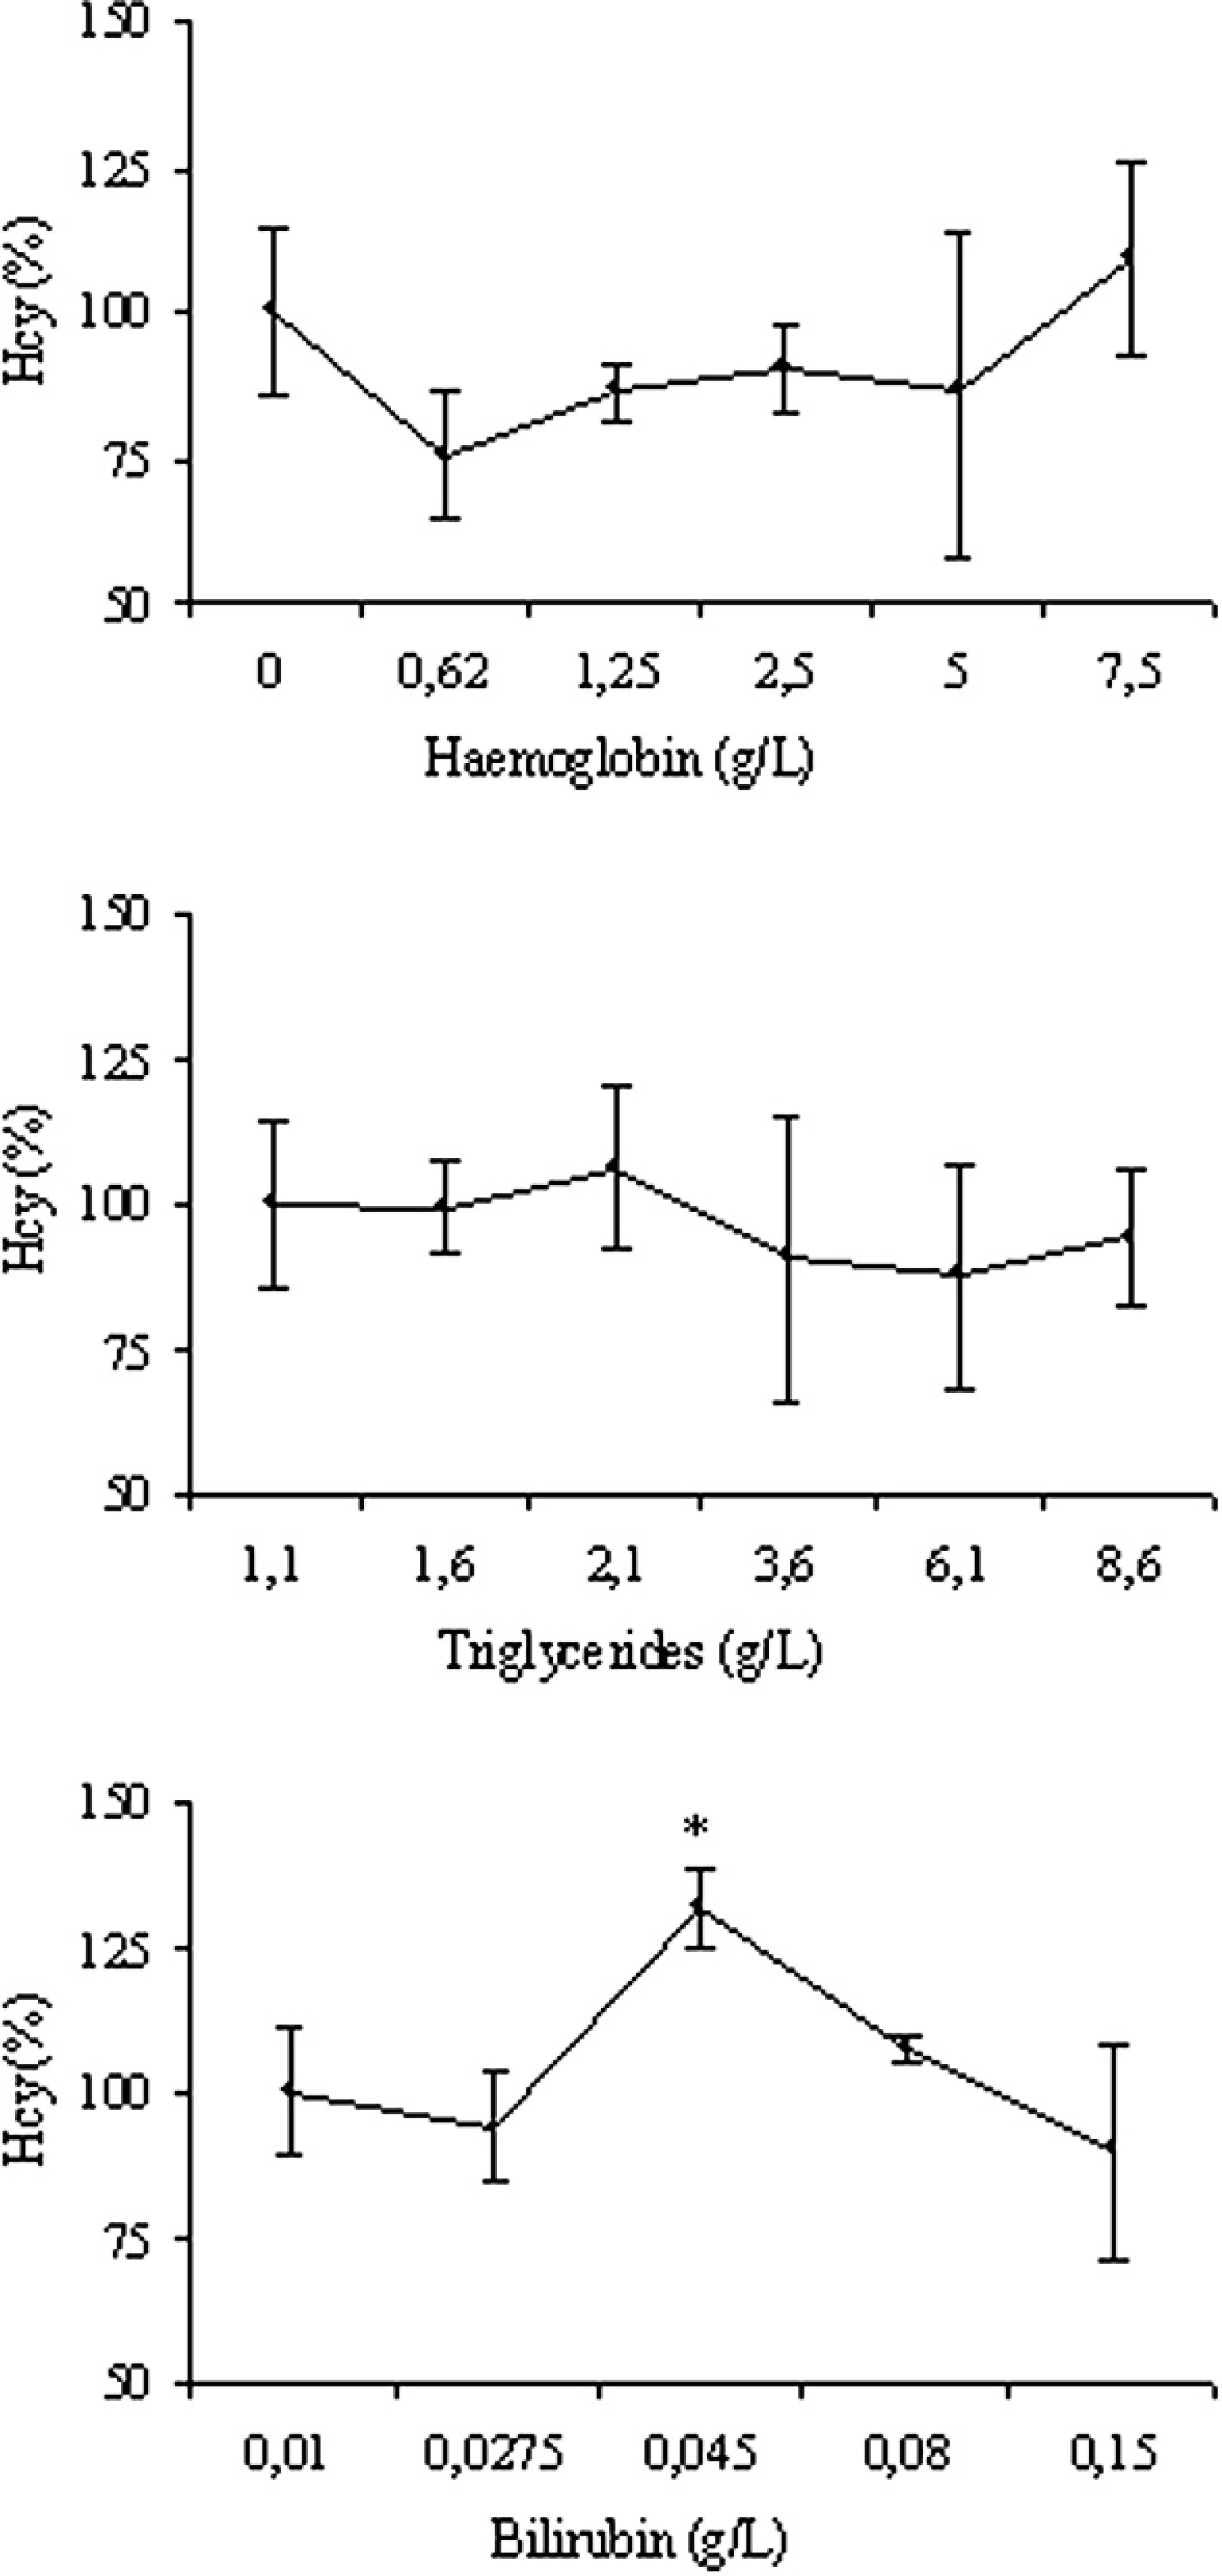
Interferogram for hemoglobin, triglycerides, and bilirubin. Results are expressed as percentage of the original value. Each data point represents the mean ± standard deviation of triplicate measurement, expressed as percentage variation compared with the basal value. * = significantly higher (P < 0.001) than the baseline value.
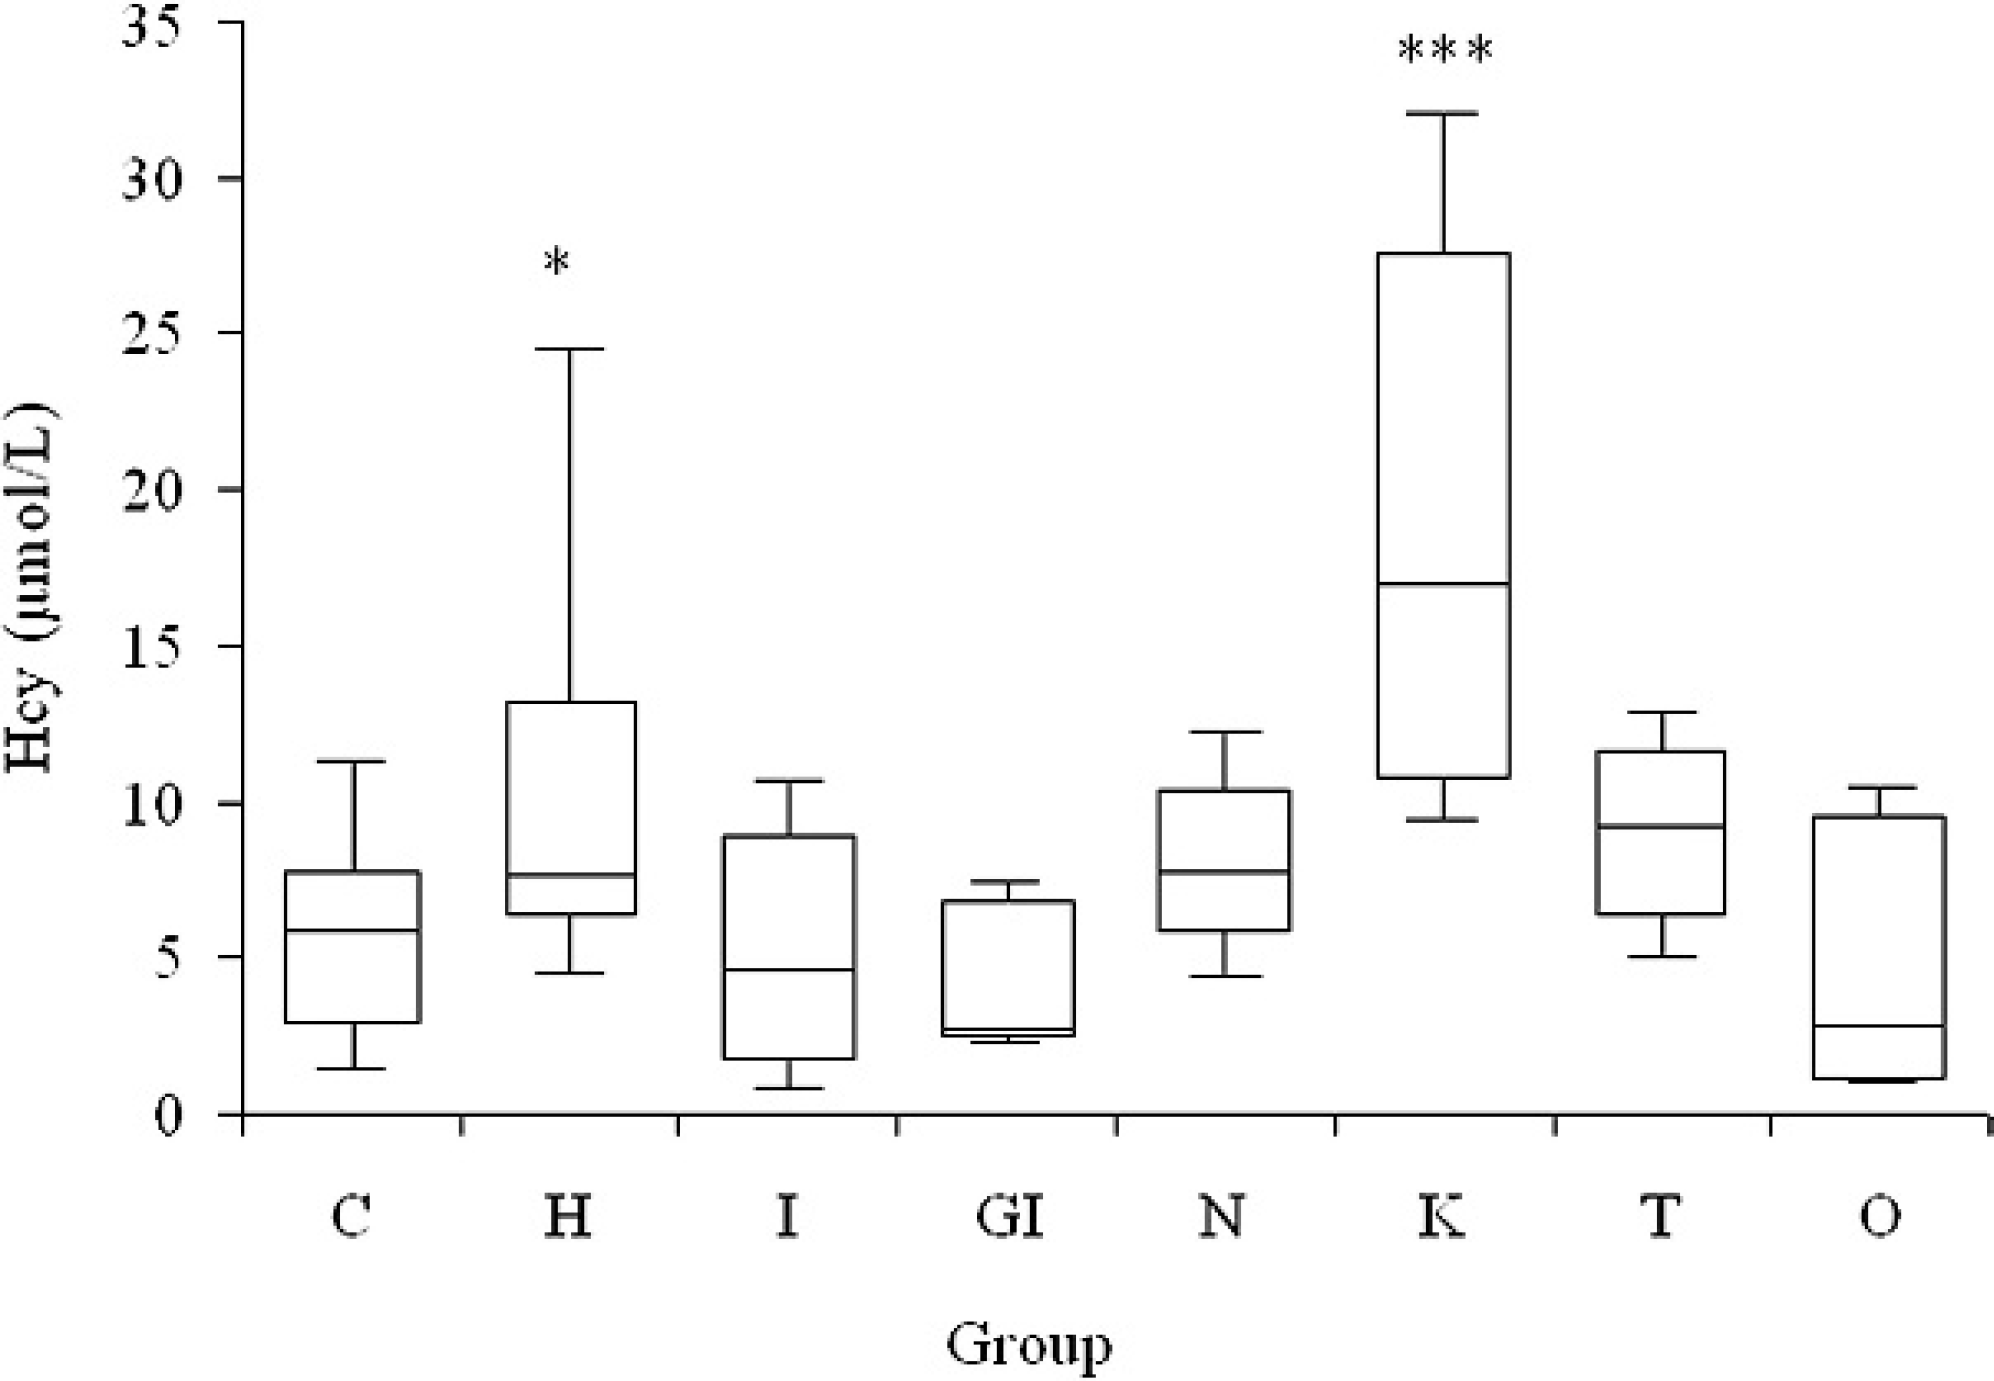
Concentration of homocysteine (Hcy) recorded in the following groups of dogs: C = controls; H = heart diseases; I = inflammation; GI = gastrointestinal diseases; N = neoplasia; K = kidney disease; T = trauma; and O = others (miscellaneous). Boxes = I–III inter-quartile range; horizontal lines = median value; vertical lines = min.-max. range; * = P < 0.05 vs. control group; *** = P < 0.001 vs. control group.
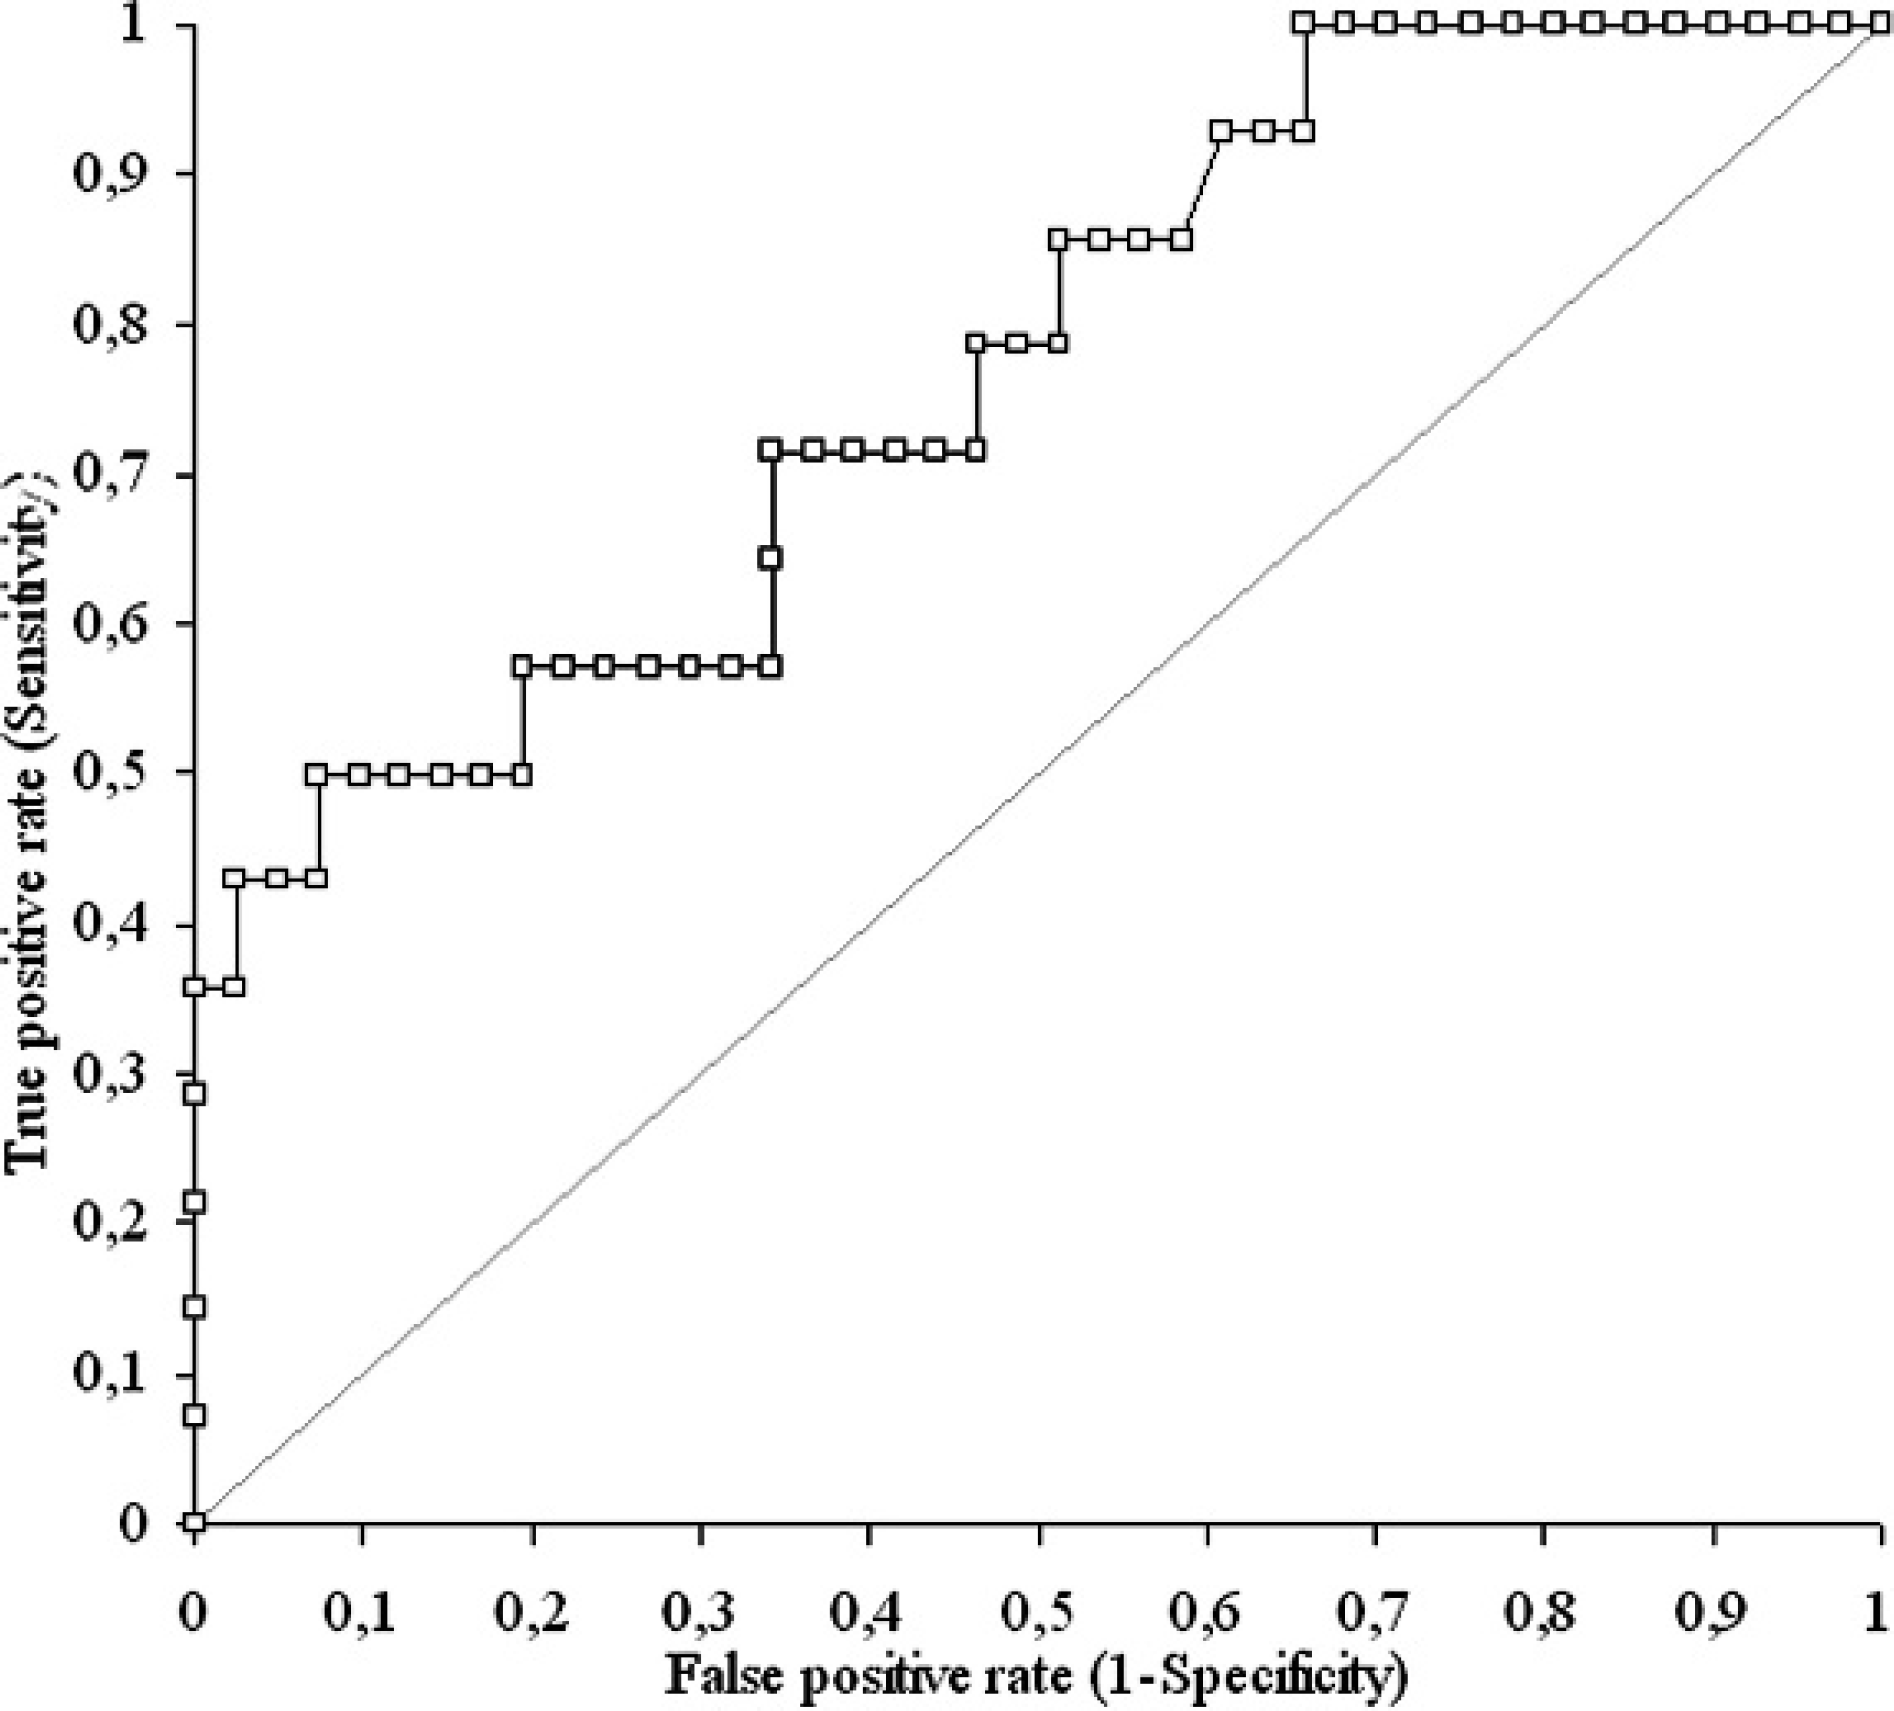
Receiver operating characteristic curve showing the discriminating power of homocysteine for cardiac or renal diseases.
In conclusion, preliminary evaluation demonstrated that the enzymatic measurement of Hcy on canine samples was precise at Hcy concentrations close to or higher than the clinical decision limit. Also, serum should be preferred to plasma samples, and the use of grossly icteric samples should be avoided. Additional studies to better define a possible relationship between Hcy levels and the type of heart or kidney dysfunction, or between Hcy levels and other negative prognostic factors, are currently being investigated at the authors' respective institutions. To date, the present study confirms that the enzymatic method employed in humans to measure Hcy can provide useful information in dogs and that this biomarker could play an important role in monitoring renal and cardiac diseases.
Acknowledgements. The authors thank Dr. Wolfgang Ziemann and Kerstin Sommer (Demeditec Diagnostics GmbH), and the staff of the Veterinary Clinic Malpensa.
Footnotes
a.
Nuova Aptaca Srl, Asti, Italy.
b.
Venoject®, Terumo Corp., Rome, Italy.
c.
Cobas Mira®, F. Hoffmann-La Roche Ltd, Basel, Switzerland.
d.
Demeditec Diagnostics GmbH, Kiel, Germany.
e.
Microsoft Corp., Redmond, WA.
f.
Analyse-it Software Ltd., Leeds, UK.
g.
Merck KGaA, Darmstadt, Germany.
h.
Lipofundin® S 20%, B. Braun Milano SpA, Milano Italy.
i.
Fluka, Sigma-Aldrich, Milano, Italy.
j.
Hemat 8, SEAC, Firenze, Italy.
k.
Real Time Diagnostic System, Viterbo, Italy.
l.
Instrumentation Laboratory SpA, Milano Italy.