
Abstract
Refractometry is utilized routinely to evaluate canine urine specific gravity (USG) in veterinary clinical settings. We aimed to determine if the magnitude of interobserver reliability when assessing canine USG via refractometry could impact clinical judgment. USG was determined in 38 dogs by 3 registered veterinary technicians (RVTs) using both an optical analog refractometer and a digital refractometer. Summary statistics were reported, interobserver reliability was assessed via intraclass correlation coefficient (ICC) analysis through a 2-way mixed-effects model, and agreement between RVT pairs was compared through Bland–Altman plots. The median analog refractometer USG measurement was 1.018 (range: 1.004–1.040) and for the digital refractometer was 1.0176 (1.0035–1.0357). The analog refractometer average measure ICC was 0.995 (95% CI: 0.992, 0.997; p < 0.001). The digital refractometer average measure ICC was 0.999 (95% CI: 0.999, 1.000; p < 0.001). Strong agreement between all pairs of RVTs was seen via Bland–Altman plots for both analog and digital refractometers, with 95% CIs spanning no more than 0.002 in either the positive or negative direction for all pairings. The interobserver variability in canine USG measurements by RVTs was trivial and did not impact clinical judgment and decision-making.
Urine specific gravity (USG) is one of the most important physical properties evaluated during urinalysis (UA). Serial monitoring of USG provides an estimation of urine-concentrating ability that plays an important role in the evaluation of renal function 5 and in the determination of the response to dehydration following fluid therapy.1,6 Interpretation of serial USG measurements requires an understanding of factors that impact both intra-sample as well as inter-sample variation. It has been shown that refractometer assessment of USG can be affected by the presence and concentration of some solutes (e.g., glucose).2,4,6,12 Several studies have also demonstrated the variability between different refractometers.9,11,14,15 These sources of variation are in addition to the day-to-day variation that can be observed within individual animals as a result of daily variation in hydration status and environment. 10
Another potential source of variation in the results of USG measurements that has not been evaluated extensively is the impact of multiple observers performing refractometry. In the clinical veterinary practice setting, multiple people will interpret, analyze, and record refractometer measurements, accentuating the critical need to understand interobserver variability of measurements. Optical refractometer interpretation could plausibly vary across multiple observers, and thus impact clinical judgment, as has been shown with other visual scale measurements. 3 Demonstration of strong interobserver reliability would increase the clinical confidence in USG data and remove a variable that should be considered when interpreting serial USG measurements during patient evaluation and management.
We report here the interobserver variability of USG measured in clinical urine samples using both an analog and a digital refractometer. Determination of normal interobserver variability might better allow clinicians to decide when a change in USG could be clinically relevant. The American Society for Veterinary Clinical Pathology (ASVCP) has yet to determine allowable total error for urine USG measurements through the Quality Assurance and Lab Standards Guidelines (QALS). We hypothesize that interobserver variability would be a significant source of variation in individual animal urine samples.
Urine samples submitted as part of the routine diagnostic evaluation of dogs presented to the Veterinary Medical Center at The Ohio State University College of Veterinary Medicine (OSU-VMC; Columbus, OH) were eligible for inclusion in this study. Institutional Animal Care and Use Committee approval was obtained before the start of the study. Dogs were included in the study if at least 2 mL of urine remained after routine UA and were available for the analysis. Dogs were not included in the study if < 2 mL of urine were available. Signed owner consents were obtained before sample collection and analysis.
Urine was collected from each animal by voiding, catheterization, or cystocentesis at the discretion of the attending clinician evaluating the animal. Residual whole urine samples were utilized for the interobserver variability experiment within 1 h of submission of the routine UA. All samples were mixed well before determining USG measurements. The collection method, as well as results of a routine UA, were recorded for each patient. All UAs were performed by technicians in the Clinical Pathology Laboratory at OSU-VMC following a standard protocol. Urine samples that were positive for glucose, blood, protein, or ketones on urine dipstick (Chemstrip 9; Roche Diagnostics), had crystalluria, were visibly hematuric, or had bacteria present in the sediments were removed from the study given potential effects of solute composition or concentrations on USG measurements.
The USG of each urine sample was evaluated using 2 drops of urine on 2 handheld, temperature-compensated refractometers by 3 registered veterinary technicians (RVTs) at OSU-VMC. Each RVT was blinded to the results obtained by the other 2 individuals. Before beginning the study, both refractometers were calibrated with National Institute of Standards and Technology traceable calibration fluids (AG fluid calibration standard; Bellingham and Stanley) manufactured in accordance with EN/ISO/IEC 17025:2005 standards. Throughout the study, refractometers were calibrated daily to 1.000, using distilled water, as recommended. 6 Samples were first analyzed by a species-specific analog refractometer (veterinary refractometer 2737-E02; Heska), followed by a species-specific digital refractometer (Palm Abbe digital refractometer PA203; Misco). The digital refractometer reading was always performed after the analog to eliminate bias from the digital read-out provided on the digital refractometer. Refractometers were rinsed with distilled water and dried (Kim Wipes; Kimberly-Clark) between samples.
Descriptive statistics are reported for the entire dataset. Intraclass correlation coefficient (ICC) estimates and their 95% confidence intervals (CIs) were calculated (statistics package v.23; SPSS) based on a mean-rating (k = 3), absolute-agreement, 2-way mixed-effects model. Bland–Altman plots were constructed, and limits of agreement analysis were performed to further assess the relationships between USG measurements between observers. Before beginning the study, it was established that differences between observers of ≤ 0.002 would be considered clinically irrelevant. For all analyses, p ≤ 0.05 was considered significant.
Data were collected from 50 consecutive dogs presented to OSU-VMC requiring a screening UA. Following receipt of the UA results, 12 dogs were removed based on our inclusion and exclusion criteria related to urine composition. The UAs of all dogs included in the study were negative on urine dipstick, exhibited no visual abnormalities, and had no indications of an active urine sediment. An active urine sediment would be one that included any of the following: epithelial cells, red blood cells, neutrophils, casts, mucus threads, spermatozoa, lipid droplets, fungi, metazoan parasites, bacteria, or crystals. 4 The median USG measurement on the analog refractometer was 1.018 (range: 1.004–1.040) and on the digital refractometer was 1.0176 (1.0035–1.0357). When using the analog refractometer, the 3 RVTs agreed on measurements in 21 of 38 (55%) cases. Throughout all measurements with the analog refractometer, the greatest difference for the 3 USG measurements for a single case was 0.003, which occurred once, and in all other cases was 0.001 or none. When using the digital refractometer, the RVTs agreed on measurements in 28 of 38 (74%) cases. Additionally, measurements for each case had a SD of ≤ 0.0008 for all cases.
ICC analysis through a 2-way mixed-effects model identified excellent reliability across the 3 RVTs when using both the analog and digital refractometers to assess urine USG. The average measure ICC was 0.995 with a 95% CI of 0.992–0.997 (p < 0.001) for all 3 RVTs using the analog refractometer. The average measure ICC was 0.999 with a 95% CI of 0.999–1.000 (p < 0.001) for all 3 RVTs using the digital refractometer. An ICC > 0.90 is defined as excellent reliability. 7
Pairings of RVT agreement were also assessed graphically via Bland–Altman plot generation, and agreement was strong (Fig. 1). For the analog refractometer, the mean plus 2 SDs for pairs, differed by ~ 0.002 in either the positive or negative direction (Fig. 1A). Single measurements outside 2 SDs occurred for RVT1 vs. RVT2 (a difference of 0.005) and RVT1 vs. RVT3 (0.006), and 2 such measurements are noted for RVT2 vs. RVT3 (0.002 and 0.002). Differences of 0.005 or 0.006 could introduce variation that would impact clinical decision-making and are both above the cutoff of ≤ 0.002. For the digital refractometer, the mean plus 2 SDs for pairs differed by ~ 0.0015 in either the positive or negative direction (Fig. 1B). Only a single measurement outside 2 SDs is noted across all plots (comparison of RVT1 vs. RVT2). That single measurement was < 0.0015 away from the mean difference, which would be a clinically negligible difference to USG interpretation, and is below the cutoff of ≤ 0.002.
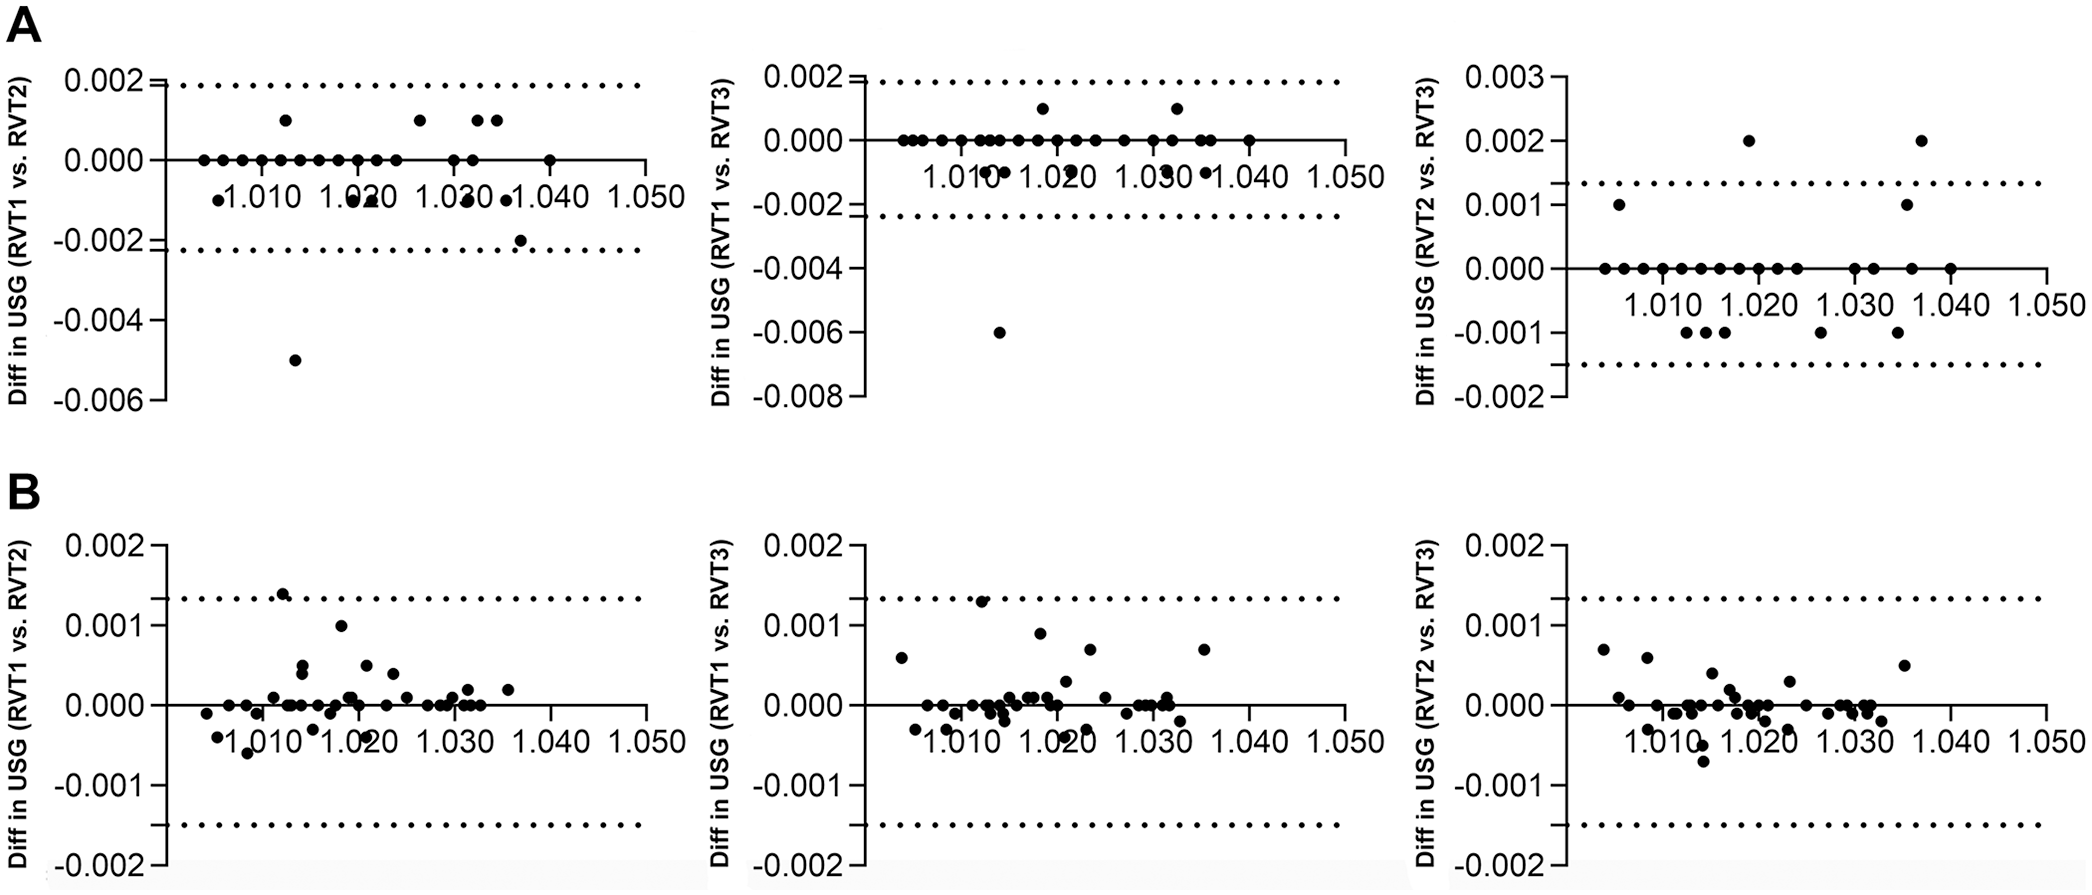
Bland–Altman plots of the difference against the mean urine specific gravity (USG) for pairs of registered veterinary technicians (RVTs). The solid line is the mean difference, and the dashed lines are the 95% limits of agreement. The x-axis shows the average USG of 2 observers, and the y-axis shows the difference (Diff) in USGs between 2 RVTs.
Overall, there was excellent reliability among USG measurements across the 3 RVTs in our study. This reliability was similar for both the analog and the digital refractometer. Our findings support the common practice of having multiple observers perform USG assessments on canine urine samples in a veterinary clinic. Some variability was seen across observers, although it was deemed clinically insignificant (variations of ~≤ 0.002 in 95% of cases). This variation is likely attributable to small optical judgments made by each individual when using the analog refractometer, or minor fluctuations in operation or sample addition to the digital refractometer. Various cutoff USG measurements are used to classify urine concentration clinically. The reported ranges of canine isosthenuria vary from 1.007–1.015 8 to 1.008–1.012. 13 In our scenario, the interobserver differences in USG ≤ 0.002 is unlikely to affect decision-making in a clinical setting unless very firm cutoff values are utilized for USG classification. 9
Although direct comparison of analog versus digital refractometers has been reported, 11 our study demonstrated that a digital refractometer had higher repeatability across multiple observers compared to analog. The SD between paired observers was less on Bland–Altman plots, and the maximum SD across 3 observers was less than the analog refractometer. However, the increased repeatability of measurements across observers of digital refractometer measurements compared to analog is likely negligible from a clinical standpoint, and this difference was not assessed for statistical significance given our inadequate sample size and power requirements to conduct statistical tests of equivalency. Our goal was to determine whether both methods of refractometry were reliable across observers, and we did not directly compare the degree to which one method may be more reliable than the other. Either analog or digital refractometer measurements varied among all 3 observers by ≤ 0.002 in most cases, making either method highly unlikely to introduce clinically significant variation. As noted, on 2 occasions, the analog refractometer measurement varied by an amount > 0.002 (0.005 and 0.006; Fig. 1A) between pairs of RVTs, and these were the only 2 occasions in which we found a clinically significant deviation in measurements.
Sources of variability beyond interobserver variation may have a compound effect on variance. The RVTs performing the USG measurements in our study had 4–14 y of experience in a small animal internal medicine clinic at an AAHA-accredited, tertiary care, academic referral hospital, and received training in all aspects of UA assessment. Not all observers measuring USG are necessarily trained similarly, which could result in variability between measurements. From the clinical laboratory perspective, training is also only a first step, and follow up with personnel that includes ongoing proficiency testing within the program is also a requirement to achieve repeatable results. Considering the training level of observers is likely necessary for anticipating their expected agreement. Further, all urine used for our study had an inactive sediment analysis and a negative colorimetric dipstick analysis for ketones, glucose, and blood, all of which are parameters that could potentially introduce additional variability.2,4,6,12 Indeed, although there is no evidence to suggest that clinically abnormal urine would be interpreted with greater interobserver variability among RVTs, we only included samples with an inactive sediment and negative colorimetric dipstick. Additional study could determine whether urine with these additional characteristics is interpreted with similar interobserver variability. Intraobserver variability was also not assessed in our study but should be examined in future studies as an additional source of variation.
There was an excellent level of consistent agreement across observers in our study, providing ample evidence to support a high degree of clinical confidence in USG evaluation by refractometry performed by multiple individuals on either digital or analog refractometers. Clinicians can confidently interpret clinically significant changes in USG between measurements knowing that USG refractometry is affected minimally by interobserver variability.
Footnotes
Acknowledgements
We thank Misco for providing the digital Misco refractometer used in our study.
Declaration of conflicting interests
The authors declared no potential conflicts of interest with respect to the research, authorship, and/or publication of this article.
Funding
The authors received no financial support for the research, authorship, and/or publication of this article.