
Abstract
Poisoning of domestic animals is frequently caused by anticoagulant rodenticides. Validation and applications of a rapid and reliable method for the simultaneous determination of 8 anticoagulant rodenticides (bromadiolone, brodifacoum, coumachlor, coumafuryl, coumatetralyl, difenacoum, flocoumafen, and warfarin) in baits and animal livers using high-performance liquid chromatography with fluorescence detection are reported herein. The methodology was validated by an in-house validation model at 2.5 mg/kg, which is the level commonly found in the tissues of poisoned domestic animals. The 8 anticoagulants can be determined at the concentration range of 1.25–100 mg/kg with determination coefficients higher than 0.992. A recovery value from 70% to 109% was observed for all the studied molecules. The results of the validation process demonstrate suitability for application in official analysis and for monitoring purposes of animal poisoning by anticoagulant rodenticides.
Introduction
Poisoning by pesticides in human beings1,7 and domestic and livestock animals has been extensively reported worldwide.2,5,6 The use of bait is a serious risk for animals, public health (particularly for children), and the environment, where poisons could enter into the food chain or into rivers and lakes and other waterways. To prevent such risk, a regulation in Italy places more responsibility onto owners and veterinaries involved in animal poisoning cases (Italian Ministerial Regulation of December 18, 2008, Italian Official Journal, no. 13, January 17, 2009). The owners are obliged to report animal poisoning cases to veterinary institutions that can then give instructions regarding analysis; baits and suspected poisoned animal tissues are then sent to official control laboratories (Istituti Zooprofilattici Sperimentali [Experimental Zooprophylactic Institute]) for diagnostic and toxicological analysis. The veterinarian cannot give an independent diagnosis without the auxiliary laboratory analysis. In cases of poisoned tissues and contaminated baits, it is compulsory to communicate the results to specified authorities. Such measures have contributed to an increase in the number of routine analyses conducted on baits and tissues of poisoned animals in Italy.
Analysis of Centro Antiveleni di Milano (Poison Control Center of Milan) data revealed that rodenticides (36%) was the most frequent group of pesticides involved in pet poisonings, followed by insecticides (25.6%), herbicides (24.3%), fungicides (8.1%), and molluscicides (6%). 2 According to these findings, the demand for analytical services for the detection of anticoagulant rodenticides in various specimens has largely increased.
Anticoagulant rodenticides based on the coumarin ring have been used for many years to control a variety of rodents. Currently, there are 2 families of anticoagulant rodenticides: first- and second-generation rodenticide compounds. 14 The most common first-generation anticoagulant rodenticides are warfarin and coumafuryl, which are gradually being phased out because of the emergence of rodents that are resistant to these first-generation compounds. The newer, second-generation compounds were developed to kill rodent populations that had become resistant to the first-generation rodenticides. The most common second-generation compounds encountered in veterinary practice are brodifacoum and bromadiolone.
The fundamental mechanism of action is the inhibition of vitamin K epoxide reductase, which causes blood-clotting alterations leading to hemorrhage as ultimate cause of death. Residues are essentially absent from the poisoned animal’s stomach content. Of the other internal tissues, the liver usually contains a high amount of these substances; thus, it can be considered the most useful tissue for analysis. 8 Methods based on high-performance liquid chromatography (HPLC) combined with ultraviolet or florescence detection for analysis of anticoagulant rodenticides have been reported.12,15 Methodologies using HPLC with mass spectrometry detection4,10,11,16 offer better sensitivity and versatility but require a more expensive experimental setup. None of the cited analytical methods presents complete validation studies for all of the anticoagulants that normally cause animal poisoning in southern Italy, including the region of Puglia e Basilicata. In the current study, a multi-residual method for the determination of first- and second-generation anticoagulants in animal liver and baits is reported. The method extraction procedure, described previously, 3 has been modified with minor changes, and the chromatographic separation has been optimized for detection of 8 anticoagulant rodenticides (bromadiolone, brodifacoum, coumachlor, coumafuryl, coumatetralyl, difenacoum, flocoumafen, and warfarin). In particular, fluorescence detection wavelengths, described previously, 9 were used in the current study, while further studies have been carried out to find the best mobile phase compositions. Finally, the method was submitted to in-house validation at the level commonly found in the tissues of poisoned domestic animals (2.5 mg/kg) in response to the increased number of requested analyses. The validation parameters allowed this method to be used for analysis of real samples of poisoned animals.
Materials and methods
Standards
The methanol, a water, a and acetonitrile a used for the standard preparation were of HPLC grade. Standard solutions at a concentration of 1,000 ± 14 mg · l−1 for each anticoagulant of brodifacoum b (purity grade 99.4%), coumafuryl b (purity grade 99.2%), difenacoum b (purity grade 98.7%), and flocoumafen b (purity grade 99.2%) were prepared by solving 10 mg of the powder in 10 ml of acetonitrile. a Standard solutions at the same concentration of bromadiolone b (purity grade 99.8%), coumachlor b (purity grade 99.9%), coumatetralyl b (purity grade 99.5%), and warfarin b (purity grade 99.2%) were prepared by solving 10 mg of the powder in 10 ml of methanol. a These solutions were stable stored in amber flask at −20°C for up to 6 months. A mixed solution of 100 mg/l of all anticoagulants was prepared in methanol by using a 10-ml volumetric flask; this solution was stable in amber flask for 3 months at −20°C and was periodically checked. The stability studies were carried out by HPLC analysis assuming that the ratio between the peak areas of the fresh standard solutions and tested solution were in a fixed range (5%). Working standard solutions at concentrations of 0.25, 0.5, 2.5, 5, 10, and 20 mg/l, used for instrumental calibration, were freshly prepared in each analytical session by dilution of 100-mg/l mixed solution in mobile phase.
Biological samples
The blank samples necessary for method optimization and validation were chosen among tissue samples of domestic animals testing negative for anticoagulants after a diagnostic investigation carried out in the veterinary diagnostic department of the authors’ institute. Fortified samples at a concentration of 2.5 mg/kg were prepared by spiking, prior to the extraction, a blank liver dog sample (4.0 g) with 100 µl of 100-mg/l standard solution that was used solely for spiking and for no other experimentation.
Equipment and analytical conditions
Chromatographic separations were performed on a commercial HPLC system. c The HPLC system was equipped with a silica-based column d (250 × 4.6-mm internal diameter; particle size: 5 µm) set at 30°C. Mobile phases A and B were water a with 0.25% glacial acetic acid e and methanol a with 0.25% glacial acetic acid, e respectively. The optimized chromatographic method consisted of the mobile phase composition A (75%) constant for 5 min, followed by an elution gradient, as reported in Table 1. The flow rate was 0.5 ml/min, and the injection volume was 20 µl. Fluorescence detection was performed at the emission and excitation wavelengths of 310 nm and 390 nm, respectively, using a photomultiplier tube gain value of 10. The system was interfaced, via network chromatographic software, f to a personal computer for instrumentation control, data acquisition, and processing. Briefly, when a signal is integrated, the software identifies a start time and an end time for each peak and marks this point; finds the apex for each peak (retention time); constructs a baseline; and calculates the area, height, and peak width for each peak. From the area value, using the calibration curve, the software determinates the concentration of each analyte. The value of integration parameters for the slope sensitivity and peak width were 1 and 0.1, respectively.
Elution gradient scheme.*
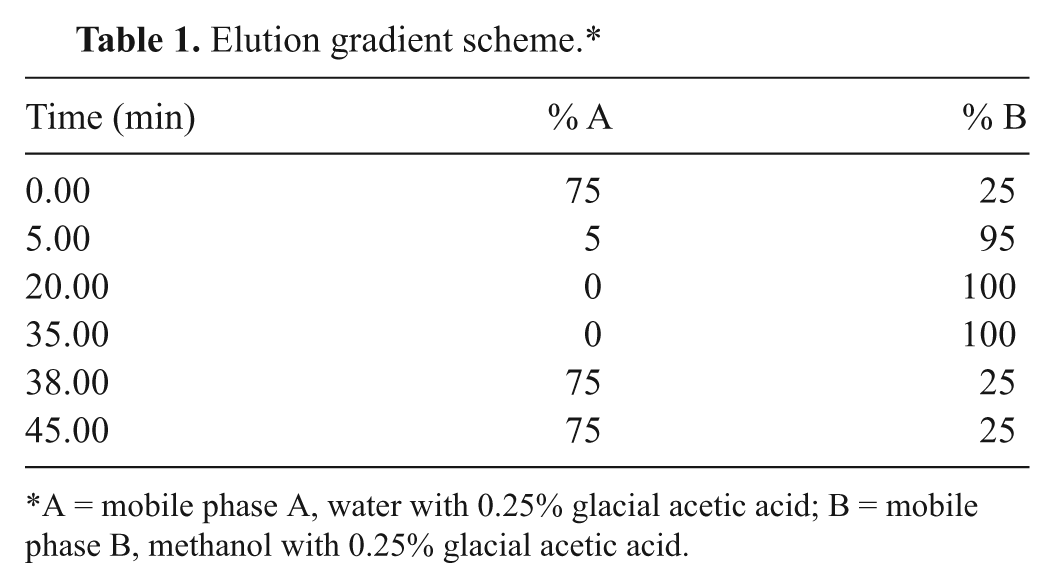
*A = mobile phase A, water with 0.25% glacial acetic acid; B = mobile phase B, methanol with 0.25% glacial acetic acid.
Sample treatment
All the solvents used for sample treatment were of analytical grade. Four grams of sample, ground just before the extraction using a commercial grinder g employing plates with 3-mm diameter holes, was treated in a polypropylene tube with 40 ml of dichloromethane e and acetone e (70:30 vol/vol) and shaken by vortex mixer for 15 min. The resulting mixture was filtered by gravity using ashless filter paper h (90 mm in diameter) supported by glass funnel and purified by an alumina-based column (500-mg to 6-ml column i ) connected to a water vacuum pump system, previously conditioned with 5.0 ml of extraction solution. Two milliliters of the filtered extract was applied to the column for the sample cleanup. After washing with 1.0 ml of extraction solution and 1.0 ml of dichloromethane e and acetone e (25:75 vol/vol), anticoagulant rodenticides were eluted with 1.0 ml of methanol a and glacial acetic acid e (95:5 vol/vol). The eluate was evaporated to dryness at 60°C using a nitrogen flow. The residue was solubilized in 1.0 ml of methanol, a filtered by a syringe equipped with an alumina-based membrane filter h (0.2 µm, 10 mm), and then immediately injected for HPLC analysis. The analytical procedure resulted in a 5-fold dilution of anticoagulants, evaluated against a concentration of analyte in the specimen.
Results
Optimization and validation parameters
To obtain the best conditions for the determination of the 8 molecules, optimization of extraction and chromatographic conditions was achieved by analyzing blank samples of liver fortified with the 8 anticoagulant rodenticides at a concentration of 2.5 mg/kg for each analyte. The chosen amount was determined by the average concentrations, which characterizes the common tissue samples containing these substances.
Different extraction solvent mixtures based on dichloromethane and acetone were tested to verify the recovery values for the analytes. Four different concentrations at the volume ratios of 50:50, 60:40, 70:30, and 80:20 were used. The highest recovery was obtained by using a mixture of 70:30 (vol/vol) of dichloromethane and acetone. To achieve the best chromatographic separations and avoid the matrix effect, a series of experiments with different elution gradients was performed; the variation of elution gradient was tested over a range of 50–90% for solution A. The best results were obtained by using a mobile phase elution gradient that provided, as shown in Figure 1, good shapes for the peaks, a retention time of less than 30 min, and absence of matrix effect. Therefore, in these experimental conditions, an efficient peak separation was obtained for all anticoagulants with the exception of coeluted flocoumafen. An extra time of 10 min in the elution gradient was necessary to recondition the system over a range of 35–45 min. The system was deemed reconditioned when the initial percentages of A and B solutions were obtained (75% and 25%, respectively). The emission and excitation wavelengths are those reported previously, 9 but postcolumn derivatization was not employed in the method described herein.
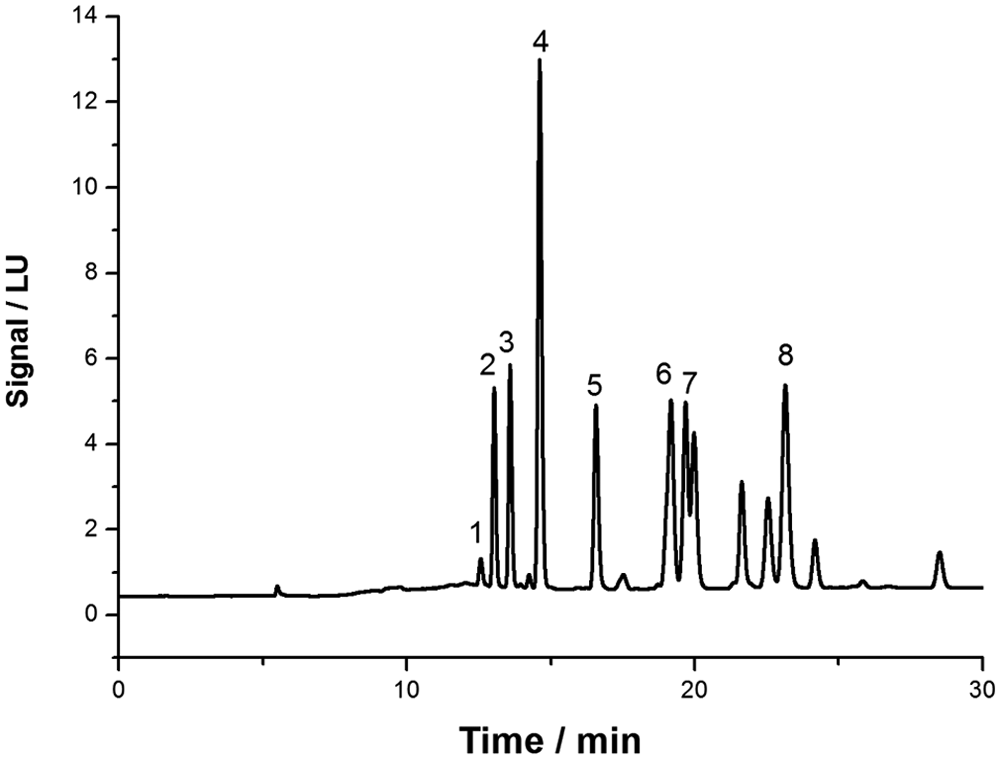
Chromatogram of a standard mixture of the 8 anticoagulant rodenticides at a concentration of 2.5 mg/kg: 1 = coumafuryl; 2 = warfarin; 3 = coumachlor; 4 = coumatetralyl; 5 = bromadiolone; 6 = difenacoum; 7 = flocoumafen; 8 = brodifacoum. LU = luminescence units.
The validation parameters of the method, namely, linearity, specificity, limit of detection (LOD), limit of quantification (LOQ), recovery, and intralaboratory reproducibility in terms of coefficient of variation (CV%), for each rodenticide anticoagulant are listed in Table 2. The linearity of the detection response was studied using standard solutions at 6 calibration levels (0.25, 0.5, 2.5, 5.0, 10.0, and 20.0 mg/l). In the concentration range of 0–20 mg/l, a good linearity for each analyte was observed with a determination coefficient (R2) higher than 0.992, as shown in Table 2. Next, the null hypothesis that the slope is equal to zero was tested. The goodness of fit of the data to the calibration curve was obtained in terms of response factor distribution (area under the peak-to-concentration ratio, yi/xi), with a reference range of y/xmean ± 10%.
Validation parameters. The recovery and the coefficient of variation (CV; intralaboratory reproducibility) of the method were assessed considering 18 experiments (N = 18).*
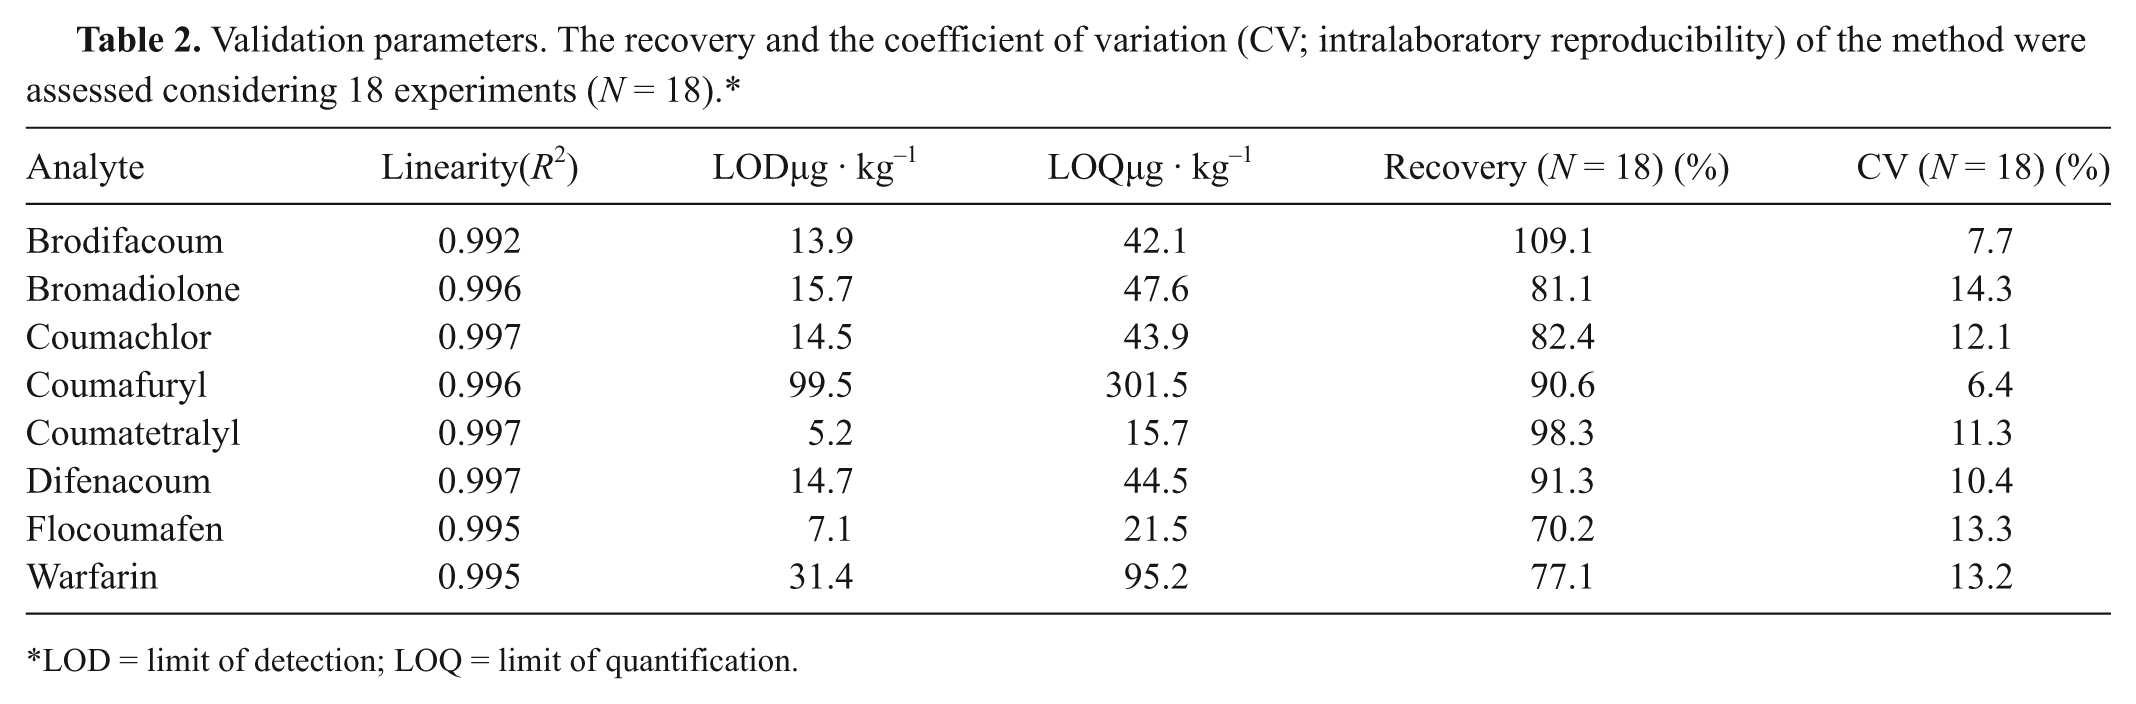
LOD = limit of detection; LOQ = limit of quantification.
Furthermore, any systematic instrumental bias can be ruled out because the intercept includes the zero value at the 95% confidence level. Limits of detection and quantification, reported in Table 2, were calculated according to the following equations: LOD = 3.3s a /b and LOQ = 10s a /b, 13 where s a is the standard deviation of the intercept and b is the slope of the regression line obtained from the calibration curves. To investigate the matrix effect on linearity, the slope and intercept of the calibration curve were statistically compared by a Student’s t-test at the 95% confidence level with those obtained by the analyses of standard solutions in matrix extracts; residual standard deviations were tested by an F-test at the 95% confidence level. Comparisons showed no difference between solvent and matrix curves. Therefore, for sample analysis, calibration curves from standard solutions were used.
The selectivity was tested by analyzing 10 representative blank liver samples of different types of animals (5 cats and 5 dogs). No interference peaks were found around the retention time of analytes, as shown in Figure 2 where the chromatograms of a blank sample and a fortified sample at 2.5 mg/kg for each molecule are reported.
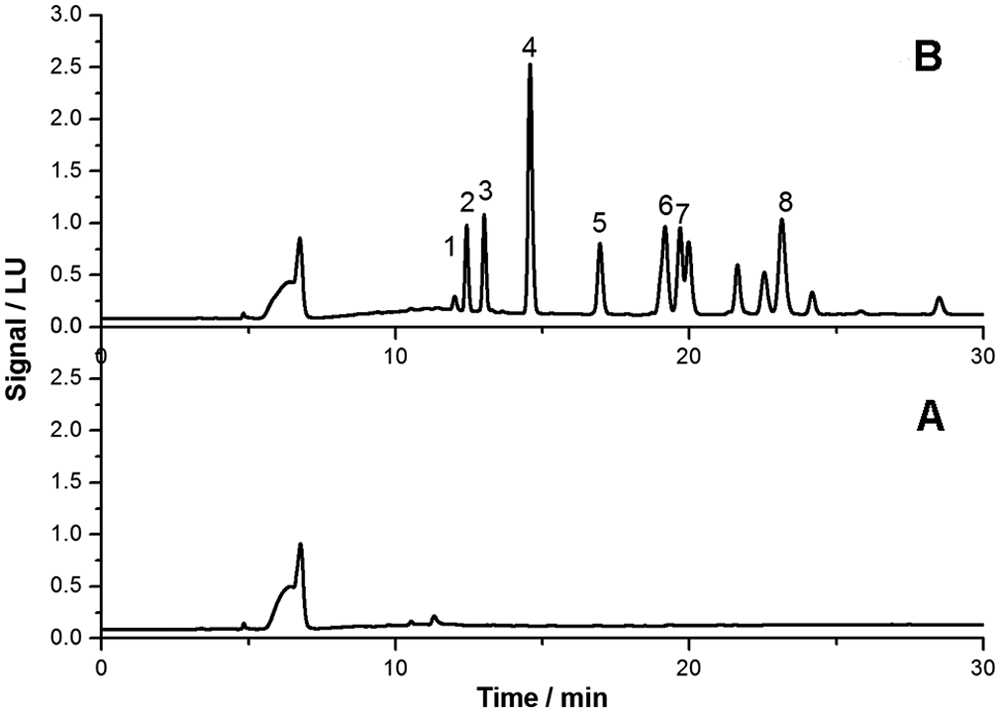
Chromatograms:
The recovery and precision (intralaboratory reproducibility) of the method were assessed by analyzing 3 sets of 6 blank samples fortified with 2.5 mg/kg for each analyte for a total of 18 experiments. The experiments on each set were performed on 3 different days using the same instruments but different operators. The intralaboratory reproducibility, expressed as CV%, for all analytes was not greater than 14% (bromadiolone; see Table 2). As seen in Table 2, the recovery values obtained for liver ranged from 70% to 109%; consequently, the method can be considered valid in terms of trueness.
Application of the method
The analysis of several samples suspected of containing rodenticides was carried out using the proposed method. Real samples were taken from specimens suspected of pesticide poisoning after a veterinary diagnostic investigation conducted by the Istituto Zooprofilattico Sperimentale della Puglia e Basilicata in 2010. Analyses were performed on tissue samples (liver) of different species (dogs and cats being the most common) and solids (bait, undefined material).
Representative chromatograms of real samples of baits and livers are reported in Figure 3. Figure 3A and 3B show the chromatograms of a cat liver and bait, respectively, which tested positive for coumachlor. The chromatograms of 2 samples positive for brodifacoum and bromadiolone can also be seen in Figure 3C and 3D, respectively. The peaks assigned to the detected molecules are very clear, and no interferences are observed in the proximity of their elution time. Despite the relatively high complexity of the analyzed matrices and low concentration of rodenticide in these samples, good selectivity was obtained.
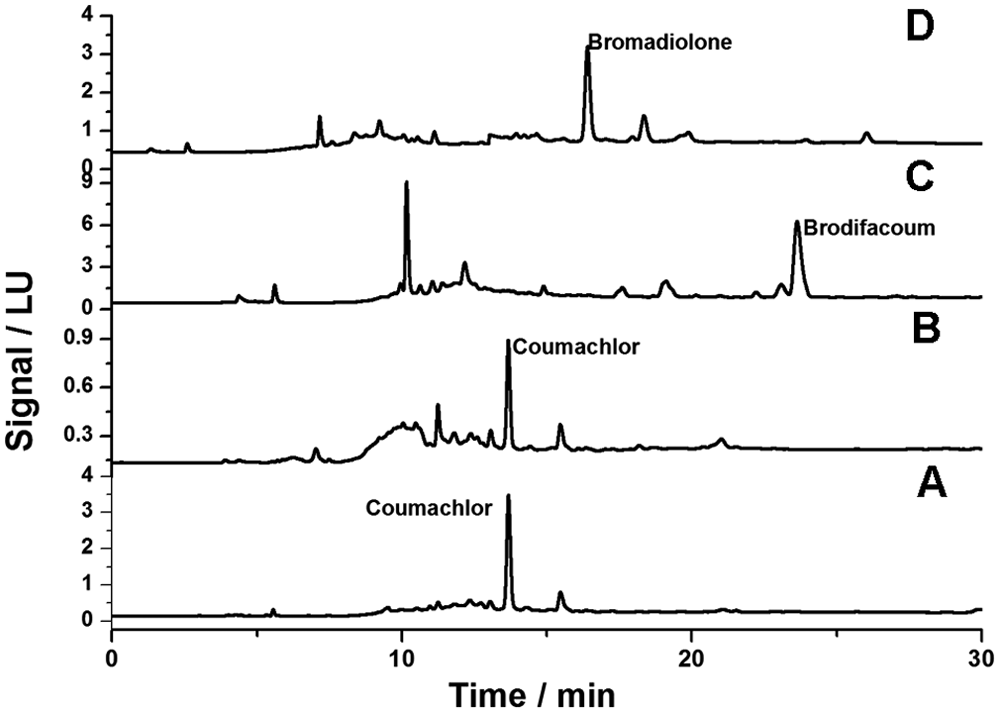
Chromatograms:
Discussion
A simple HPLC method with fluorescence detection for the determination of 8 anticoagulant first- and second-generation rodenticides was validated in the current study. The most important validation parameters such as linearity, specificity, recovery, and precision were studied. The results of the validation process showed the test’s suitability for the simultaneous detection of the anticoagulants in baits and animal liver and its reliability for monitoring purposes.
Footnotes
Acknowledgements
The authors thank Giuseppe Battafarano of the Istituto Zooprofilattico Sperimentale della Puglia e Basilicata (Foggia, Italy) for his expert technical assistance.
a.
Mallinckrodt Baker BV, Deventer, The Netherlands.
b.
PESTANAL®, Sigma-Aldrich, St. Louis, MO.
c.
1200 series system consisting of binary pump (model G1312A), degasser (model G1379B), thermostatted autosampler (model G1329A), autosampler thermostat (model G1330B), thermostatted column compartment (model G1316A), fluorescence detector (model G1321A); Agilent Technologies Deutschland GmbH, Böblingen, Germany.
d.
Luna C18 column, Phenomenex Inc., Torrance, CA.
e.
Carlo Erba Reagenti SPA, Milan, Italy.
f.
ChemStation, Agilent Technologies Deutschland GmbH, Böblingen, Germany.
g.
Model MG 450, Kenwood Corp., Tokyo, Japan.
h.
Whatman no. 40 (90-mm diameter), Anotop™ 10 LC filter; Whatman International Ltd., Maidstone, United Kingdom.
i.
STRATA® SPE Alumina-N column, Phenomenex Inc., Torrance, CA.
The author(s) declared no potential conflicts of interest with respect to the research, authorship, and/or publication of this article.
The author(s) received no financial support for the research, authorship, and/or publication of this article.