
Abstract
The objective of the present study was to develop a one-step, fast, competitive time-resolved fluorescent immunoassay to determine porcine serum amyloid A (SAA) by using species-specific reagents. The assay consisted of an all-in-one format involving only 55 min of incubation that was adapted and validated for use in 3 different specimens: serum, saliva, and meat juice. The method had overall within- and between-run coefficients of variation under 8% and 12%, respectively, and coefficients of determination higher than 0.93 for linearity under dilution analysis for all specimens. The limits of detection were 0.32 mg/l, 0.28 mg/l, and 1.74 mg/l for serum, saliva, and meat juice measurements, respectively. Upper and lower limits of quantification were determined for each sample type and resulted in wide assay ranges that allowed a precise SAA measurement in all the fluids investigated. Statistically significant differences (P = 0.0004 for serum and P < 0.0001 for the saliva and meat juice samples) in SAA levels were found when healthy (n = 20) and diseased (n = 20) pigs were compared. The obtained results indicate that this fast, sensitive, and robust assay for SAA measurement could be of use to determine health and welfare status in swine by employing alternative samples to serum.
Introduction
The achievement of high health and welfare standards are major concerns in pig production. In fact, health and welfare status are not only directly related with the improvement of production rates and meat quality, but also with the accomplishment of more sustainable production models that would match both consumers’ and regulators’ rising demands. 15 It is, therefore, imperative to implement the use of practical tools to define the state of immunological stress both at farm and slaughter level. In this sense, the determination of acute phase proteins is considered a useful instrument. 2
Serum amyloid A (SAA) is considered a major acute phase protein in the pig,14,17 since a large increase in the concentration of SAA has been reported in various diseases, including common diseases found in field conditions, such as Actinobacillus pleuropneumoniae or Mycoplasma suis infection.13,17 To date, the only commercially available tool to study SAA levels in pigs is a multispecies sandwich enzyme-linked immunosorbent assay (ELISA), which has been extensively employed worldwide for SAA determination in pigs, despite its imprecision and its lack of complete suitability for swine. 18 Recently, a competitive ELISA has been developed in the authors’ laboratory using a specific antibody toward porcine recombinant SAA (rSAA), resulting in an upgrade in the determination methodologies for pig SAA, as analytical performance and sensitivity were significantly improved with respect to the commercial assay. 16 However, this method, as is common with most ELISAs, determination of results can be time-consuming and the methodology cumbersome for routine analysis. 1
In contrast to ELISAs, time-resolved fluorescent immunoassays (TR-FIAs) are characterized for being simple and ultrasensitive analytic methods, particularly when combined with specific monoclonal antibodies. 11 Such technology allows for the development of reliable assays with fewer steps and less incubation times, which makes the assays ideal for use at the point of inspection, as reported for other porcine acute phase proteins, such as haptoglobin and C-reactive protein.4,7 Among the advantages of TR-FIA is the possible analysis of fluids other than serum, including meat juice and saliva, since TR-FIA involves minimal backgrounds and no interference from the sample. 1 The purposes of the present study were to develop a competitive TR-FIA for the measurement of SAA in porcine samples of serum, saliva, and meat juice and present an evaluation of its performance.
Materials and methods
Animals
All procedures involving animals were approved by the Murcia University Ethics Committee. Forty male conventional Duroc × (Landrace × Large White) pigs, aged approximately 190 days, from 2 farms in the southeast of Spain with different health status were included in the study. Animals were divided into 2 groups according to the farm of origin. Group 1 pigs came from a specific pathogen–free farm and were considered control pigs (n = 20). The control pigs showed no symptoms of disease and were seronegative for antibodies against Porcine reproductive and respiratory syndrome virus, Pseudorabies virus, and Porcine circovirus-2 (PCV-2). Group 2 included diseased pigs (n = 20) that came from a farm affected by PCV-2. The diseased pigs showed clinical signs of disease such as diarrhea, postweaning multisystemic wasting syndrome, multiple abscesses, or external injuries in tail or ears. Control pigs were humanely euthanized at the abattoir after CO2 stunning and immediate bleeding, while diseased pigs were euthanized by an intravascular overdose of sodium pentobarbital. a
Sample collection
To obtain serum, blood samples (n = 40) were collected by jugular venipuncture using single-use blood collection tubes without any additive. b Blood was allowed to clot for 1 hr at room temperature and then centrifuged at 2,000 × g for 15 min to separate serum.
Saliva samples (n = 40) were collected in tubes for saliva collection, c which contained a sponge instead of cotton swab to maximize saliva recovery after centrifugation as reported previously. 4 The sponge was clipped to a flexible thin metal rod and allowed to be chewed by pigs until it was thoroughly moistened. The sponge was then placed in the tube, and saliva was obtained after centrifugation for 10 min at 3,000 × g.
A piece of diaphragmatic muscle was collected as a source of meat juice specimens after slaughter (n = 40). Pieces of diaphragmatic muscle of approximately 3 cm × 1 cm were placed in meat juice collectors c and frozen at −20ºC overnight. Samples were then thawed for 3 hr at room temperature, and the released meat juice was collected after centrifugation at 3,000 × g. All samples were preserved at −20ºC until time of analysis.
Immunoassay reagents
A biotinylated rat monoclonal antibody produced against porcine rSAA 16 was used as capture antibody, and a Eu-labeled porcine rSAA protein was used as competitor. The capture antibody and the competitor were produced in the authors' laboratory 16 and respectively labeled by using commercially available kits for biotin d and Eu chelate e following the manufacturers’ instructions.
For assay standardization, different calibrators were employed depending on the sample type. An acute phase serum sample was employed as calibrator for SAA determination in serum samples after its content was characterized as described elsewhere. 16 In brief, a primary standard curve of rSAA was analyzed along with an acute phase serum sample; the Eu counts obtained were compared to interpolate the SAA concentration in the serum sample. For saliva and meat juice samples, a serial dilution of rSAA was employed as calibrator.
Immunoassay procedure
The assay developed consisted of a competitive TR-FIA method that involved only one step. The assay conditions were optimized for each fluid to obtain the maximum signal-to-background ratio (described in Table 1).
Specific assay conditions employed for serum amyloid A determination in each sample fluid, determined after optimization for maximal signal-to-background noise ratio.
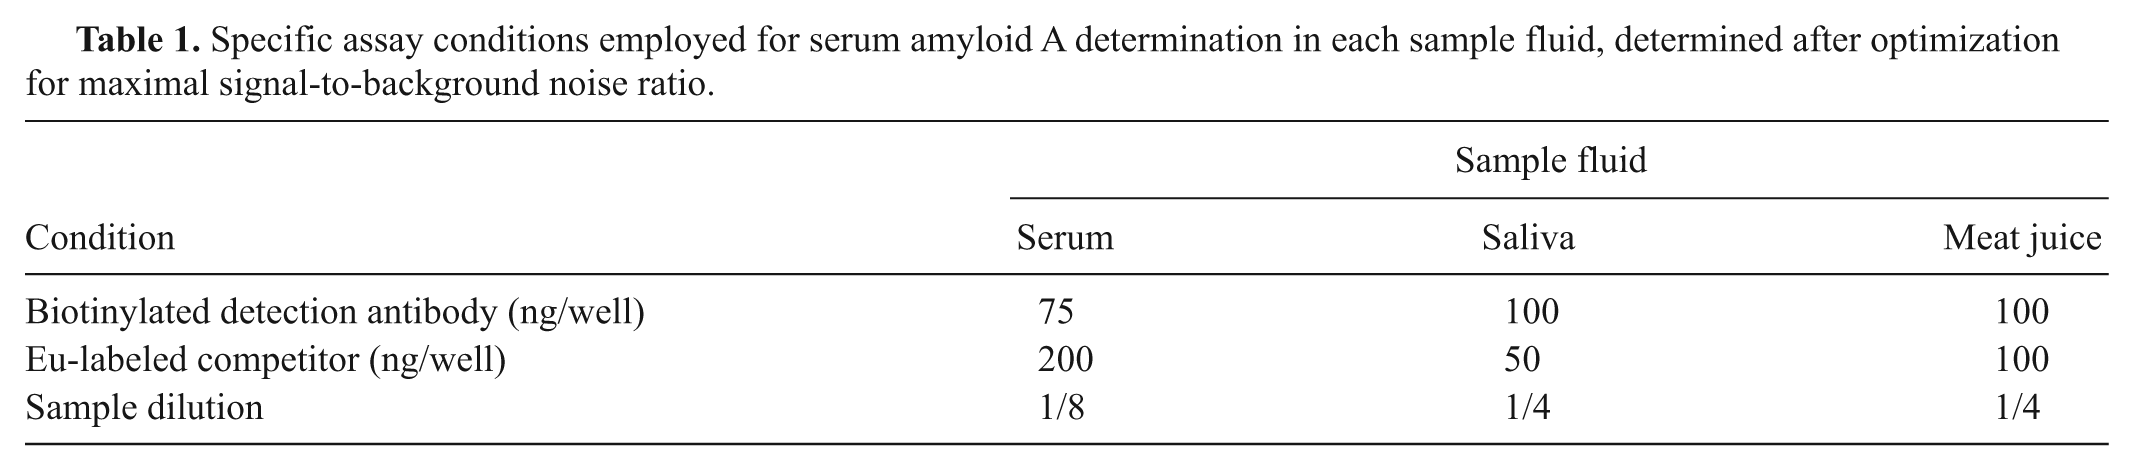
The protocol included the addition of the correspondent amount of biotinylated antibody and Eu-labeled competitor diluted in 75 μl of assay buffer f into streptavidin-coated microtitration strips, g immediately followed by the addition of standards or samples diluted in 25 μl of assay buffer. f Strips were incubated for 45 min with shaking and washed 6 times with wash buffer. h Two hundred μl of enhancement solution i was added to each well and, after incubating for 5 min with shaking, the fluorescence signal was measured in a time-resolved fluorometer. j
Immunoassay validation
The TR-FIA was validated both analytically and clinically. Assay precision, accuracy, and sensitivity were determined for the analytical validation of the TR-FIA for each fluid. The precision was expressed as the coefficient of variation (CV%). To calculate this, 6 animals with high (diseased animals, detailed above) and low (control animals, detailed above) SAA levels were selected, and samples from serum, saliva, and meat juice from each animal were taken. Two pools, 1 with high and 1 with low SAA concentrations were prepared out of each specimen type by mixing equal volumes of samples obtained from these diseased and control animals, respectively. To calculate within-assay precision, SAA content of pools from each fluid was measured 6 times in the same analytical run, while between-assay precision was determined by measuring the same pools on 6 days within a 7-day period. To prevent potential variation resulting from freeze–thaw cycles, all pools were frozen in aliquots, and only vials required for each analytical run were thawed.
Accuracy was indirectly investigated by linearity-under-dilution of the 2 pools prepared from each fluid as previously detailed. These pools were serially diluted by using assay buffer, and the content of SAA was measured for each dilution. The expected and observed concentration of SAA for each pool was determined and compared by linear regression analysis.
The sensitivity of each assay was assessed by the determination of 2 different parameters: analytical limit of detection and limit of quantification. The analytical limit of detection is the lowest concentration of SAA that could be distinguished from a zero sample. It was calculated by determining the average SAA content of 6 measurements of zero calibrator (assay buffer) plus 2 times the standard deviation. 3 The limit of quantification was calculated on the basis of the lowest and highest concentration of SAA that could be measured with a CV ≤20%, which are, respectively, known as the lower and higher limit of quantification (LLOQ and ULOQ). To estimate this parameter, the working standard was serially diluted in assay buffer, and each dilution was analyzed in 5 replicates in the same analytical run. 12
Additionally, the ability of the TR-FIA to distinguish between healthy and diseased animals was tested in serum, saliva, and meat juice samples by clinical validation. For this purpose, SAA was determined in each specimen type from the control (n = 20) and diseased (n = 20) pigs detailed above, and results were compared.
Statistical analysis
Coefficients of variation and assay sensitivity parameters were determined by standard descriptive statistical methods using commercial software. k Ordinary linear regression analysis was used to investigate the linearity under dilution.
Clinical validation results did not follow a normal distribution as assessed by a D’Agostino and Pearson test, so nonparametric Mann–Whitney U test of significance (significance level was settled at P < 0.05) was used to compare values of SAA in healthy and diseased pigs. These analyses were performed by means of statistical software. l
Results
Standard curves were built by diluting the correspondent calibrators and fitting a 4-parameter logistic nonlinear regression model to match the assay ranges determined by the calculated limits of quantification (Fig. 1).
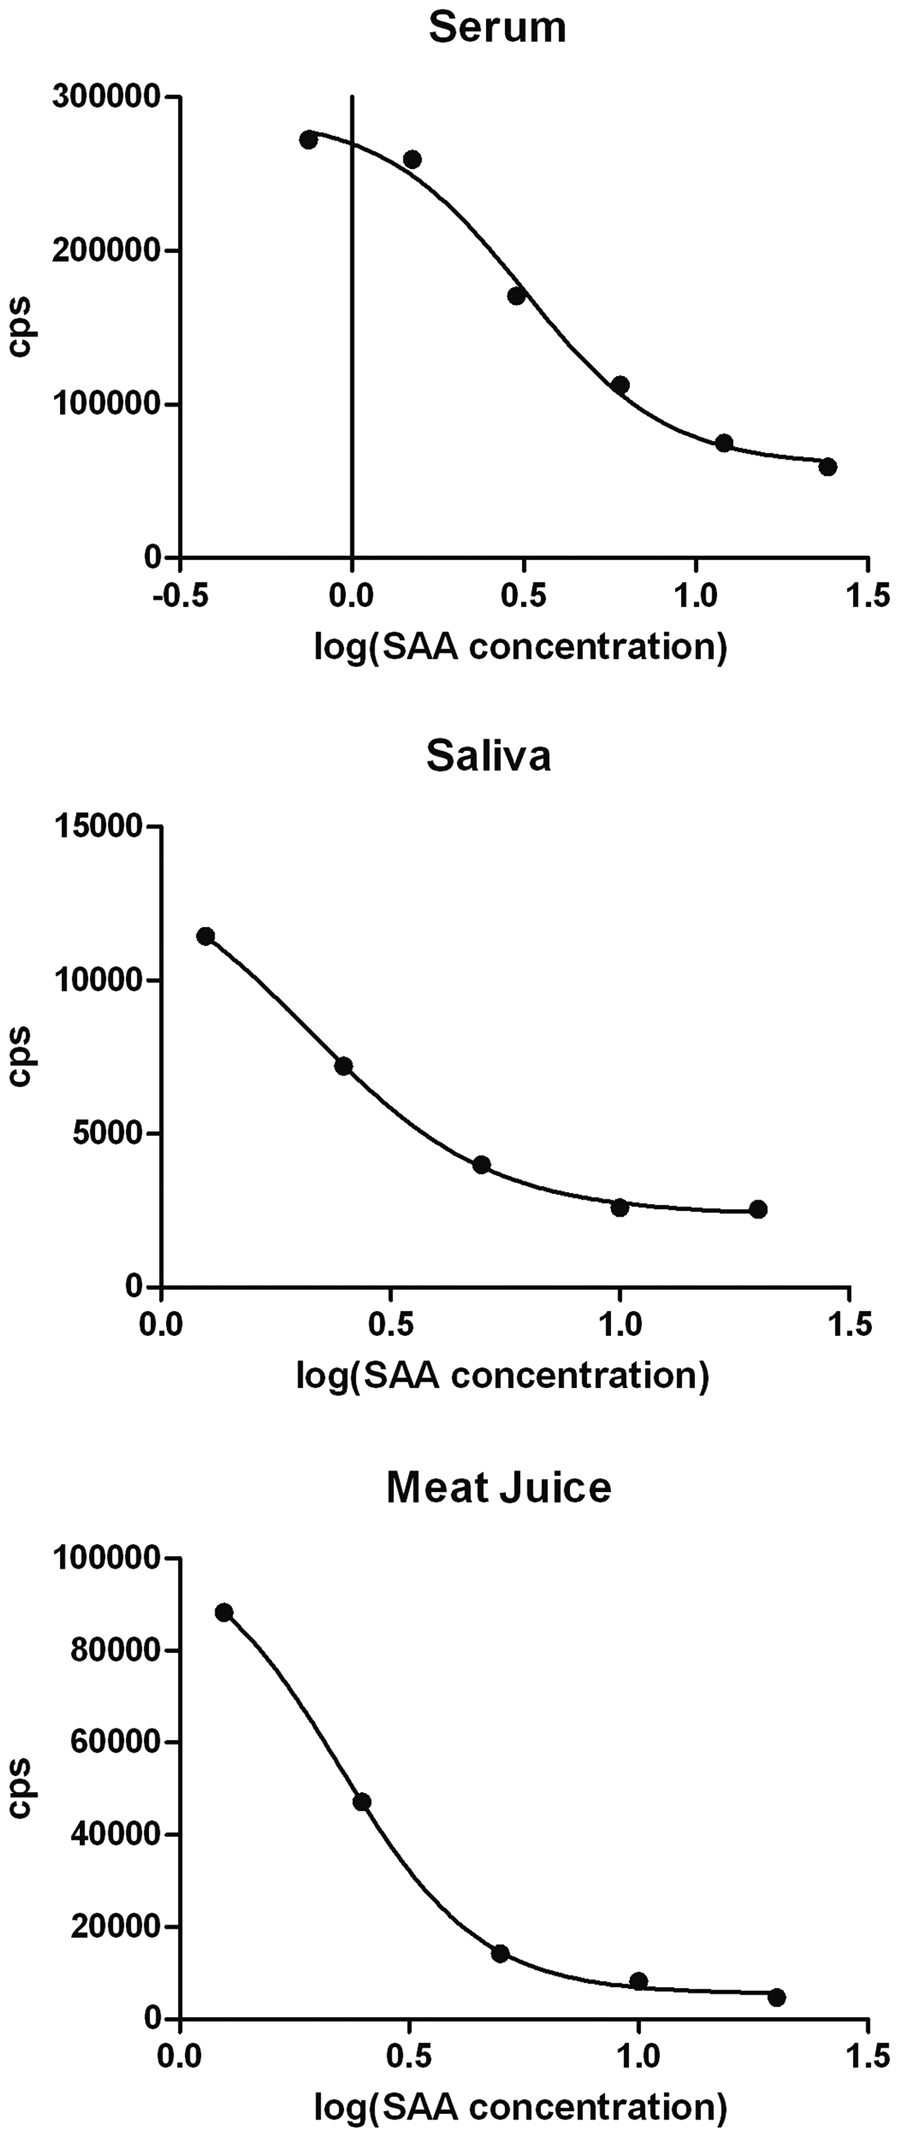
Calibration curves of the optimized time-resolved fluorescent immunoassays for serum amyloid A (SAA) determination in serum, saliva, and meat juice. Europium counts per second (cps) are represented in the Y-axis, and logarithm of SAA concentrations in mg/l are represented in the X-axis.
Analytical validation
Precision
Within-run and between-run CVs ranged from 4.8% to 11.3% and 7.8% to 13.7%, respectively (Table 2).
Within- and between-run precision results of the developed one-step time-resolved fluorescent immunoassay method.*
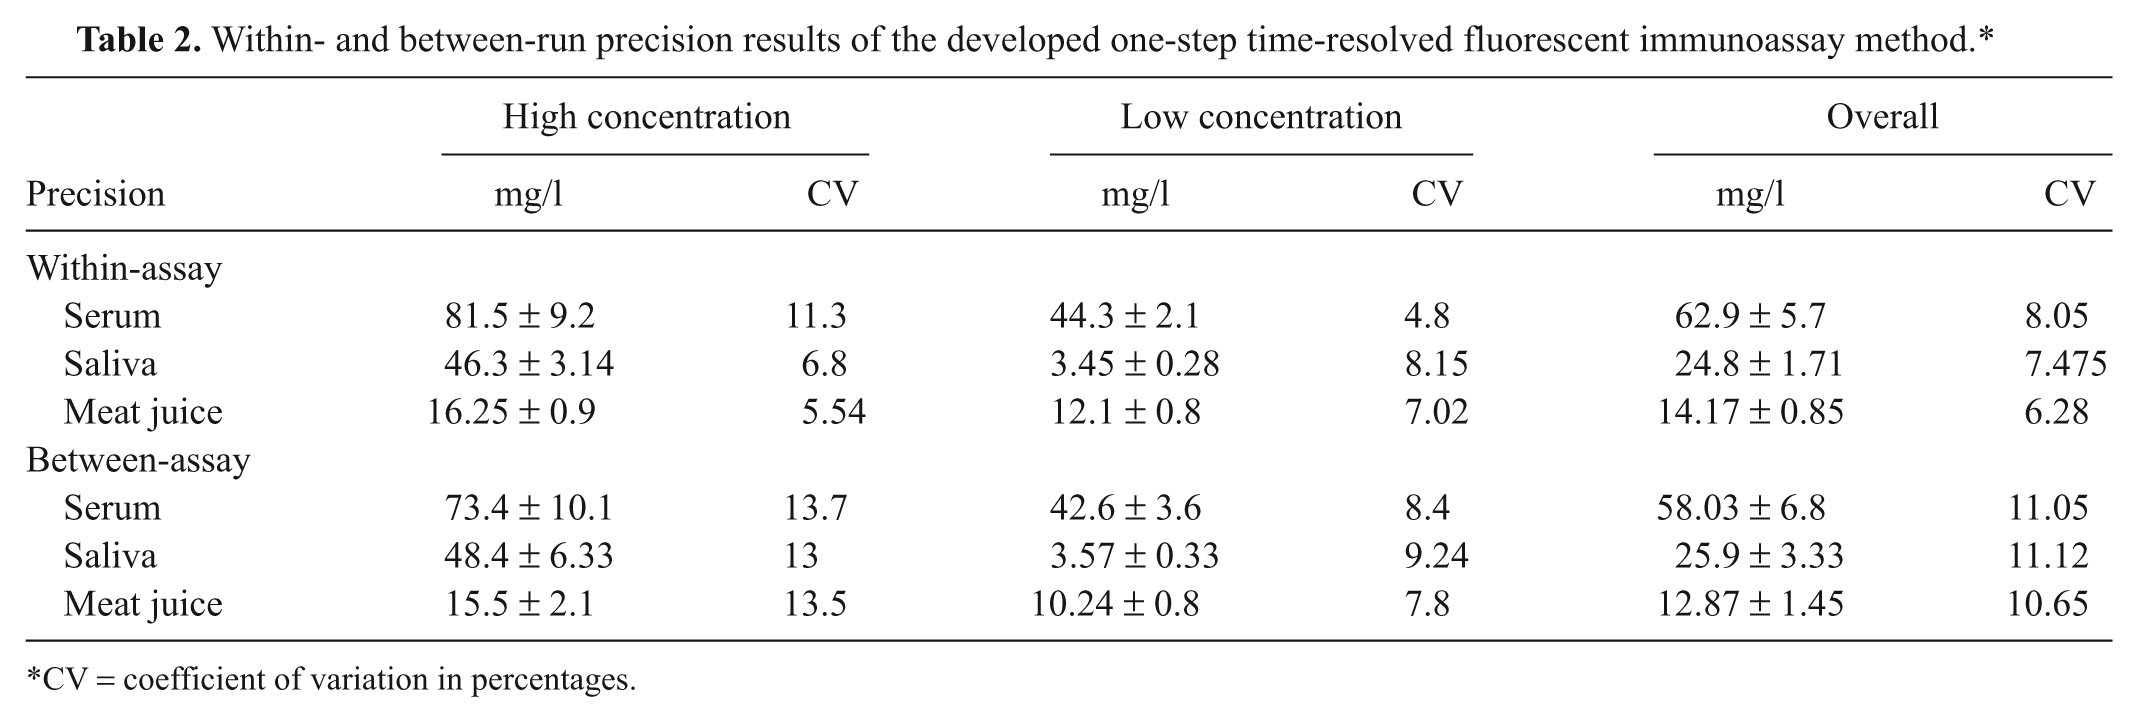
CV = coefficient of variation in percentages.
Accuracy
Results for serial dilution of pools with high and low SAA content yielded linear regression lines with coefficients of determination (r2) of 0.99 and 0.97 for serum samples, 0.98 and 0.93 for meat juice samples, and 0.98 for saliva samples, respectively.
Assay sensitivity
The analytical limit of detection of the one-step TR-FIA was 0.32 mg/l for serum samples, 0.28 mg/l for saliva samples, and 1.74 mg/l for meat juice samples. Limits of quantification estimated for each assay conditions are represented graphically in Figure 2. These values were taken as the maximum and minimum assay ranges. However, ULOQ for serum samples and LLOQ for meat juice samples could not be determined, since CVs were always lower than 20% at the concentrations investigated. In this case, the highest concentration tested was set as the upper limit of the assay range for serum samples and the analytical limit of detection (1.74 mg/l) calculated for meat juice was considered the lower limit of the assay range for this sample type.
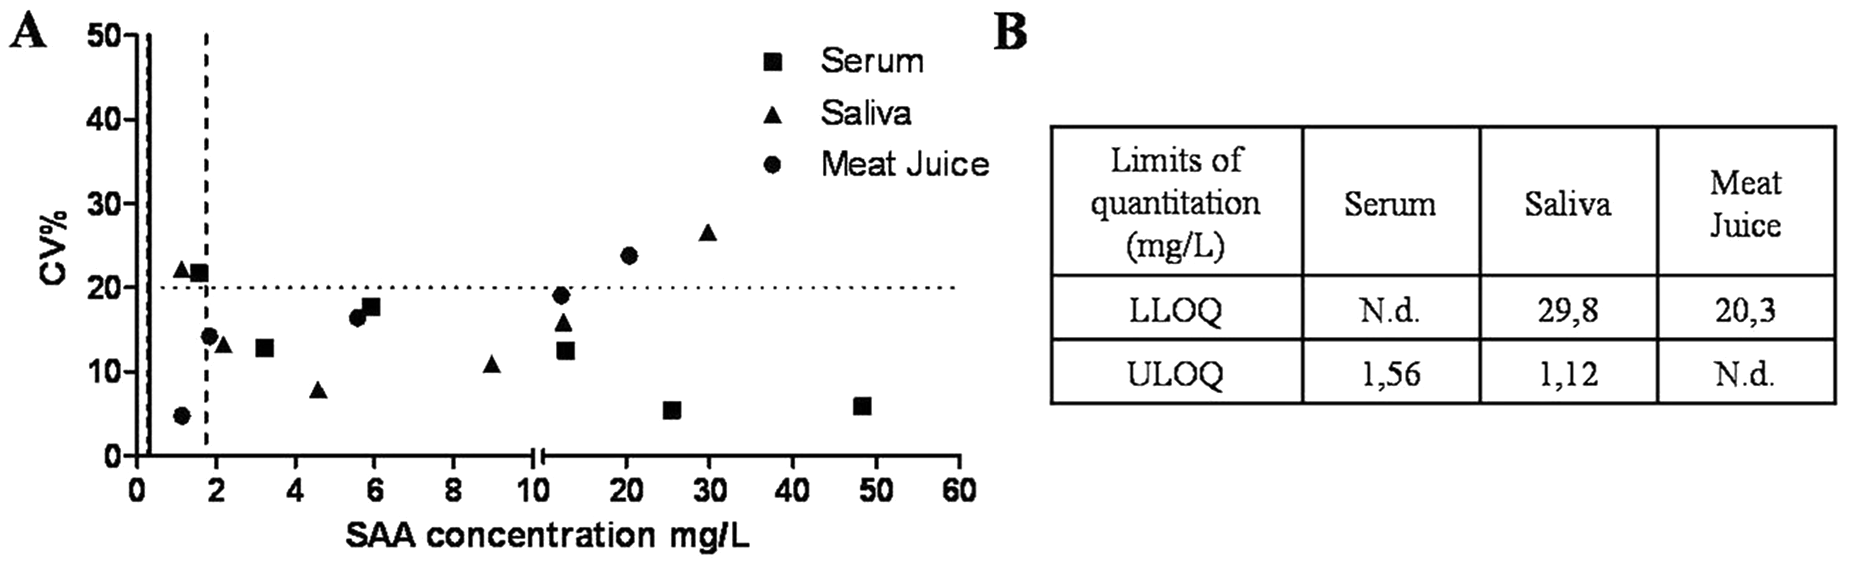
Limit of quantification profile of the time-resolved fluorescent immunoassay developed for serum amyloid A (SAA) measurement in serum, saliva, and meat juice samples showing SAA concentration in mg/l in the X-axis and coefficient of variation in % (CV%) in the Y-axis. Horizontal line indicates the highest CV% accepted (20%) for the limit of quantification determination; vertical lines indicate limit of detection for each fluid assay (0.32 mg/l for serum; 0.28 mg/l for saliva; 1.74 mg/l for meat juice). Lower and higher limit of quantification (ULOQ and LLOQ) are indicated for each assay.
Clinical validation
Results for the clinical validation of the TR-FIA in serum, saliva, and meat juice samples are represented in Figure 3. In serum samples, SAA median concentrations for healthy animals were 42.7 mg/l (38.6 and 45.6, 25th and 75th percentiles, respectively), while for diseased animals, median SAA concentrations were 58.7 mg/l (47.1 and 71.3, 25th and 75th percentiles, respectively). In saliva samples, SAA median concentrations for healthy animals were 11.5 mg/l (5.4 and 16.5, 25th and 75th percentiles, respectively), whereas median SAA concentrations for diseased animals were 51.2 mg/l (36.6 and 79.6, 25th and 75th percentiles, respectively). Median SAA concentrations in meat juice samples from control animals were 14.3 (12.6 and 15.8, 25th and 75th percentiles, respectively), while for diseased animals, were 20.18 (16.9 and 23.5, 25th and 75th percentiles, respectively). Statistically significant differences were found between healthy and diseased animals for all types of biological samples, with a level of significance of P = 0.0004 for serum samples and P < 0.0001 for saliva and meat juice samples, respectively.
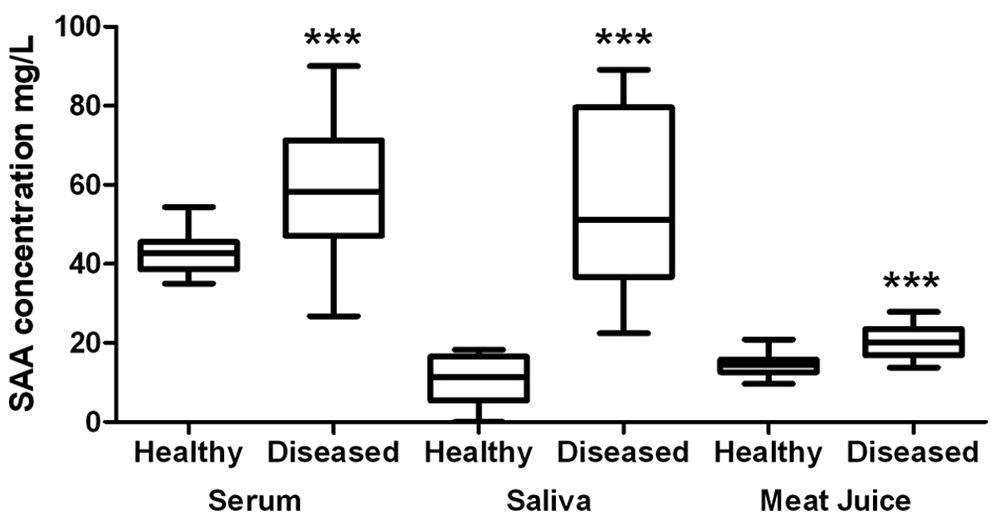
Serum amyloid A (SAA) concentration of healthy (n = 20) and diseased (n = 20) pigs determined with the time-resolved fluorescent immunoassay. SAA concentrations found in serum and saliva are expressed in the left axis and levels in meat juice in the right axis. The plot shows median (line within box), 25th and 75th percentiles (box), 1.5 times the interquartile distance (whiskers), and outliers (•). *** Level of significance P < 0.001.
Discussion
Serum amyloid A is considered a valuable serum disease marker in the pig.10,17 However, several authors have described problems in the technical aspects of porcine SAA determination, such as low analytical sensitivity that prevented accurate SAA determination in healthy animals 16 or unsatisfactory analytical performance. 18 These aspects have been overcome with a recently developed species-specific competitive ELISA, a technique that can be easily adapted to any laboratory worldwide. 16 However, by using TR-FIA technology, several advantages over ELISA could be achieved. TR-FIA offers a very high sensitivity and accuracy in comparison to ELISA, as well as a good stability of reagents, low background interferences, and wide test range. 11 Furthermore, this technology allows the reduction of assay steps and incubation times, with no influence on the analytical parameters. 4
In the present study, a precise and sensitive assay based on time-resolved fluorometry is described, which was useful not only to determine SAA content in serum, but also in alternative samples, such saliva and meat juice. All the reagents involved in the assay reaction were included in a single step, which diminished pipetting errors, and results for a 96-well plate were obtained within 55 min, far from the average 5 hr needed to perform any ELISA. As a result, the developed method could be easily included in routine analysis at the point of inspection.
The parameters of the developed method were optimized for each sample type to meet the best measurement conditions, and calibration was carried out by using standardized serum for SAA determination in serum samples and rSAA solution for saliva and meat juice samples. The choice of the calibrators was based on the assumption that standards and sample specimens must exhibit ideally the same molecular configuration, and their matrix should resemble sample matrix. 9 In the case of serum, it was easy to set a characterized standard serum as calibrator, as previously described, 16 but saliva and meat juice are relatively unstable specimen types and their difficult preservation does not allow setting them as calibrators. 5 Given that it cannot be assumed that SAA configuration was the same for each fluid, and the significant differences in sample matrix composition, a solution of porcine rSAA was finally chosen as the most suitable working standard for these assays.
The results obtained after the analytical validation of the assay showed the robustness of TR-FIA technology in terms of precision, accuracy, and sensitivity. The CVs of the TR-FIA were consistently lower than 14% for all the specimen types investigated. In the case of serum samples, the CVs obtained were lower than those obtained with the sandwich ELISA commercially available 18 and the competitive ELISA developed in the current authors’ laboratory. 16 To the authors’ knowledge, this is the first assay for SAA measurement in the pig that shows within- and between-run CVs lower than 15%, as recommended (U.S. Food and Drug Administration: 2001, Guidance for industry: bioanalytical method validation. U.S. Department of Health and Human Services, Rockville, MD. Available at: http://www.fda.gov/downloads/Drugs/GuidanceComplianceRegulatoryInformation/Guidances/ucm070107.pdf. Accessed April 25, 2011), indicating that this assay is the most repetitive assay reported to date for this analyte in this species. The high precision eliminates the need for performing duplicates and therefore reduces the amount of sample and reagents needed, and as a consequence, the total cost of the analysis (U.S. Food and Drug Administration: 2001, Guidance for industry).
The linearity-under-dilution assay showed that the method is highly accurate and able to determine linearly and proportionally the SAA content in any sample type. The analytical limit of detection was low enough to measure any SAA concentration in any of the fluids, and, furthermore, the limit of detection in serum was 10-fold lower than those found with other assays (3.3 and 3.06 mg/l, respectively, for sandwich ELISA 18 and competitive ELISA 16 ) demonstrating the high sensitivity of the assay.
SAA levels detected in serum, saliva, and meat juice by the TR-FIA were significantly different between healthy and diseased animals, indicating that this methodology could be employed as a tool for determining health status in swine in any of the samples investigated. This is, to the authors’ knowledge, the first report of porcine SAA determination in saliva and meat juice, and the results obtained in the present study indicate that these samples can be used alternatively to serum for SAA measurement with similar analytical performance.
Meat juice and saliva show several advantages over serum. Specifically, meat juice is the most efficient sample to collect at the point of inspection, as it does not cause any delay in the slaughter process, resulting in a valuable aid to determine health status at the abattoir. 6 On the other hand, measurement of SAA in saliva samples is an improvement in sampling mainly at the farm level, because its collection is a noninvasive method that can be performed with minimal training and causes minimal discomfort to the animal, allowing short-term repeated collections and welfare monitoring. 8 In addition, recent studies indicate that determination of acute phase markers (C-reactive protein and haptoglobin) in saliva is more efficient in determining health status than the determination of the same markers in serum, suggesting that saliva could be a more useful sample type than serum for diagnostic purposes. 7 Further studies with a larger population of animals is needed to establish the reference ranges of SAA in each specimen and to investigate the potential diagnostic use of SAA determination in different fluids to define health and welfare status at the herd level.
In summary, a new TR-RIA was developed in the current study by using highly specific reagents, resulting in a fast, sensitive, and robust method to determine SAA concentration in porcine samples. SAA was determined in serum, saliva, and meat juice samples with similar analytical and clinical performance, which allows the use of alternative samples to serum.
Footnotes
a.
Sodium pentobarbital, Dolethal, Vétoquinol, France.
b.
Vacutainer, BD, Franklin Lakes, NJ.
c.
Sarstedt AG & Co, Nümbrecht, Germany.
d.
Sulfo-NHS-Biotin, Pierce Biotechnology, Thermo Fisher Scientific, Rockford, IL.
e.
DELFIA Eu-labeling kit, PerkinElmer Life and Analytical Sciences, Wallac Oy, Turku, Finland.
f.
DELFIA assay buffer, PerkinElmer Life and Analytical Sciences, Wallac Oy, Turku, Finland.
g.
DELFIA streptavidin microtitration strips, PerkinElmer Life and Analytical Sciences, Wallac Oy, Turku, Finland.
h.
DELFIA/AutoDELFIA wash concentrate, PerkinElmer Life and Analytical Sciences, Wallac Oy, Turku, Finland.
i.
DELFIA enhancement solution, PerkinElmer Life and Analytical Sciences, Wallac Oy, Turku, Finland.
j.
Multilabel counter VICTOR21420, PerkinElmer Life and Analytical Sciences, Wallac Oy, Turku, Finland.
k.
Microsoft Excel 2000, Microsoft Corp, Redmond, WA.
l.
GraphPad Prism 5.0, GraphPad Software Inc., La Jolla, CA.
The author(s) declared no potential conflicts of interest with respect to the research, authorship, and/or publication of this article.
This whole study was financed by grant no. AGL 2009-0850A of the Ministry of Sciences and Innovation of Spain.