
Abstract
Bovine respiratory disease (BRD) is the most costly disease of beef cattle in North America. Because Pasteurella multocida is a commensal of the upper respiratory tract, it is generally considered an opportunistic pathogen. However, studies in swine indicated that there may be a limited number of strains associated with disease, suggesting that some are more virulent than others. Although this may also be true of isolates from cattle, appropriate typing methods must be established before this possibility can be investigated. The purpose of this study was to compare effectiveness of polymerase chain reaction (PCR) fingerprinting to more traditional approaches for typing bovine P. multocida isolates. Isolates were obtained from 41 cases of fatal BRD and subjected to random amplified polymorphic DNA PCR (RAPD-PCR), whole cell protein (WCP) profiles, outer membrane protein (OMP) profiles, and serotyping. The discrimination index was calculated for each typing method and combinations of each using Simpson's index of diversity. Correlation coefficients were calculated to assess concordance between classification results achieved through genotypic (RAPD-PCR) and phenotypic (WCP, OMP, and serotyping) approaches. All characterization methods were capable of discriminating between isolates. However, there was poor concordance between techniques. There were also few significant associations between typing results and epidemiologic data. Random amplified polymorphic DNA PCR was validated as being a repeatable and reliable means of discriminating between P. multocida isolates obtained from cattle. Isolates obtained from fatal cases of BRD in calves in a commercial feedlot demonstrated significant diversity, justifying additional investigation into whether P. multocida is a strictly opportunistic pathogen in cattle.
Introduction
Bovine respiratory disease (BRD) complex is the most costly disease of beef cattle in North America. 18 Although Mannheimia haemolytica is the most common bacterial isolate from BRD cases, 4,17 recent work has suggested that the proportion of fatal cases of respiratory disease in feedlot cattle attributable to Pasteurella multocida appears to be increasing. 28 Despite this shift, little research has been done to examine the role of P. multocida in BRD. In contrast, P. multocida isolates from other species (swine, poultry, and rabbits) have been relatively well characterized. 5,6,10,11,15,25 Pasteurella multocida is a commensal of the upper respiratory tract of cattle and thus is typically considered an opportunistic pathogen. However, studies in swine have suggested that there are a limited number of strains associated with disease, with these strains clearly transmitted horizontally. 3,4,9 These strains of P. multocida may therefore be more pathogenic than others. Similar strain differences may also exist in cattle and could correlate with unidentified virulence factors. This contention is supported by the finding that multilocus sequence analysis, outer membrane protein (OMP) characterization, ribotyping, and serogrouping all found limited diversity among isolates of P. multocida from bovine pneumonia, even when those isolates were from diverse geographic regions. 9,12 However, consistent, reliable, and practical typing methods need to be validated before this possibility can be examined.
Polymerase chain reaction (PCR) fingerprinting has been employed by numerous researchers for swine, poultry, and rabbit isolates of P. multocida. 6,7,14,15,25 Nonetheless, it has not been validated in bovine isolates. The purpose of the current study was to compare the effectiveness of PCR fingerprinting at typing P. multocida isolates from cases of bovine pneumonia to more traditional approaches, including characterization of whole cell protein (WCP) profiles, OMP profiles, and serotyping. It was hypothesized that PCR fingerprinting using micro- and minisatellite primers would permit repeatable discernment among isolates of P. multocida associated with BRD. Given the multifactorial nature of BRD and the heterogeneity of cattle shipped to feedlots, it was further hypothesized that P. multocida isolates associated with BRD would consist of a diverse population of strains. This would be consistent with the widely held view of P. multocida as an opportunistic pathogen.
Materials and methods
Cattle
All calves at a commercial feedlot between March 2002 and March 2003 that died from fatal fibrinous pleuropneumonia were necropsied. Tissues were submitted to the Oklahoma Animal Disease Diagnostic Laboratory (Still-water, Oklahoma) for bacteriologic, virologic, and histo-pathologic examination. Data available for these cattle included date of arrival at the feedlot, whether the animal was treated, and date of death.
Bacterial strains and growth conditions
Tissues were processed, and bacterial isolates were characterized as described previously. 16 Following culture and identification, all isolates were stored at −80°C in 30% (v/v) glycerol in brain heart infusion (BHI) broth. Forty-one P. multocida isolates were recovered from stock cultures and were streaked onto growth agar (BHI agar containing 5% [v/v] defibrinated sheep's blood) for aerobic overnight incubation at 37°C.
DNA isolation and PCR analyses
Overnight seed cultures were used to inoculate BHI broth, which was grown to midlogarithmic phase (OD600 of 0.5-0.6) at 37°C with shaking. Approximately 4 1-ml aliquots from each isolate were centrifuged at 13,500 X g for 5 min to pellet the cells. The DNA was extracted using a commercial kit a according to the manufacturer's instructions. The DNA was rehydrated with 10 mM Tris-HCl (pH 8.0) and examined on a 1% agarose gel to confirm quality and purity of genomic DNA. All high-quality DNA samples were quantified spectrophotometrically b and diluted in 10 mM Tris to a final concentration of approximately 20 ng/μl. These were stored at −20°C until used for PCR.
Three primers were used for PCR, 2 that detect minisatellite DNA sequences (M13 core: 5′-GAGGGTG-GCGGTTCT-3′ and modified M13 core: 5′-GAGGGTG-GNGGNTCT-3′) and 1 that detects microsatellite sequences ([GTG] 5 ). The oligonucleotide primers were obtained from a commercial source. c A unique master mix and time-temperature PCR protocol was made for each primer and optimized for maximum discernment of banding patterns and reproducibility. Each master mix was made as a 2X solution and then diluted with sterile water for a final volume of 100 μl per reaction. Final component concentrations were 1X commercial PCR buffer (20 mM Tris-HCl, pH 8.4, 50 mM KCl), 0.2 mM of each deoxyribonucleotide triphosphate, 1 μM primer, 2.5 U Taq, and 40 ng template DNA. Magnesium concentration was 3.5 mM for M13 core, 3 mM for modified M13 core, and 2.5 mM for (GTG)5. All protocols were initiated with a denaturation at 95°C for 3 min, followed by 30 amplification cycles, and concluding with a 7-min extension at 72°C. Each amplification cycle included an initial 30-sec denaturation step at 95°C followed by a 58-sec annealing stage and then a 70-sec extension stage at 72°C. Annealing temperature varied for each primer: 44°C for M13 core, 43°C for modified M13 core, and 42°C for (GTG)5.
The PCR products were subjected to horizontal electrophoresis at 65 volts in 1.5% agarose gel made in Tris-acetate-ethylenediamine tetra-acetic acid with incorporation of 0.5 μg/ml of ethidium bromide. Gels were destained in double-distilled (dd)H2O for 2 to 6 hr after electrophoresis. Digital photographs were taken of each gel under ultraviolet light, and images were imported into a computer software program. d The software was used to crop the image, subtract background, and filter artifacts from the image. Lanes were framed, and software was used to detect bands. Sensitivity was adjusted for each gel, and each lane was manually curated as needed to ensure consistency across gels. All positions were identified where at least one band was present in any lane. Each sample was examined for presence and/or absence of a band (regardless of intensity) at this location. This was recorded as binary data (band present = 1, absent = 0). Most samples were analyzed using multiple gels. In these cases, each gel was examined for confirmation that banding patterns were identical for a given sample on all gels.
Sodium dodecyl sulfate-polyacrylamide gel electrophoresis of WCP and OMP
Five milliliters of overnight growth in BHI broth were used for WCP collection. Cells were collected through centrifugation (13,500 X g for 5 min), resuspended in a small volume of phosphate buffered saline (PBS), mixed with an equal volume of 2X sodium dodecyl sulfate (SDS)-bromophenol sample buffer, and boiled for 5 min. Forty microliters of combined solution per lane was used in SDS-polyacrylamide gel electrophoresis (PAGE).
The OMP were extracted following envelope preparation via sonication and centrifugation to separate nonlysed cells. The sarcosyl insoluble method, which is based on the differential solubility of cytoplasmic and outer membranes in N-lauryl sarcosine, was used. 8 Briefly, this involved disruption of cells followed by cell envelope isolation through solubilization in a N-2-hydroxyethylpiperazine-N-2-ethanesulfonic acid (HEPES)-sucrose solution subjected to centrifugation (5,850 X g, 4°C for 20 min). The supernatant was then ultracentrifuged (280,000 X g, 4°C for 70 min) to pellet membranes, which were washed by 3 additional ultracentrifugation cycles in ddH2O. The envelope material was then incubated in N-lauryl sarcosine for 45 min and subjected to ultracentrifugation (280,000 X g, 4°C for 70 min). The remaining pellet was again washed and ultracentrifuged 3 times in ddH2O. The outer membrane proteins were then resuspended in a minimum amount of ddH2O and stored at −80°C. Protein concentration was determined by the modified Lowry technique, using a commercial kit. e Samples were adjusted to a final protein concentration of 2 μg/μl and mixed with an equal volume of 2x SDS-bromophenol sample buffer and boiled for 5 min. Five micrograms of each sample was then used for SDS-PAGE.
Whole cell protein and OMP were analyzed by SDS-PAGE (4.5% stacking, 12.5% separating gel) using the discontinuous buffer system of Laemmli. For visualization of protein bands, gels were stained with Coomassie Brilliant Blue. f Gels were briefly destained in a solution containing 50% methanol and 10% acetic acid and then assessed visually. Samples deemed similar were rerun together to permit comparison on the same gel.
Serotyping
Somatic antigen serotyping was performed by the U.S. Department of Agriculture National Veterinary Services Laboratory, as previously described, 20 using agar gel diffusion of chicken antisera against the 16 serotypes.
Data interpretation and statistical analysis
Samples for which all results were not available were excluded from all analyses. This resulted in inclusion of 41 isolates. For PCR primers, commercial software g was used to calculate Dice's coefficient of similarity (S) and the resulting distance (Di, where Di = 1 − S) for all pairwise comparisons of binary data. The software was then used to create an unweighted pair group method using arithmetic averages (UPGMA) dendrogram from the distance coefficients. This resulted in a unique dendrogram for each primer. Dendrograms were used to create groupings based upon a 92.5% cluster-difference cutoff value.
The groups resulting from visual assessment of OMP and WCP profiles, as well as the serotype results and PCR dendrograms (Fig. 1), were used to assess the effectiveness of the various typing approaches. This was done by use of Simpson's index of diversity, 27 which estimates the discriminatory ability of typing systems (i.e., how effective is a typing method at distinguishing between unrelated strains) by calculating the discrimination index, D. This value reflects the probability that 2 unrelated strains randomly selected from the test population would fall into different typing groups. A D-value ≥0.9 has been deemed as necessary for confidence in typing results. 21 Because no typing method achieved this threshold, results obtained from genotypic techniques (PCR) were combined in 2- and 3-way cross-tabulations (Table 1). This subdivided large groups into multiple smaller types, increasing discrimination power. Results from phenotypic characterization (WCP, OMP, and serotyping) techniques were similarly combined. Confidence intervals were calculated 19 for each value of D, permitting objective comparison between the discriminatory power of various typing methods (Table 2). Adjusted Rand and Wallace coefficients were calculated as described previously 23 to measure agreement between typing methods. The adjusted Rand coefficient calculation assesses the overall concordance of 2 methods while taking into account that those partitions could arise by chance alone. Values generally range from 0 (no better agreement than expected by chance) to 1 (perfect concordance). The Wallace coefficient calculates the ability to predict the results generated from a dataset by a typing method, given the results from the same dataset analyzed by a second typing method. Potential values range from 0 (no ability to predict) to 1 (perfect predictive ability). Simpson's index, and confidence intervals and similarity coefficients, were calculated by software available online (http://www.comparingpartitions.info).
Groupings produced by RAPD-PCR, WCP, OMP, and serotyping were compared with available epidemiologic data for cattle from which samples were collected. Data available included date of arrival (28/41 samples), number of times treated for BRD (41 samples), number of days from onset of disease until death (41 samples), and other bacteria isolated from the calf (41 samples; Table 3). These variables were converted to categorical or ordinal data, and commercial software g was used to create contingency tables and calculate contingency coefficients between each grouping and each epidemiologic variable. Association was considered significant at P < 0.05.
Results
Complete results of histopathology and microbiologic isolation have been reported previously. 16 Pasteurella multocida was cultured from samples obtained from 54 calves (24.5%). Frozen stock from 41 of these isolates was retrieved and used for the present study. All 3 primers successfully amplified variable DNA fragments from all 41 isolates (100% typeability). These products varied with altered PCR substituents and conditions but were repeatable under identical conditions. Complexity of banding ranged from a low of 12 bands (M13 core) to a high of 18 bands ([GTG]5 and modified M13 core). Whole cell protein and OMP profiles also yielded 100% type-ability. The WCP electrophoresis resulted in very complex banding patterns, with 25 to 30 bands being individually identifiable between 25 and 150 kilodaltons. Proteins smaller than 20 kilodaltons were smeared and therefore not used in analysis. The OMP gels were less complex, featuring 10 to 15 bands varying from 29 to 115 kilodaltons. Two samples were nontypeable using serotyping (95% typeability). Eighteen samples belonged to only serotype 3. The remainder of the isolates cross-reacted with sera, indicative of multiple serotypes (Table 1).
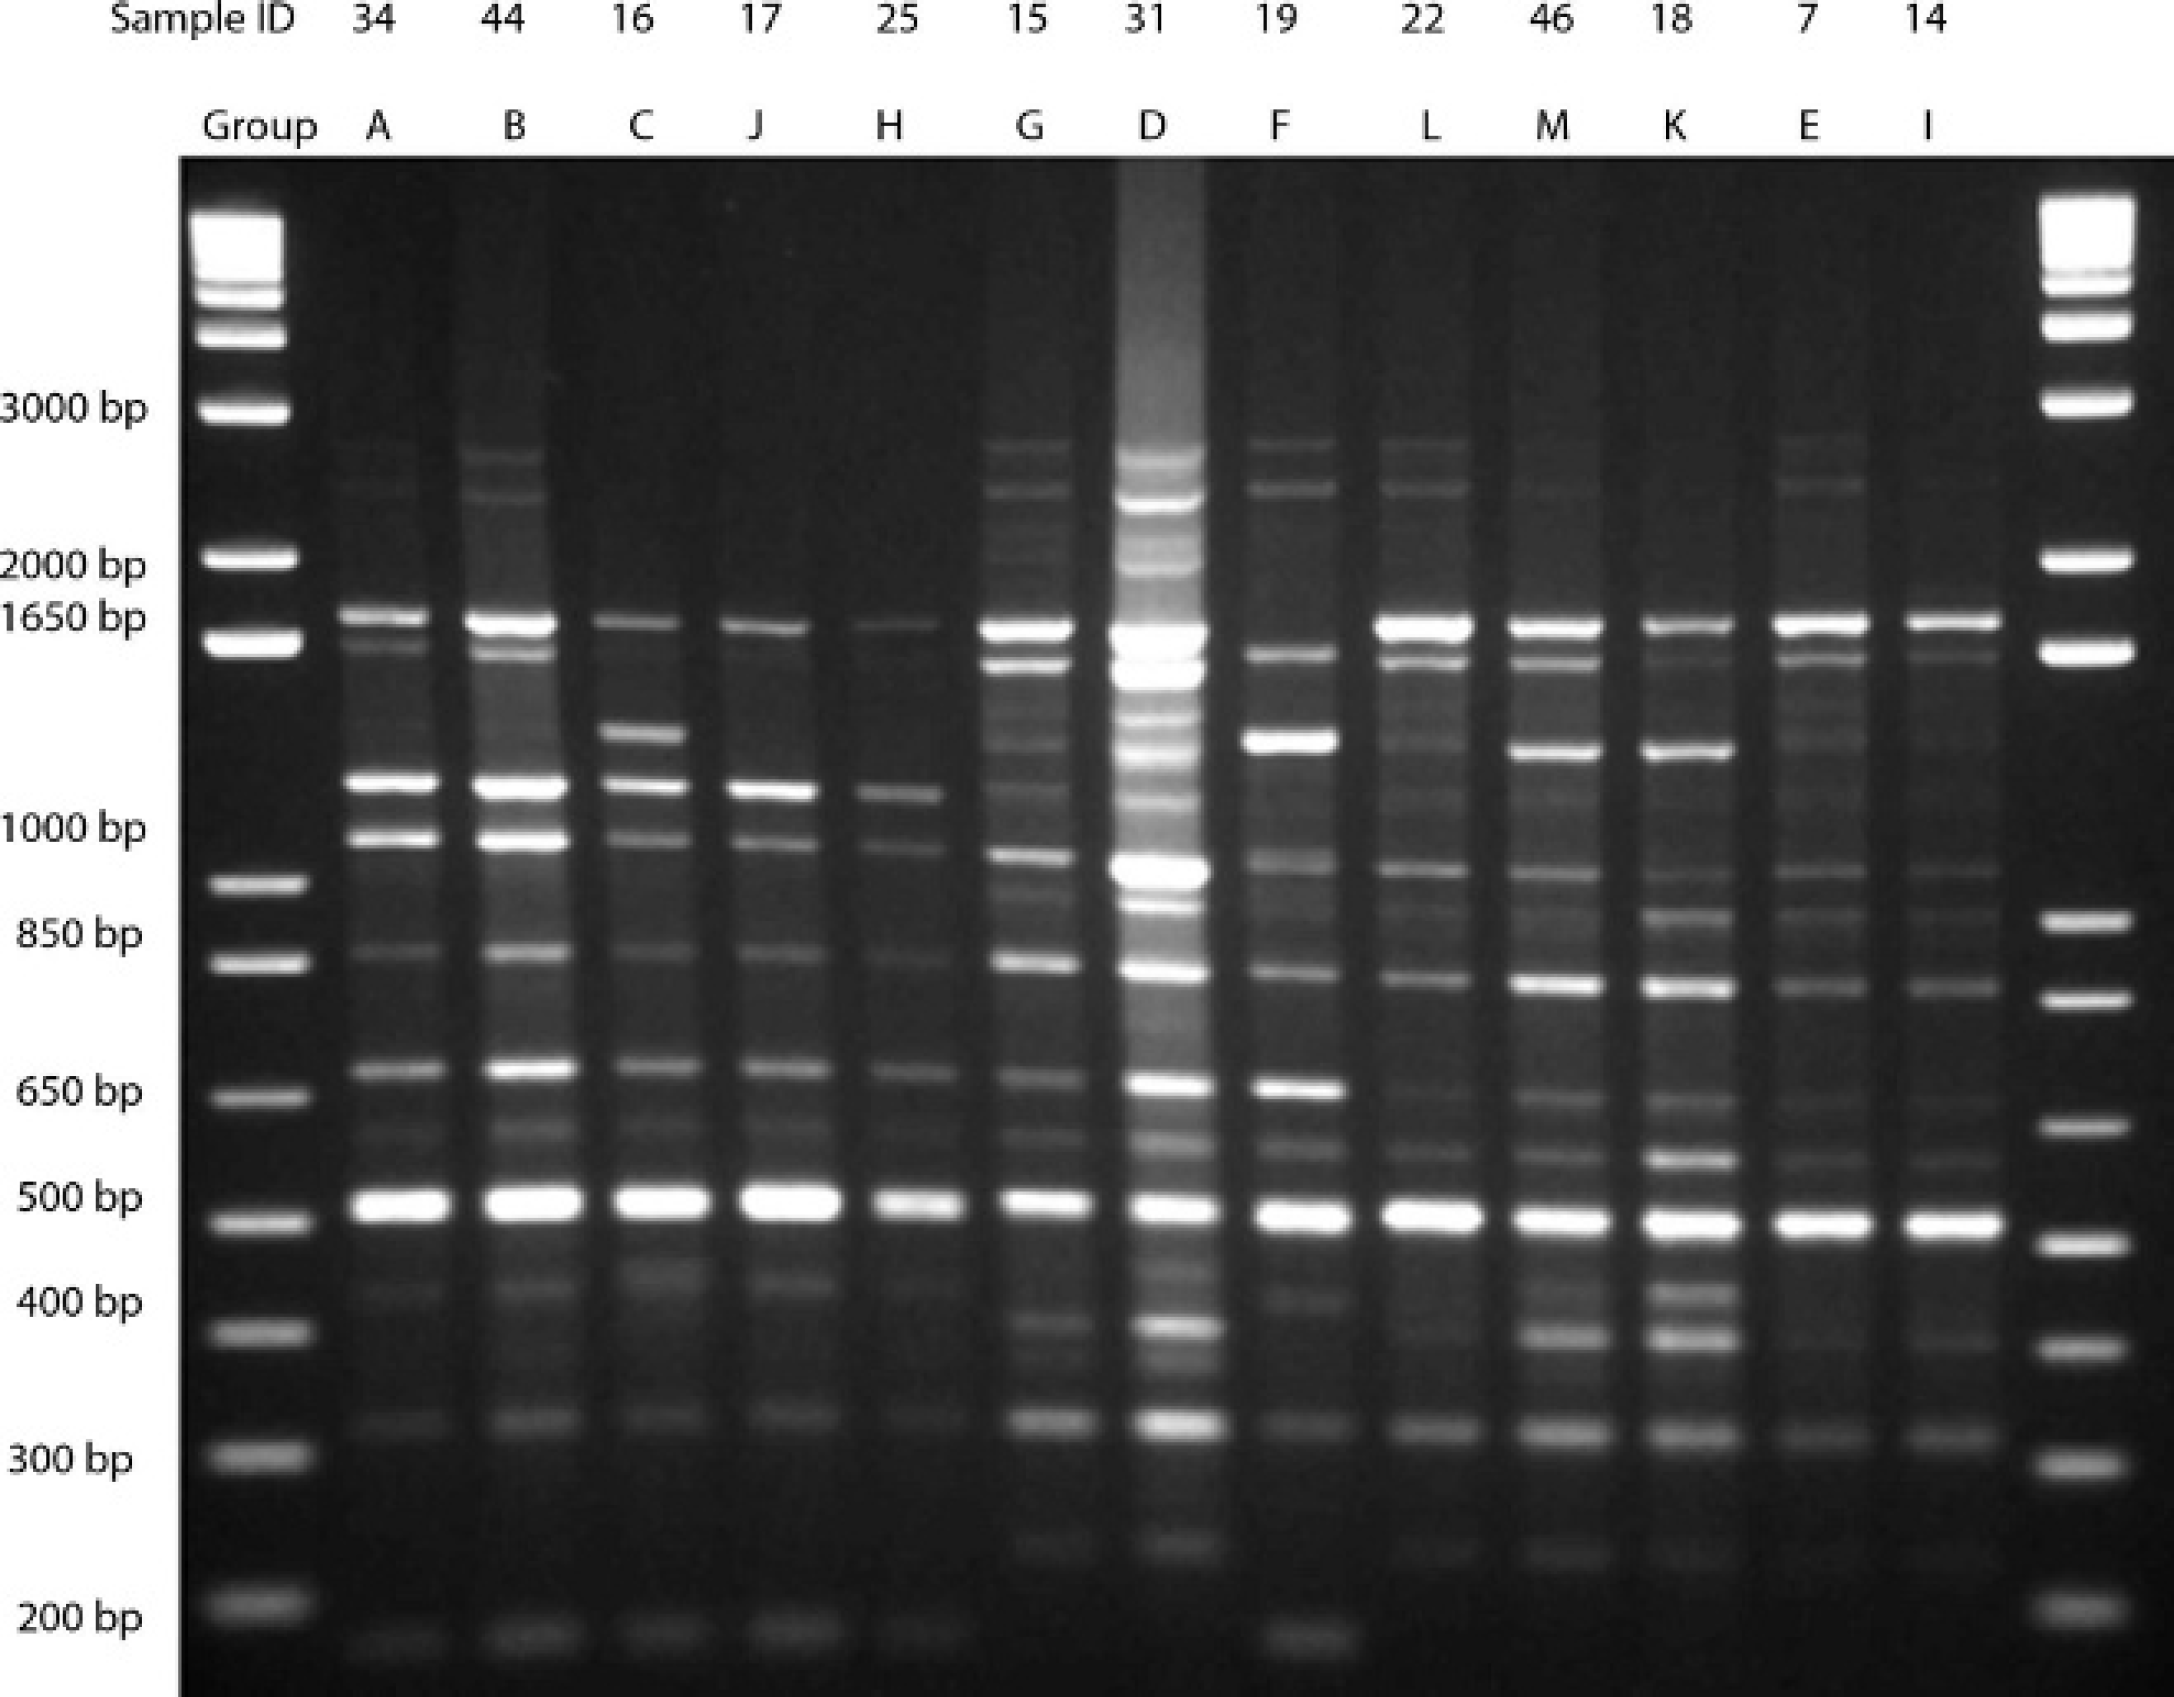
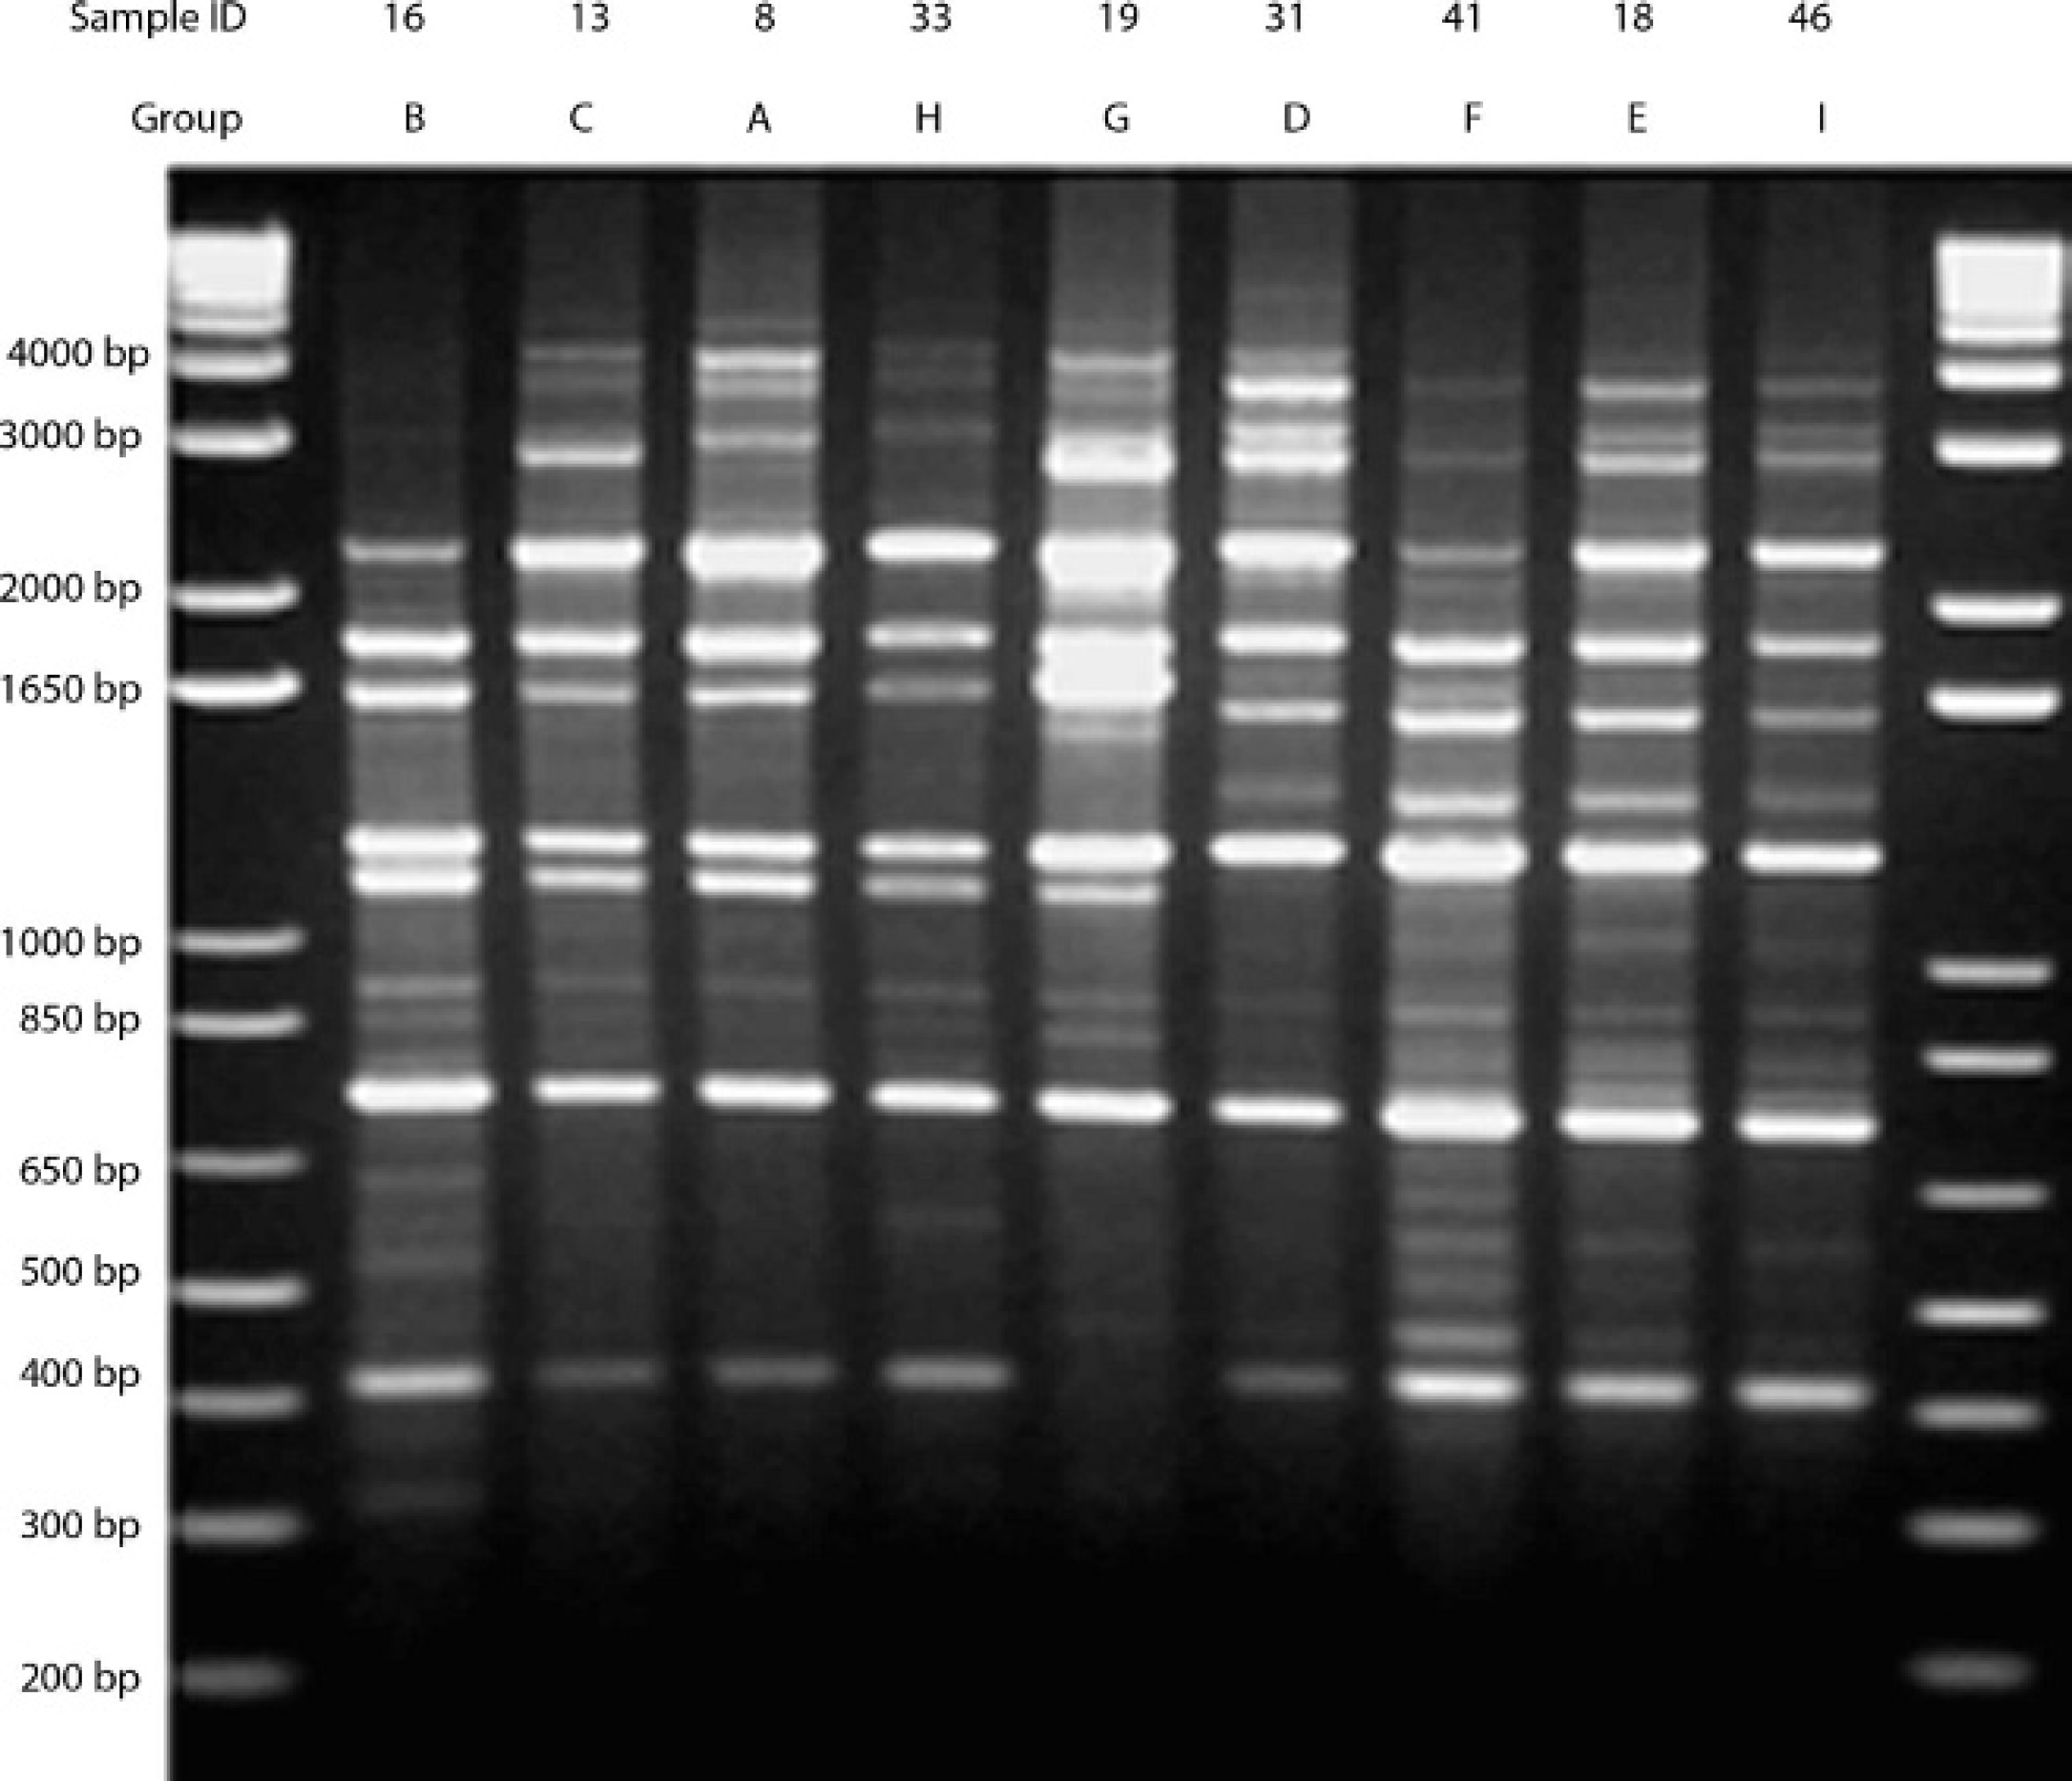
The M13 core and modified M13 core minisatellites yielded 13 groups each (Figs. 2, 3), whereas the (GTG) 5 microsatellite yielded 9 groups (Fig. 4). The largest group generated by the M13 core primer included 13 isolates (32%), and the largest group from modified core and (GTG)5 primers contained 14 (34%) isolates each. Serotyping resulted in only 5 groups, with the largest group containing 18 samples (44%). The WCP produced 14 groups (Fig. 5), with the largest group containing 12 samples (29%). The OMP had 12 groups (Fig. 6), with the largest containing 8 samples (20%).
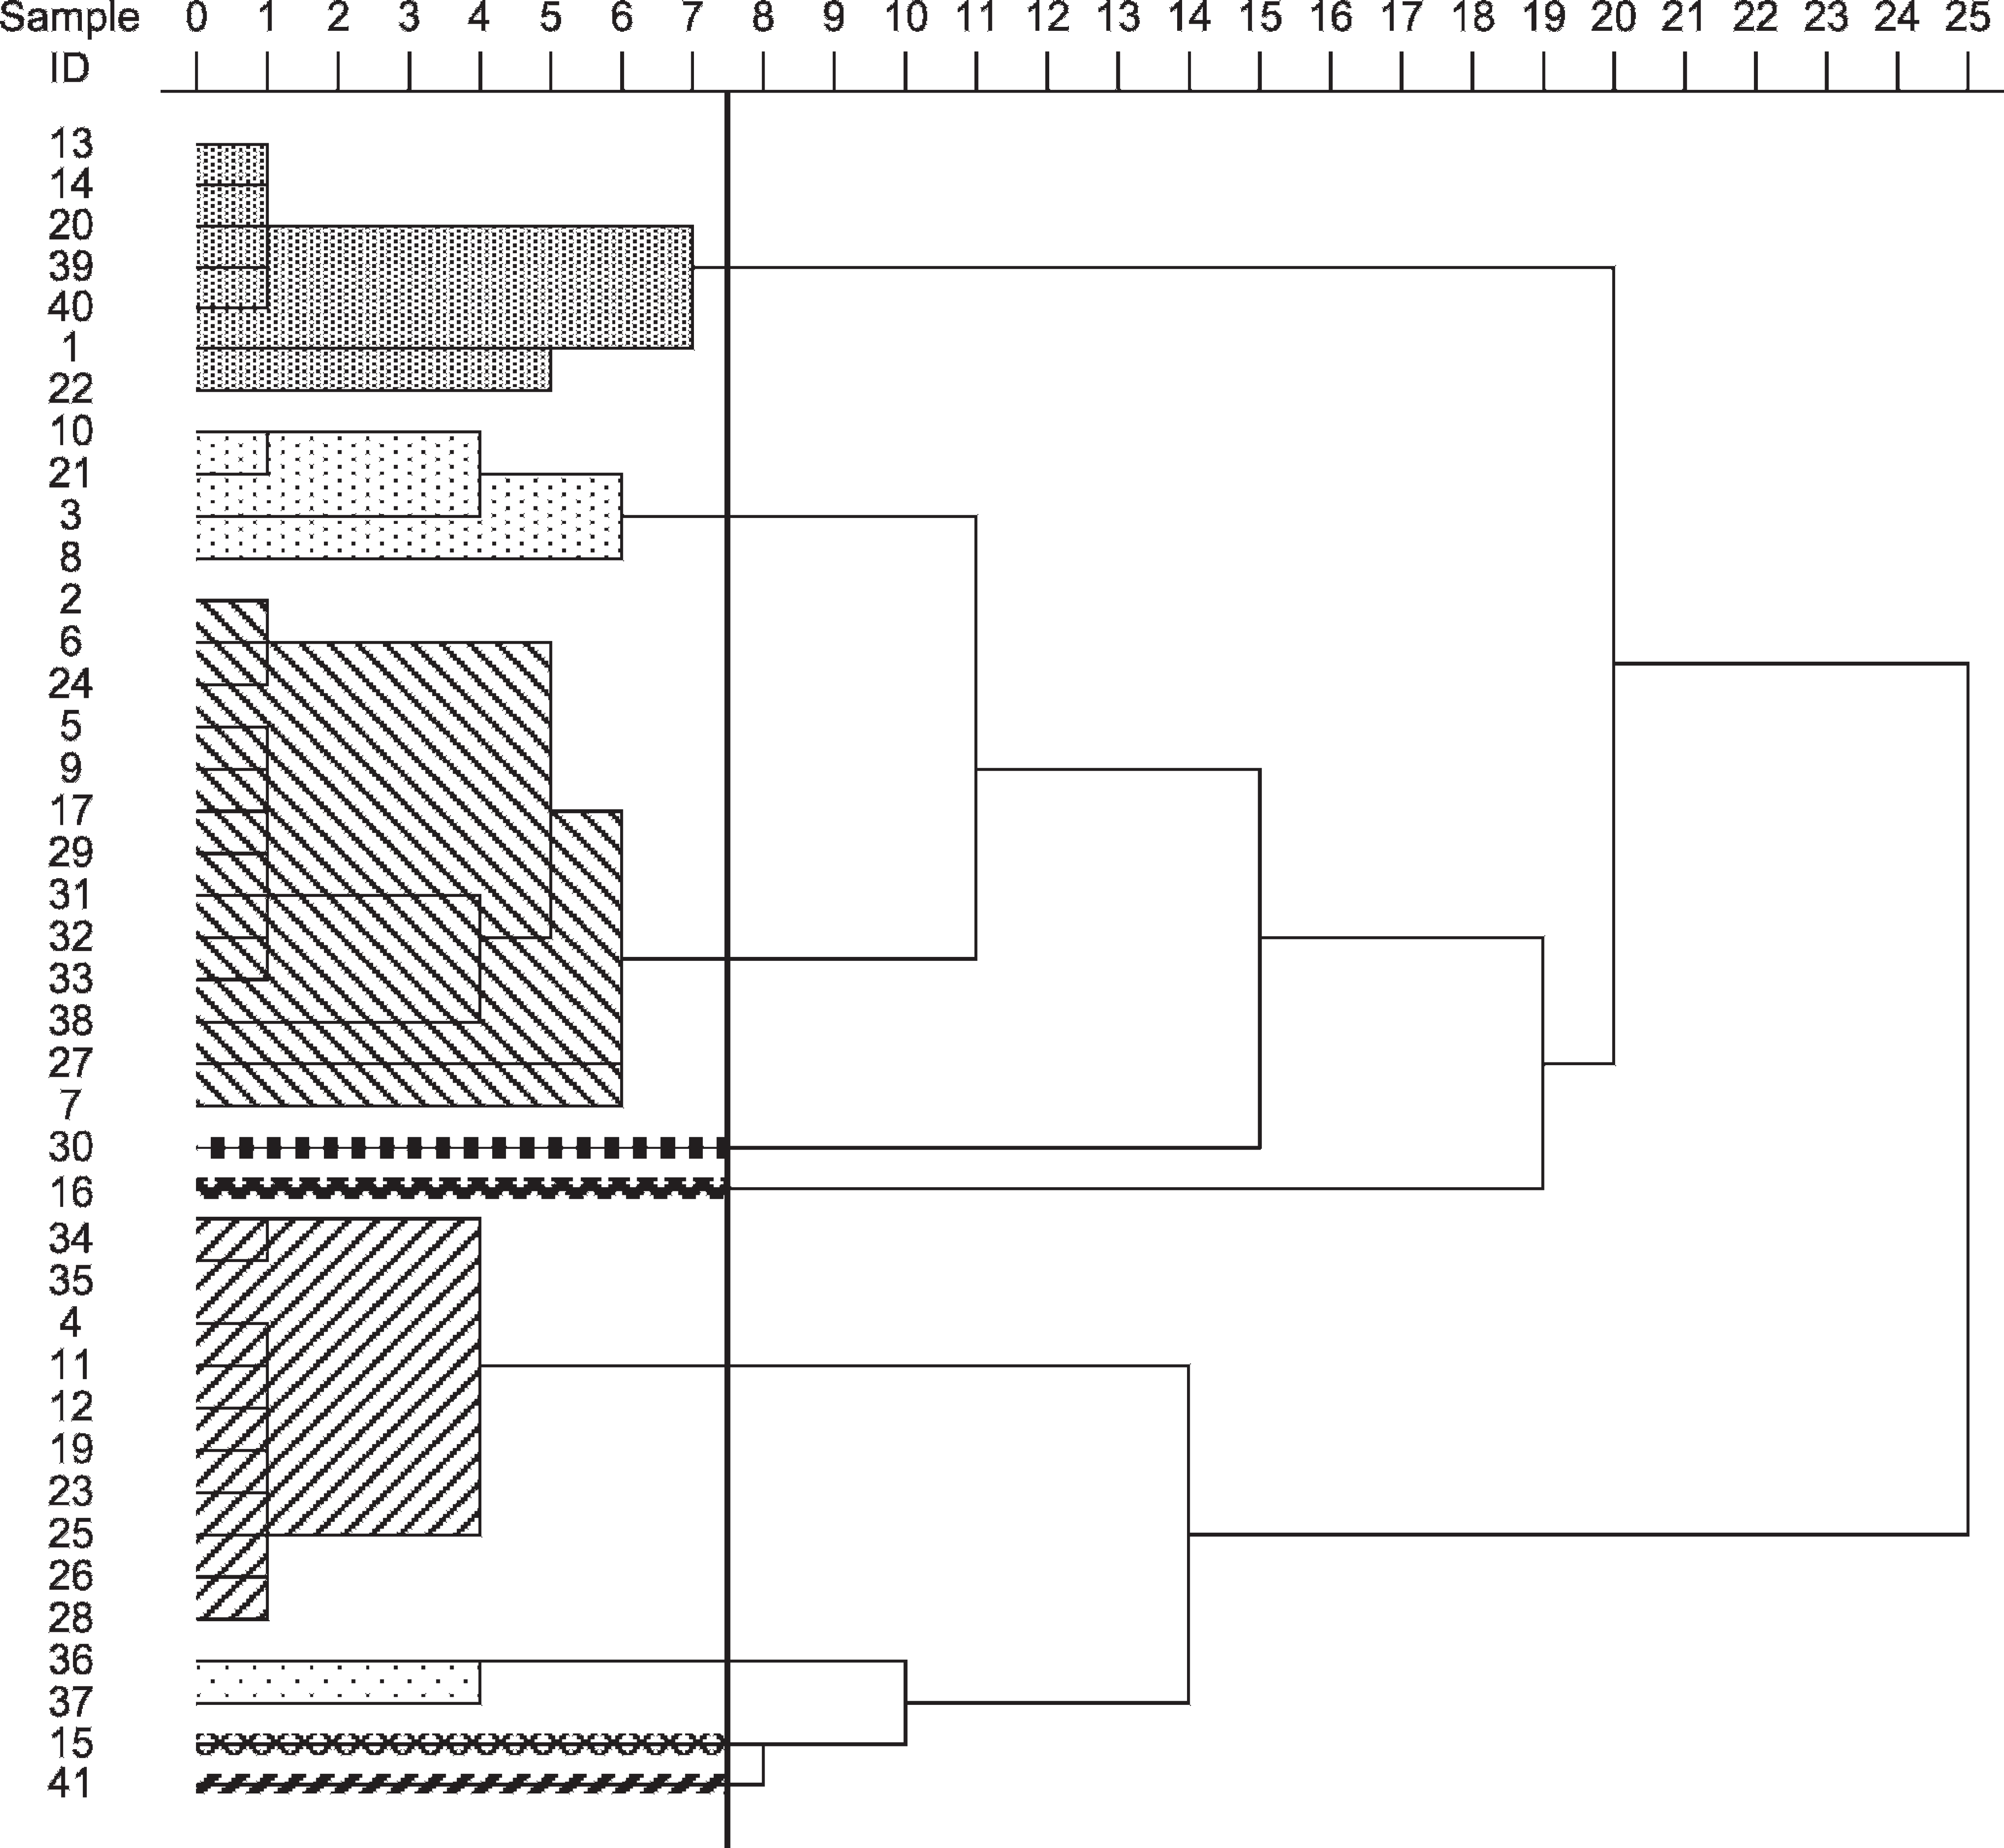
Dendrogram reflecting purported relationship between samples, as determined by (GTG)5 primer. The figure was generated by SPSS g using the unweighted pair group method and the arithmetic averages approach. The left column is the sample ID. The row at the top indicates the percent dissimilarity. The vertical line indicates 92.5% combined cluster similarity. The markings indicate groupings established by a 92.5% cutoff: top cluster is group B; second from top is group C; third is group A; fourth is group H; fifth is group G; sixth is group D; seventh is group F; eighth is group E; bottom cluster is group I.
When considered alone, the characterization techniques produced a D value ranging from 0.68 (serotyping) to 0.89 (WCP and OMP; Table 2). As expected, combinations of results produced more groups and improved D value. All 2-way combinations yielded a D >0.9. Combining the results from all 3 PCR primers resulted in 34 groups and a D value of 0.99 (95% confidence interval [CI]: 0.98-1.00%). Combining results from all 3 phenotypic techniques produced 31 groups and a D value of 0.98 (95% CI: 0.95-1.00%). Values of D may be improved by recognition of additional groups but are also dependent upon the size of the groups created. For example, WCP and OMP both produced a D value of 0.89, despite creating differing numbers of groups (14 and 12, respectively). This is because WCP resulted in 1 very large group (12 samples), whereas OMP produced fewer groups of more equal size.
Classification results of all samples by various typing techniques.*
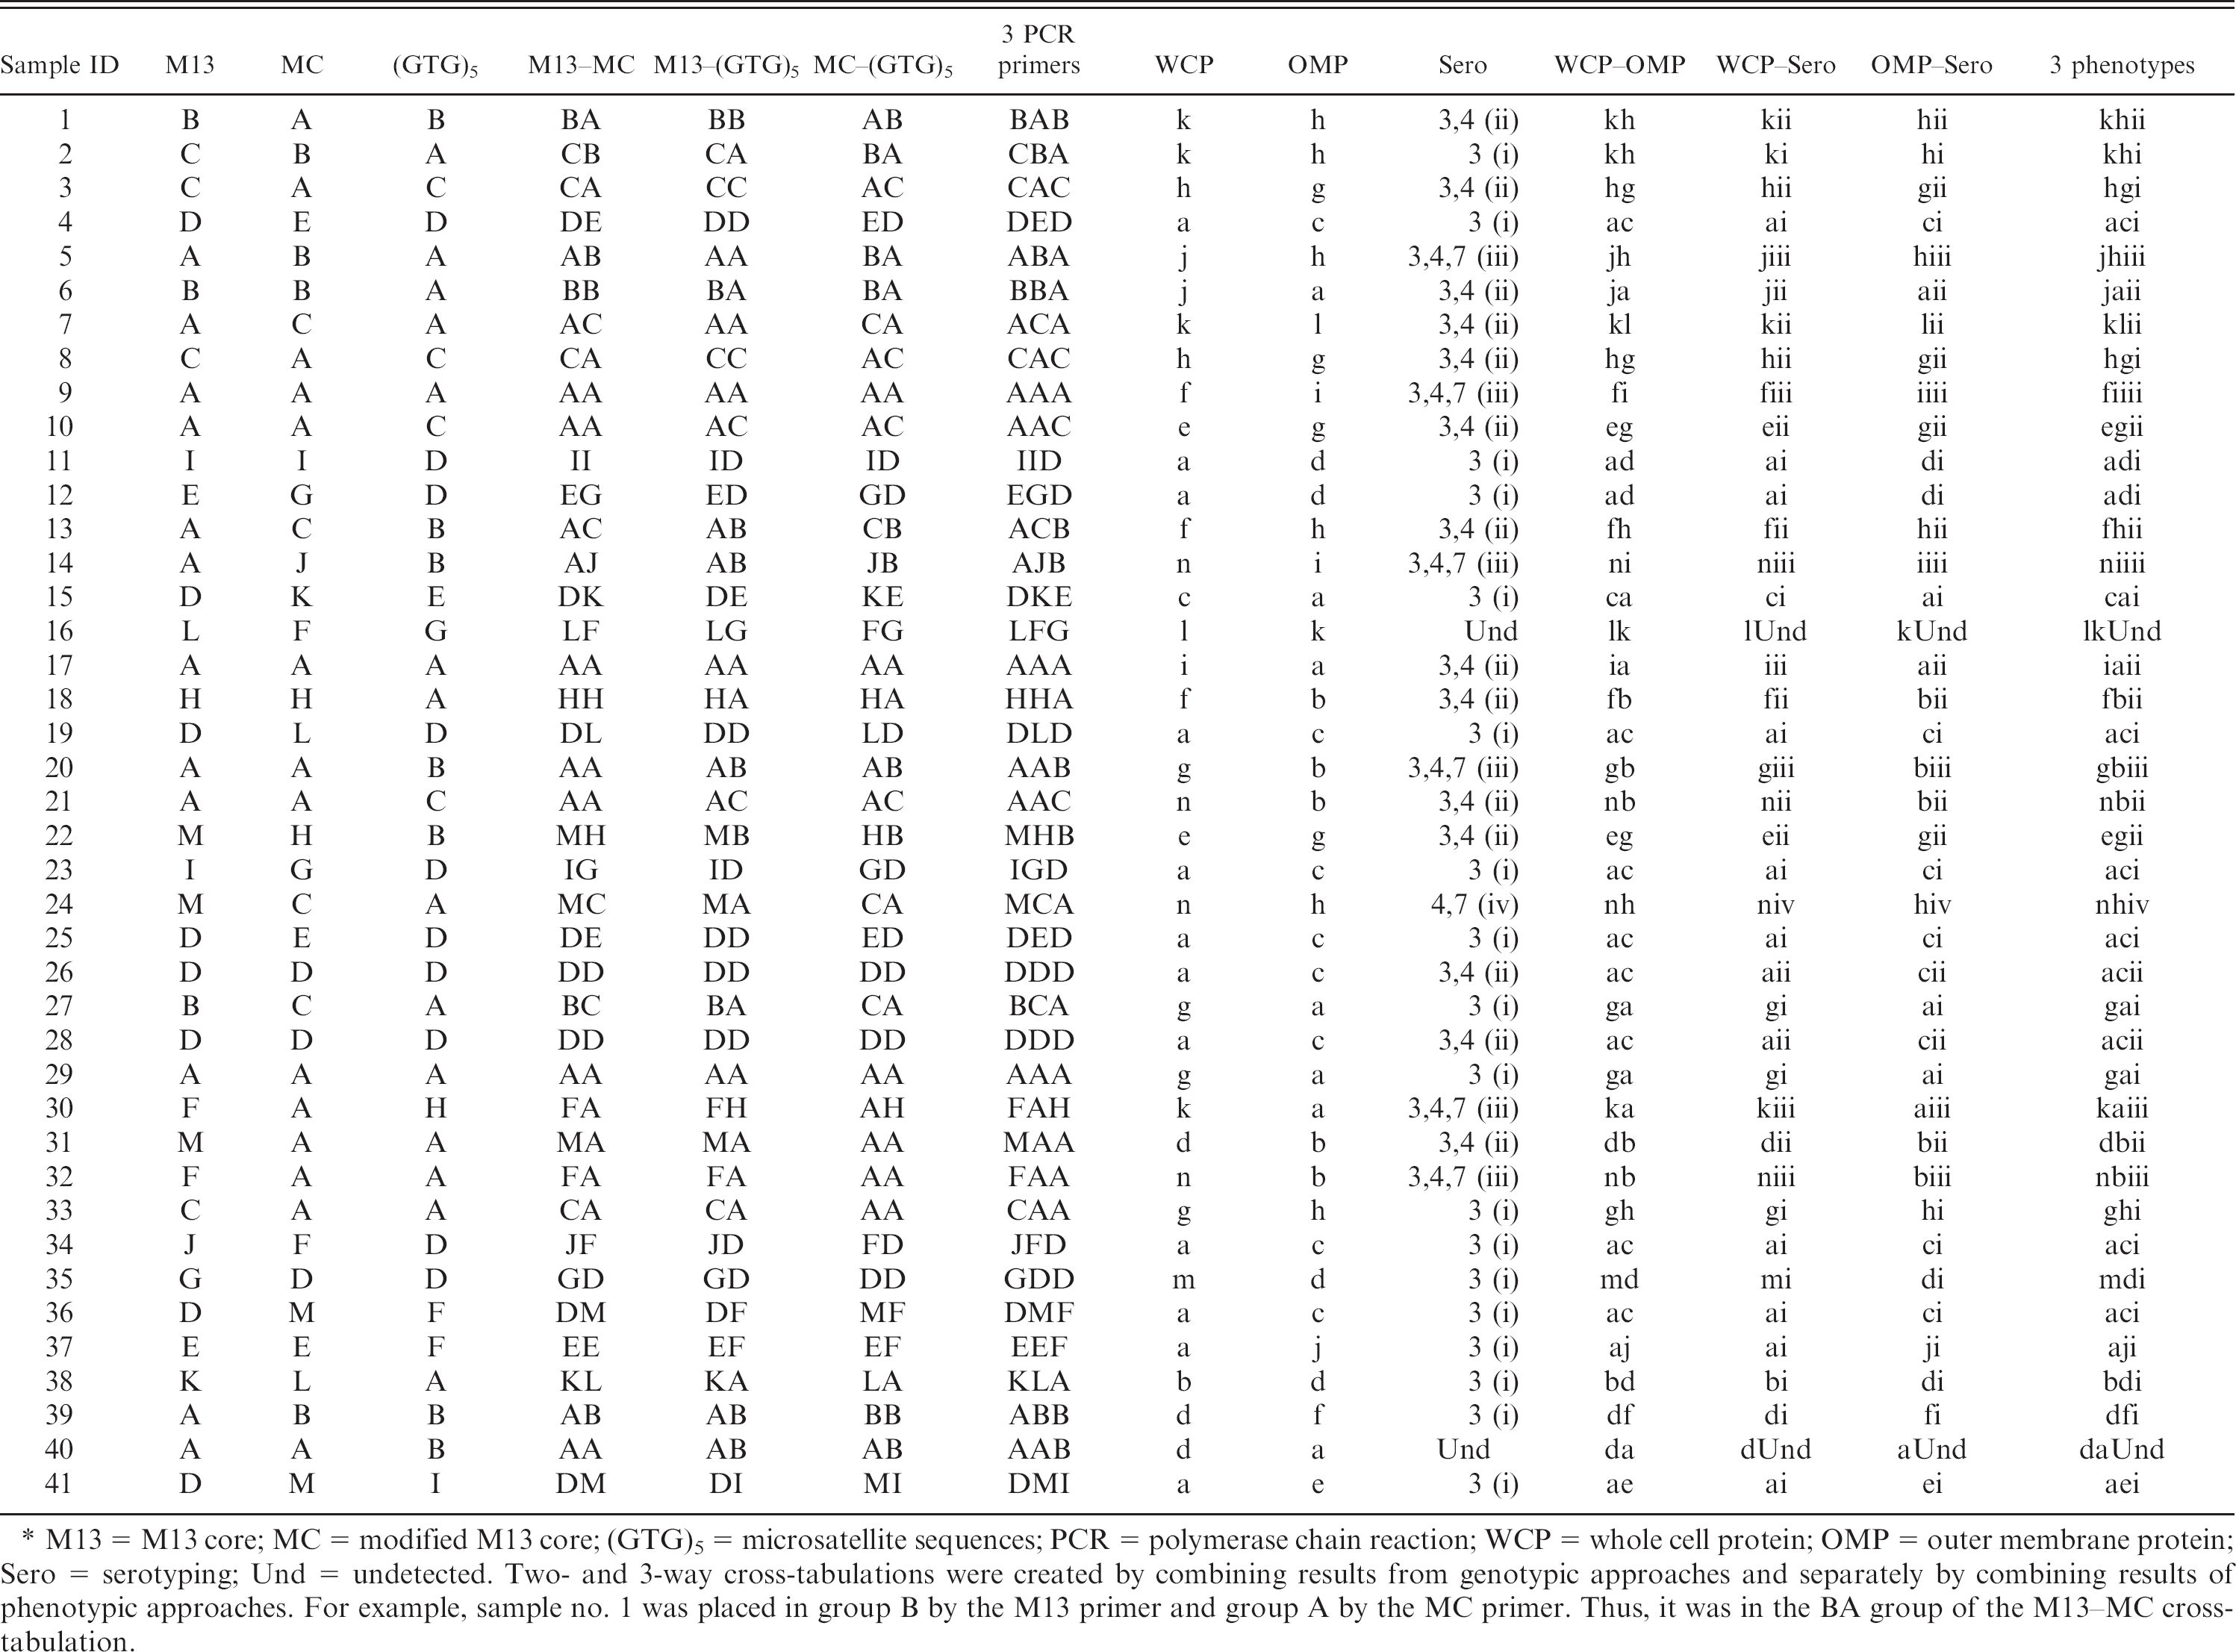
M13 = M13 core; MC = modified M13 core; (GTG)5 = microsatellite sequences; PCR = polymerase chain reaction; WCP = whole cell protein; OMP = outer membrane protein; Sero = serotyping; Und = undetected. Two- and 3-way cross-tabulations were created by combining results from genotypic approaches and separately by combining results of phenotypic approaches. For example, sample no. 1 was placed in group B by the M13 primer and group A by the MC primer. Thus, it was in the BA group of the M13-MC cross-tabulation.
Comparison of number of groups formed by characterization technique.*
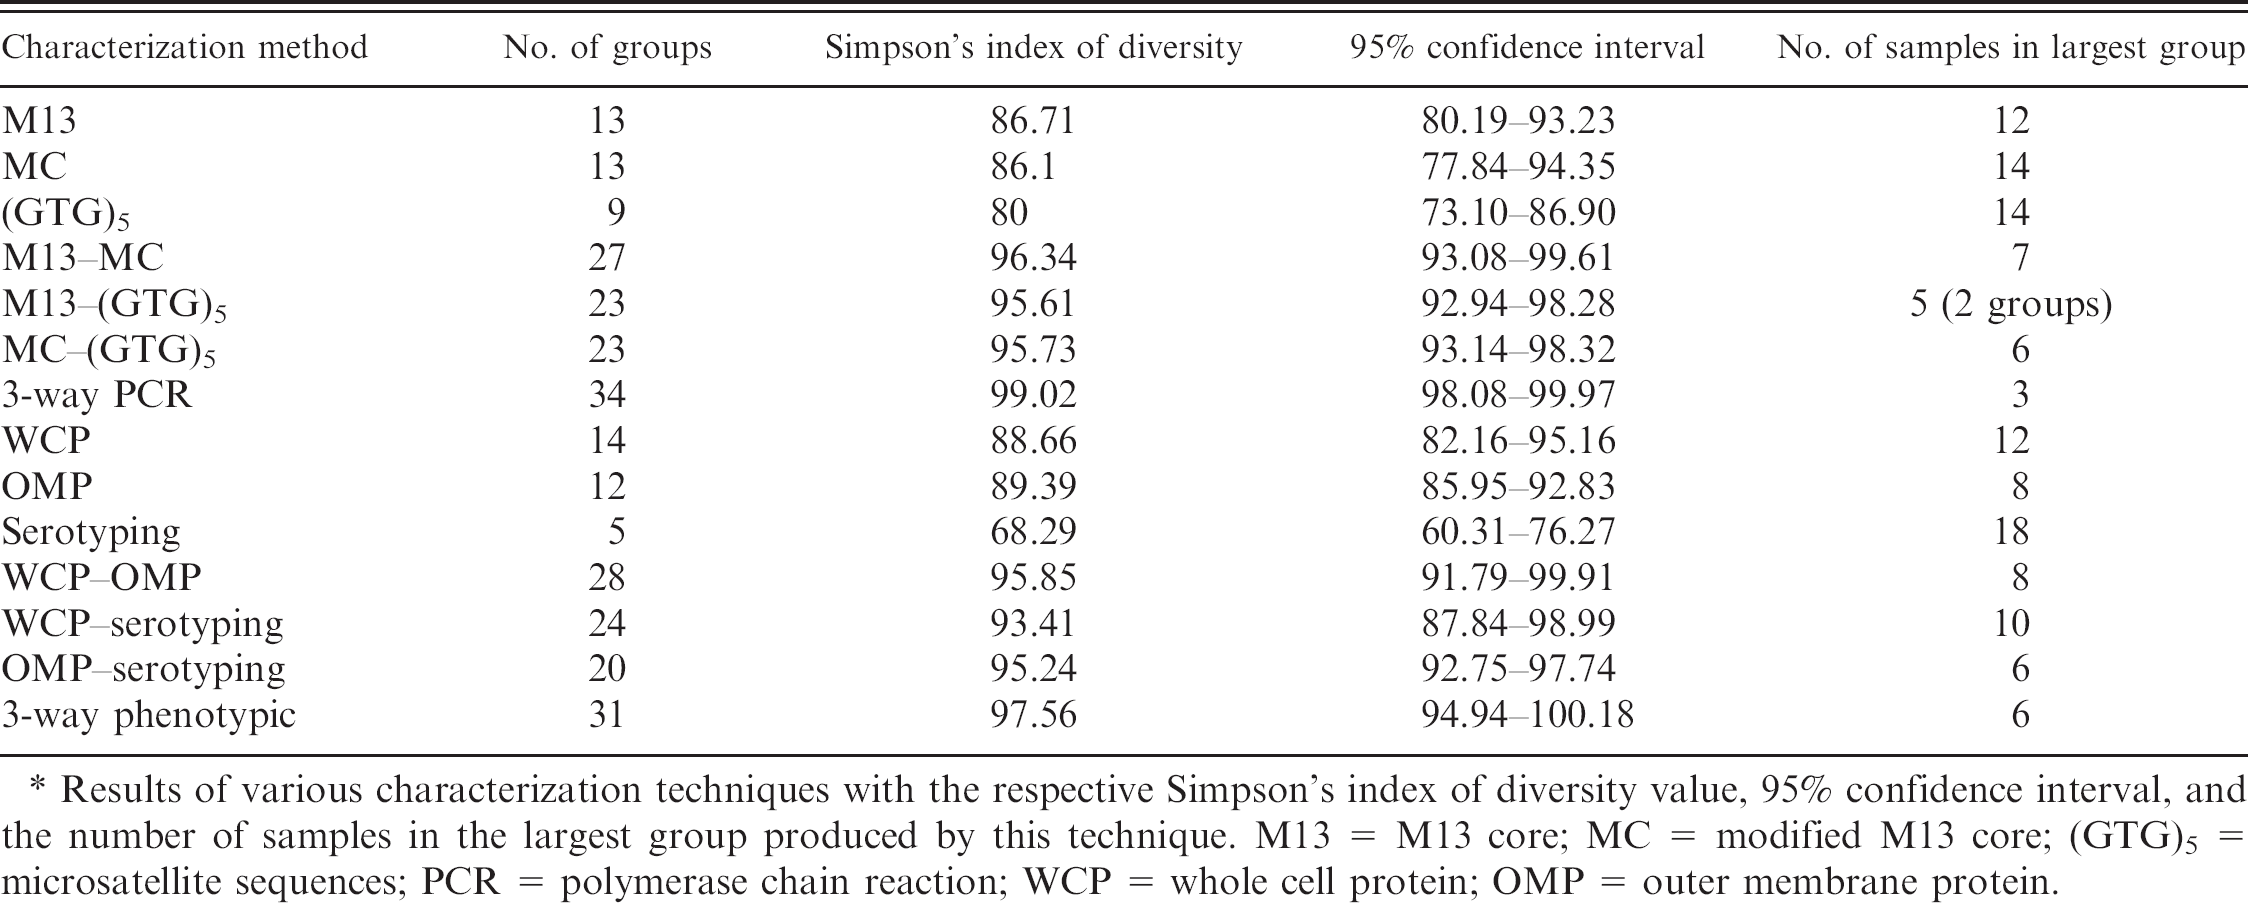
Results of various characterization techniques with the respective Simpson's index of diversity value, 95% confidence interval, and the number of samples in the largest group produced by this technique. M13 = M13 core; MC = modified M13 core; (GTG)5 = microsatellite sequences; PCR = polymerase chain reaction; WCP = whole cell protein; OMP = outer membrane protein.
The adjusted Rand coefficient showed poor correlation between the various genotypic and phenotypic characterization approaches (data not shown). Comparing the results of the 3-way cross-tabulation results from RAPD-PCR with those of the 3-way cross-tabulation of WCP-OMP-serotyping yielded a low adjusted Rand value (0.203). The highest correlation was found between the combined results of M13-(GTG)5 and OMP-WCP. Of the individual primers, (GTG)5 had the best overall correlation with phenotypic techniques, whereas the modified core primer had the worst. Of the phenotypic approaches, OMP had the best overall correlation with PCR results, but many of these were <0.10. There was also poor correlation between results from various primers, as well as between the phenotypic techniques. As expected, highest correlation values were found when comparing a method to a conjugation of itself with another method; even in these circumstances correlation values rarely exceeded 0.6, with the highest being 0.73 (WCP-OMP and 3-way phenotypic cross-tabulations).
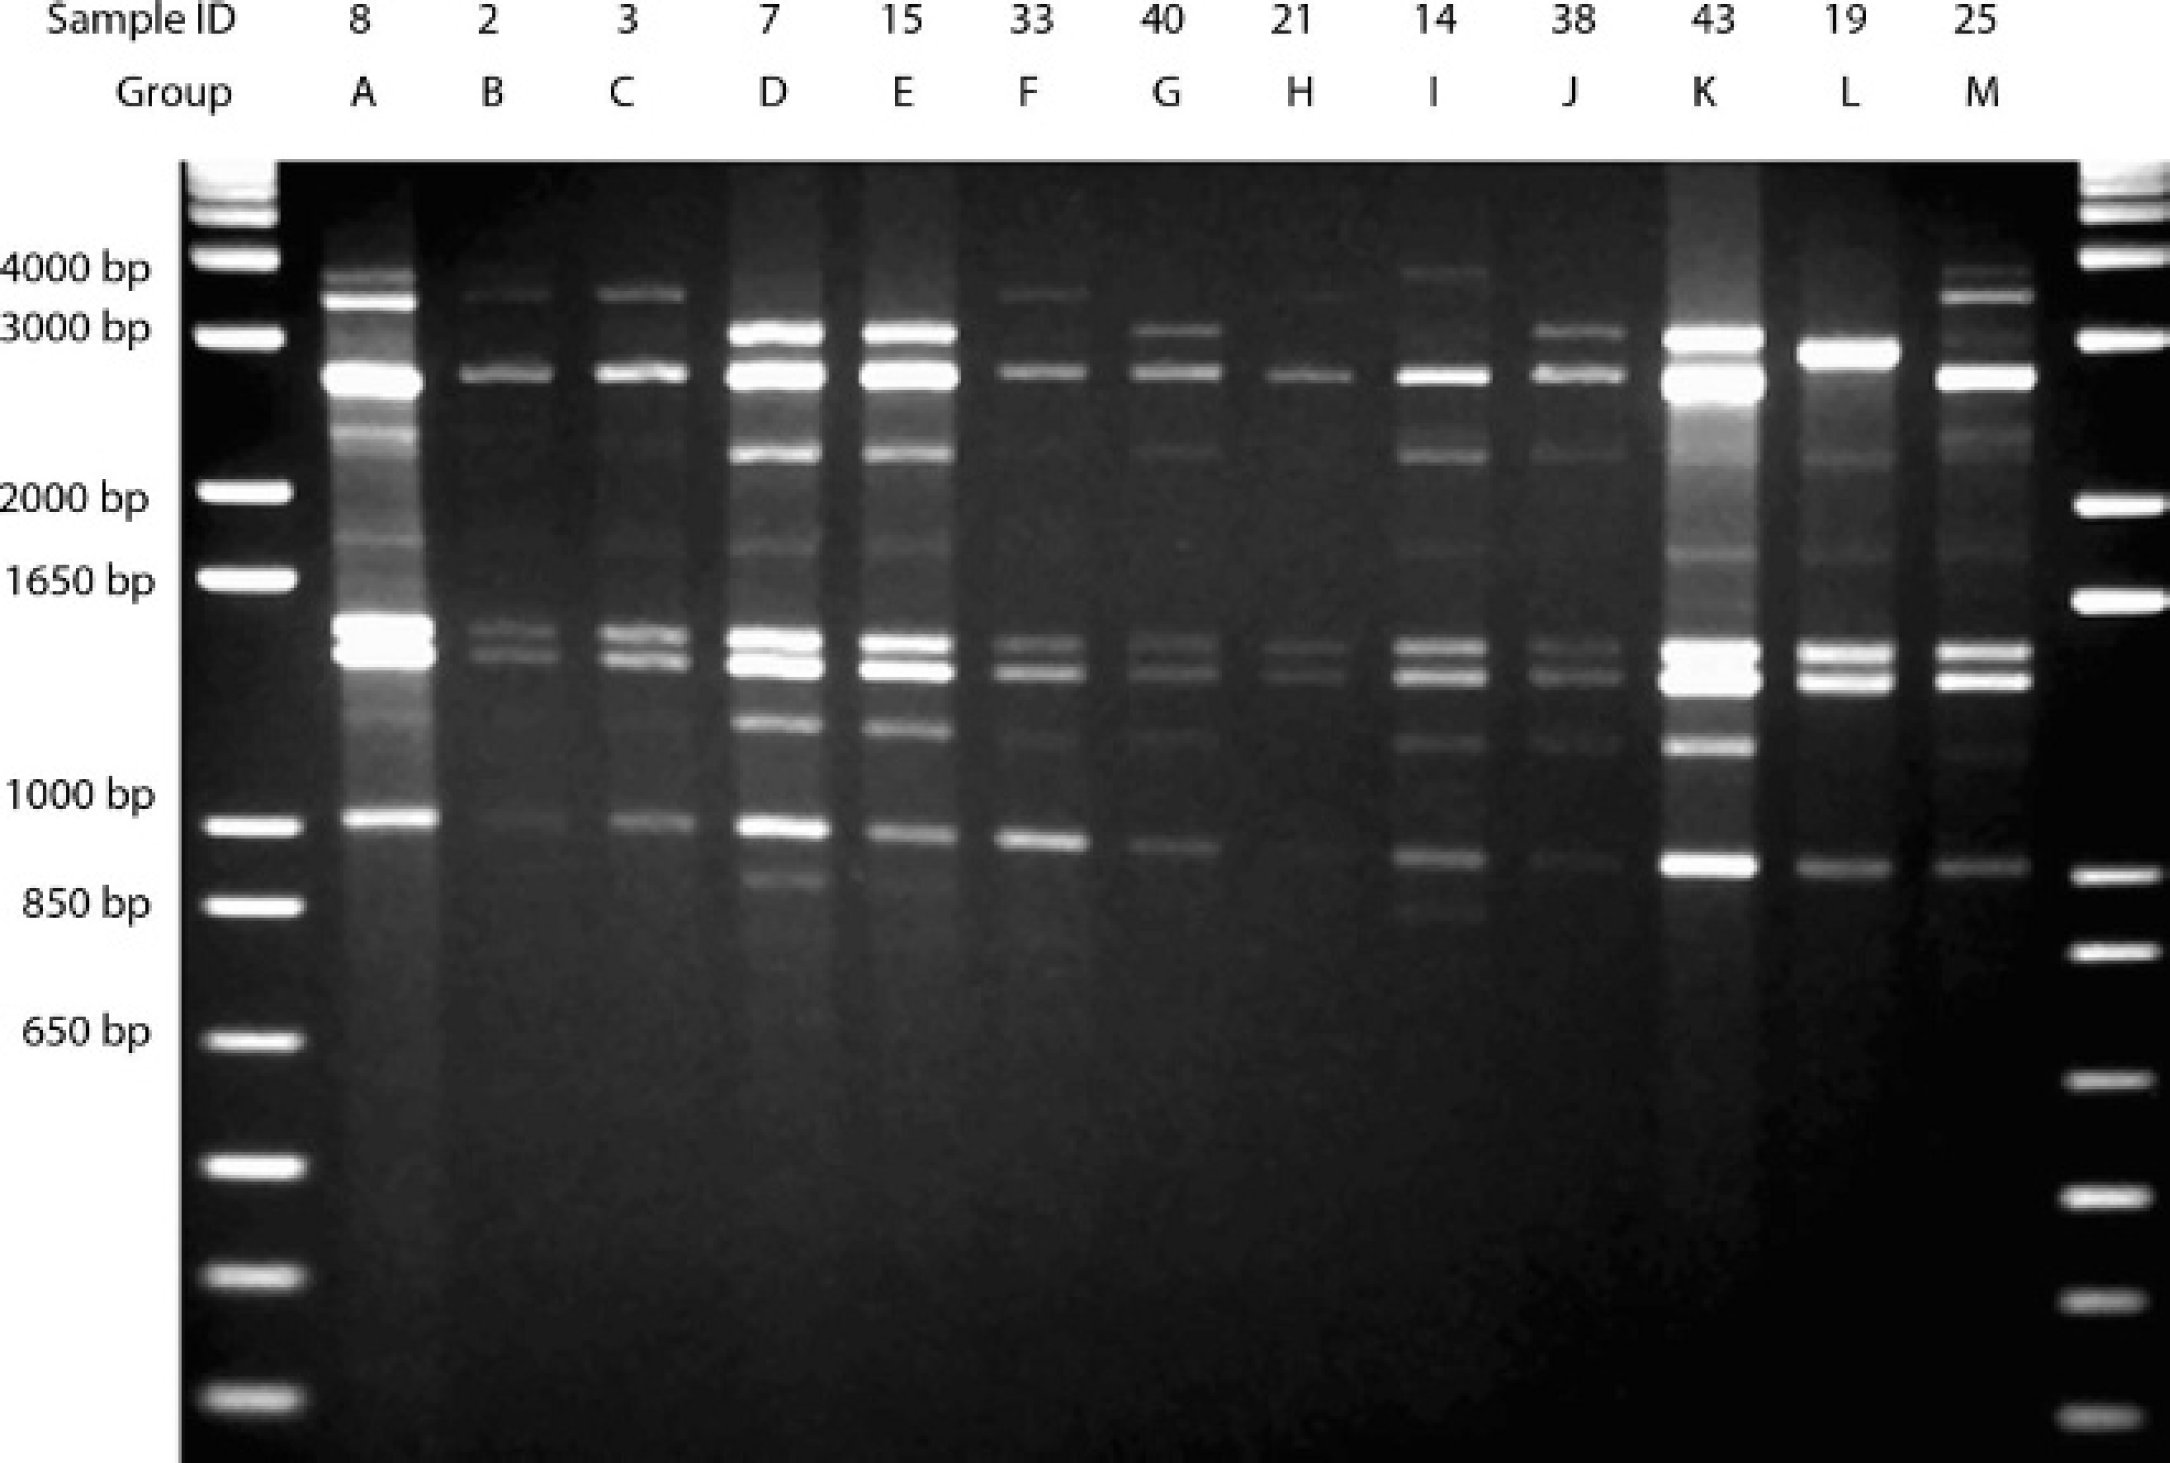
Representative samples from groups formed by analysis of banding patterns generated by M13 core polymerase chain reaction primer on 1.5% agarose gel. The individual sample ID is listed in the top line, and the group that the sample represents is in the second line.
The Wallace coefficient showed better correlation between the various genotypic and phenotypic characterization approaches than did the adjusted Rand, although values were still typically low (data not shown). By definition of the Wallace coefficient, conjugated results are perfectly predictive of the results of their constituents (i.e., [GTG]5-M13 is 100% predictive of the results for both [GTG]5 and M13); thus, these will not be discussed. The 3-way cross-tabulated RAPD-PCR results were more predictive of 3-way cross-tabulated phenotypic approach than vice versa. Of the individual primers, (GTG)5 had the best ability to predict phenotypic results and was also the best predicted by the phenotypic techniques. The modified M13 core primer again showed the poorest overall correlation, being ineffective in predicting results of the protein techniques and poorly predicted by them. The OMP groupings were better able to predict results of the PCR primers than either WCP or serotyping. Similarly, OMP was predicted more accurately by PCR results. The combination of WCP-OMP results were more effective than either alone, with fair to good predictive ability for results from M13, (GTG)5, and M13-(GTG)5. This includes the highest predictive value found between any genetic and phenotypic approach (0.706 predictability of [GTG]5, given results from WCP-OMP). However, predictive value of results from 3-way cross-tabulated RAPD-PCR analysis by WCP-OMP was poor (0.088). Serotyping was least effective at predicting PCR classification but was the most predictable protein approach. This is due to the small number of divisions that were created by serotyping.
Representative samples from groups formed by analysis of banding patterns generated by modified M13 core polymerase chain reaction primer on 1.5% agarose gel. The individual sample ID is listed in the top line, and the group that the sample represents is in the second line.
Representative samples from groups formed by analysis of banding patterns generated by (GTG)5 polymerase chain reaction primer on 1.5% agarose gel. The individual sample ID is listed in the top line, and the group that the sample represents is in the second line.
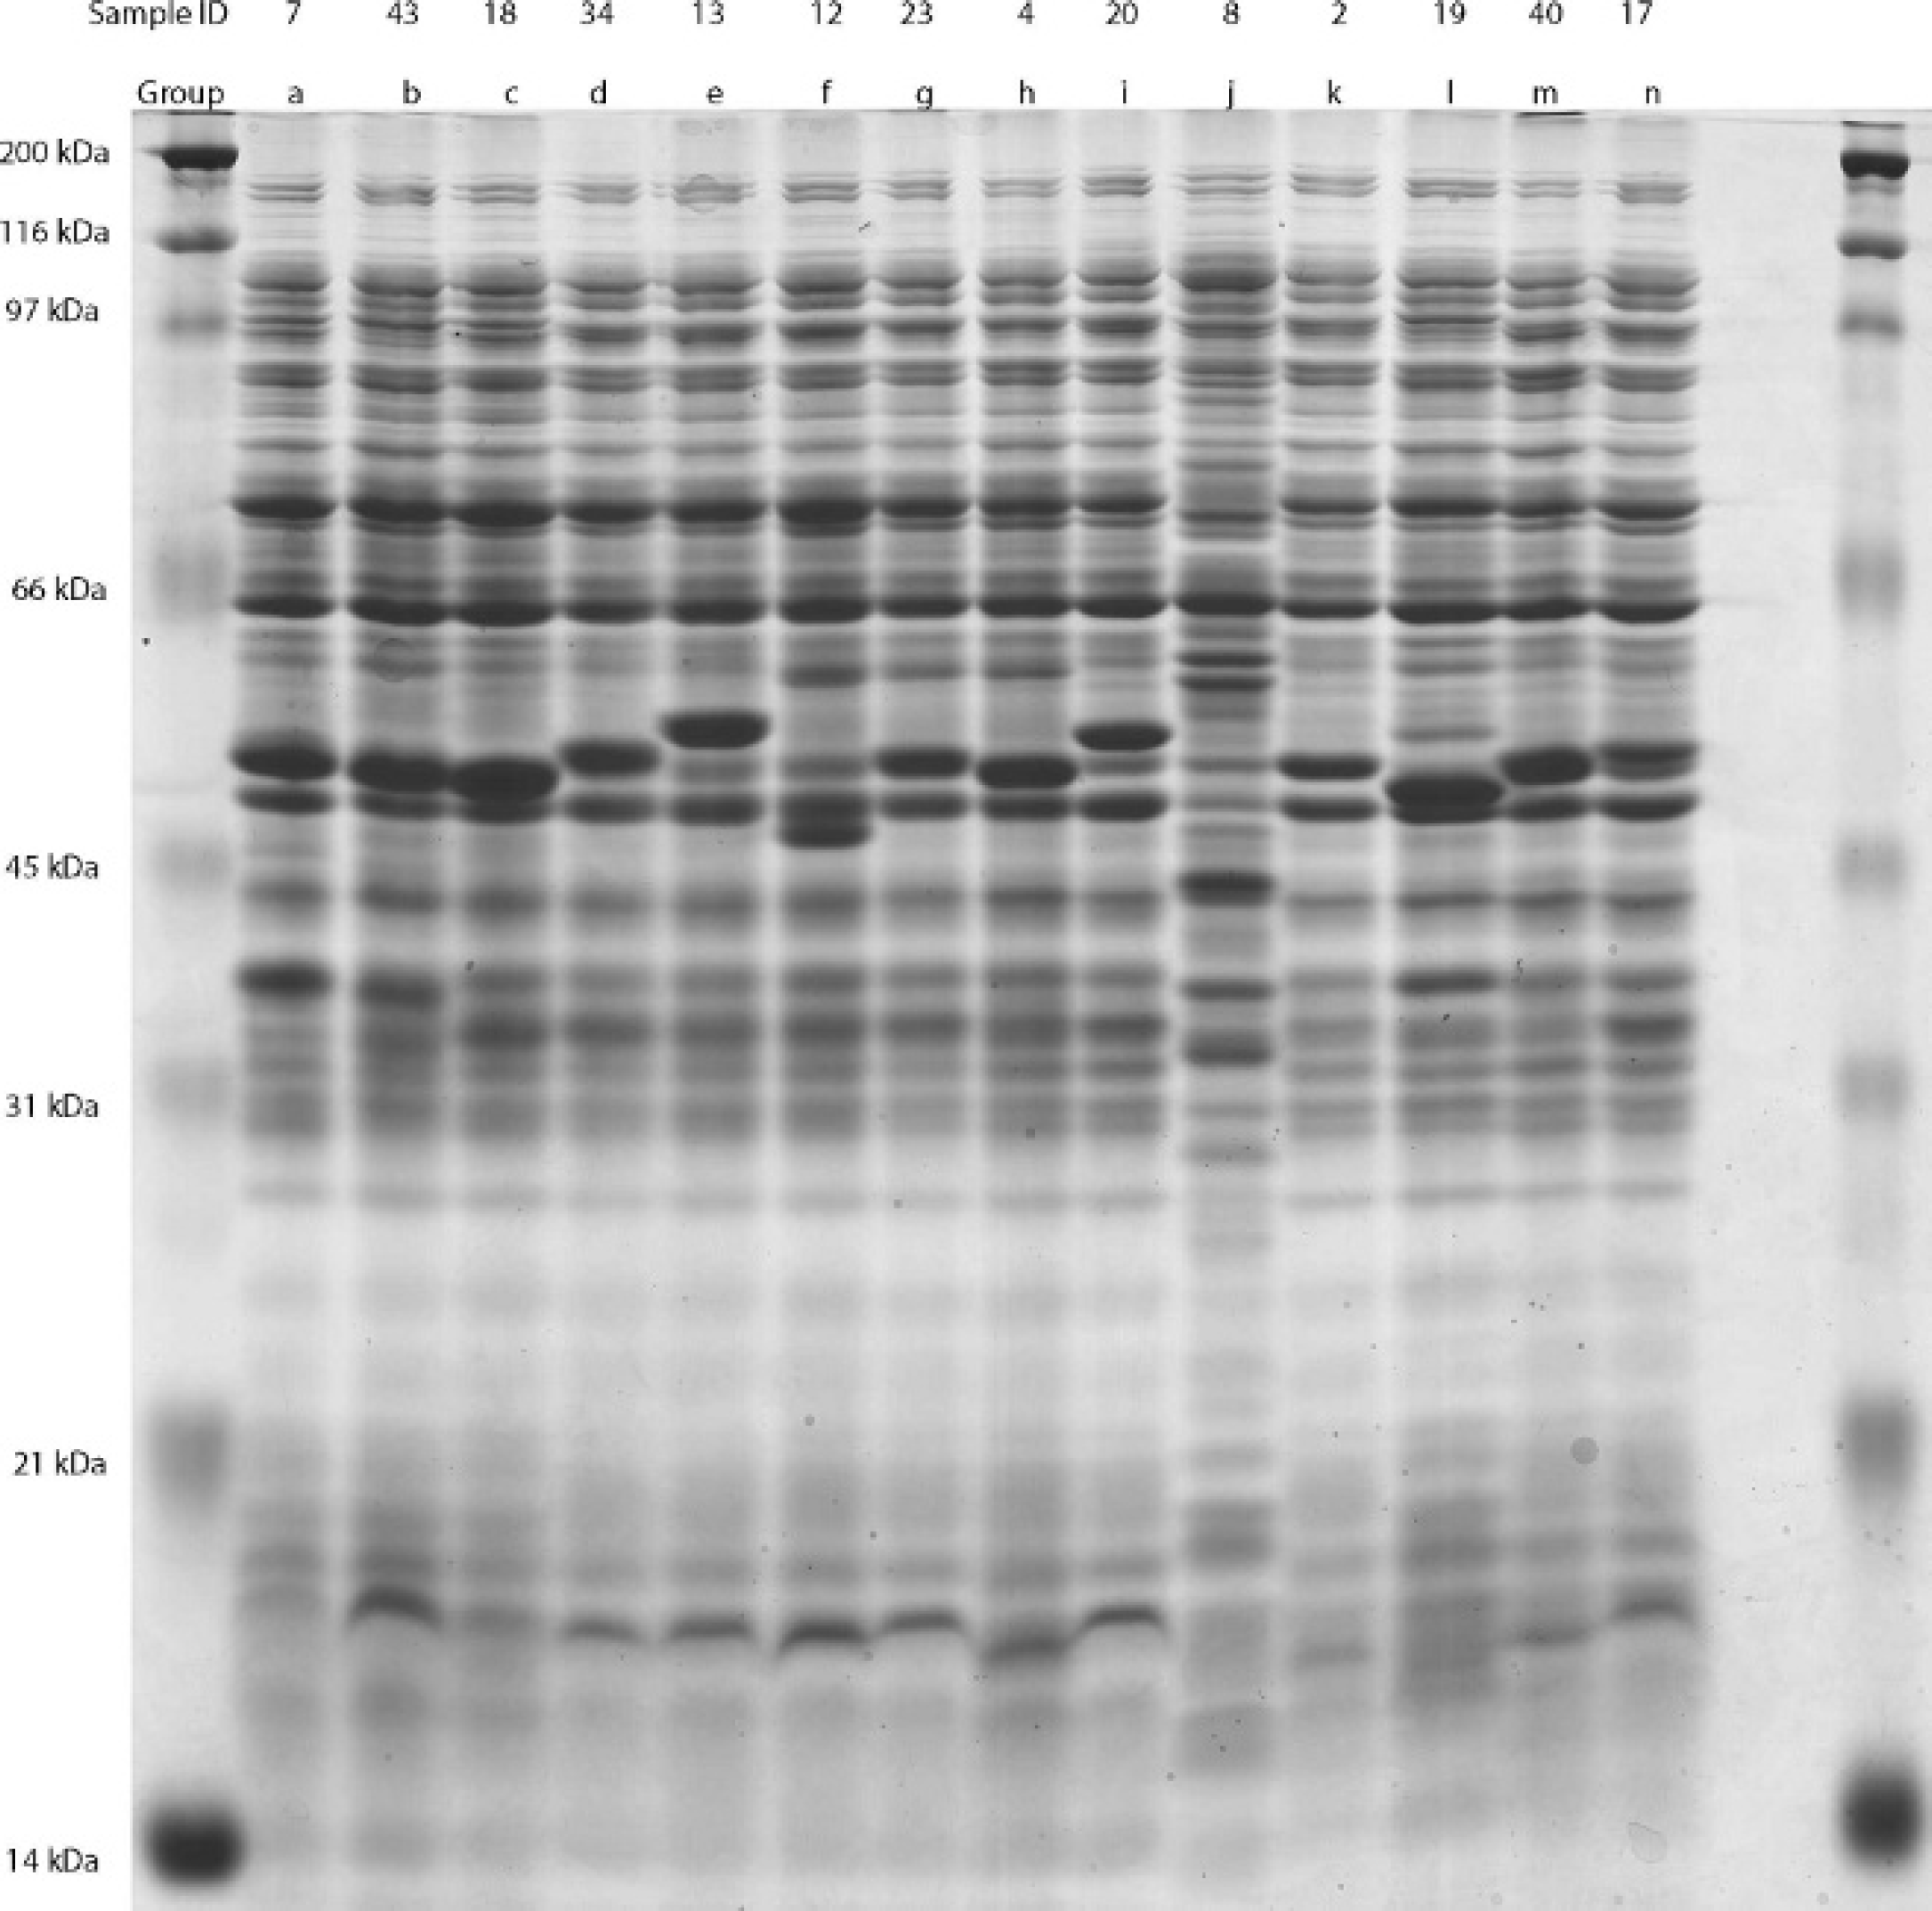
Representative samples from groups formed by analysis of banding patterns generated by whole cell protein sodium dodecyl sulfate-polyacrylamide gel electrophoresis on 12.5% polyacrylamide gel. The individual sample ID is listed in the top line, and the group that the sample represents is in the second line.
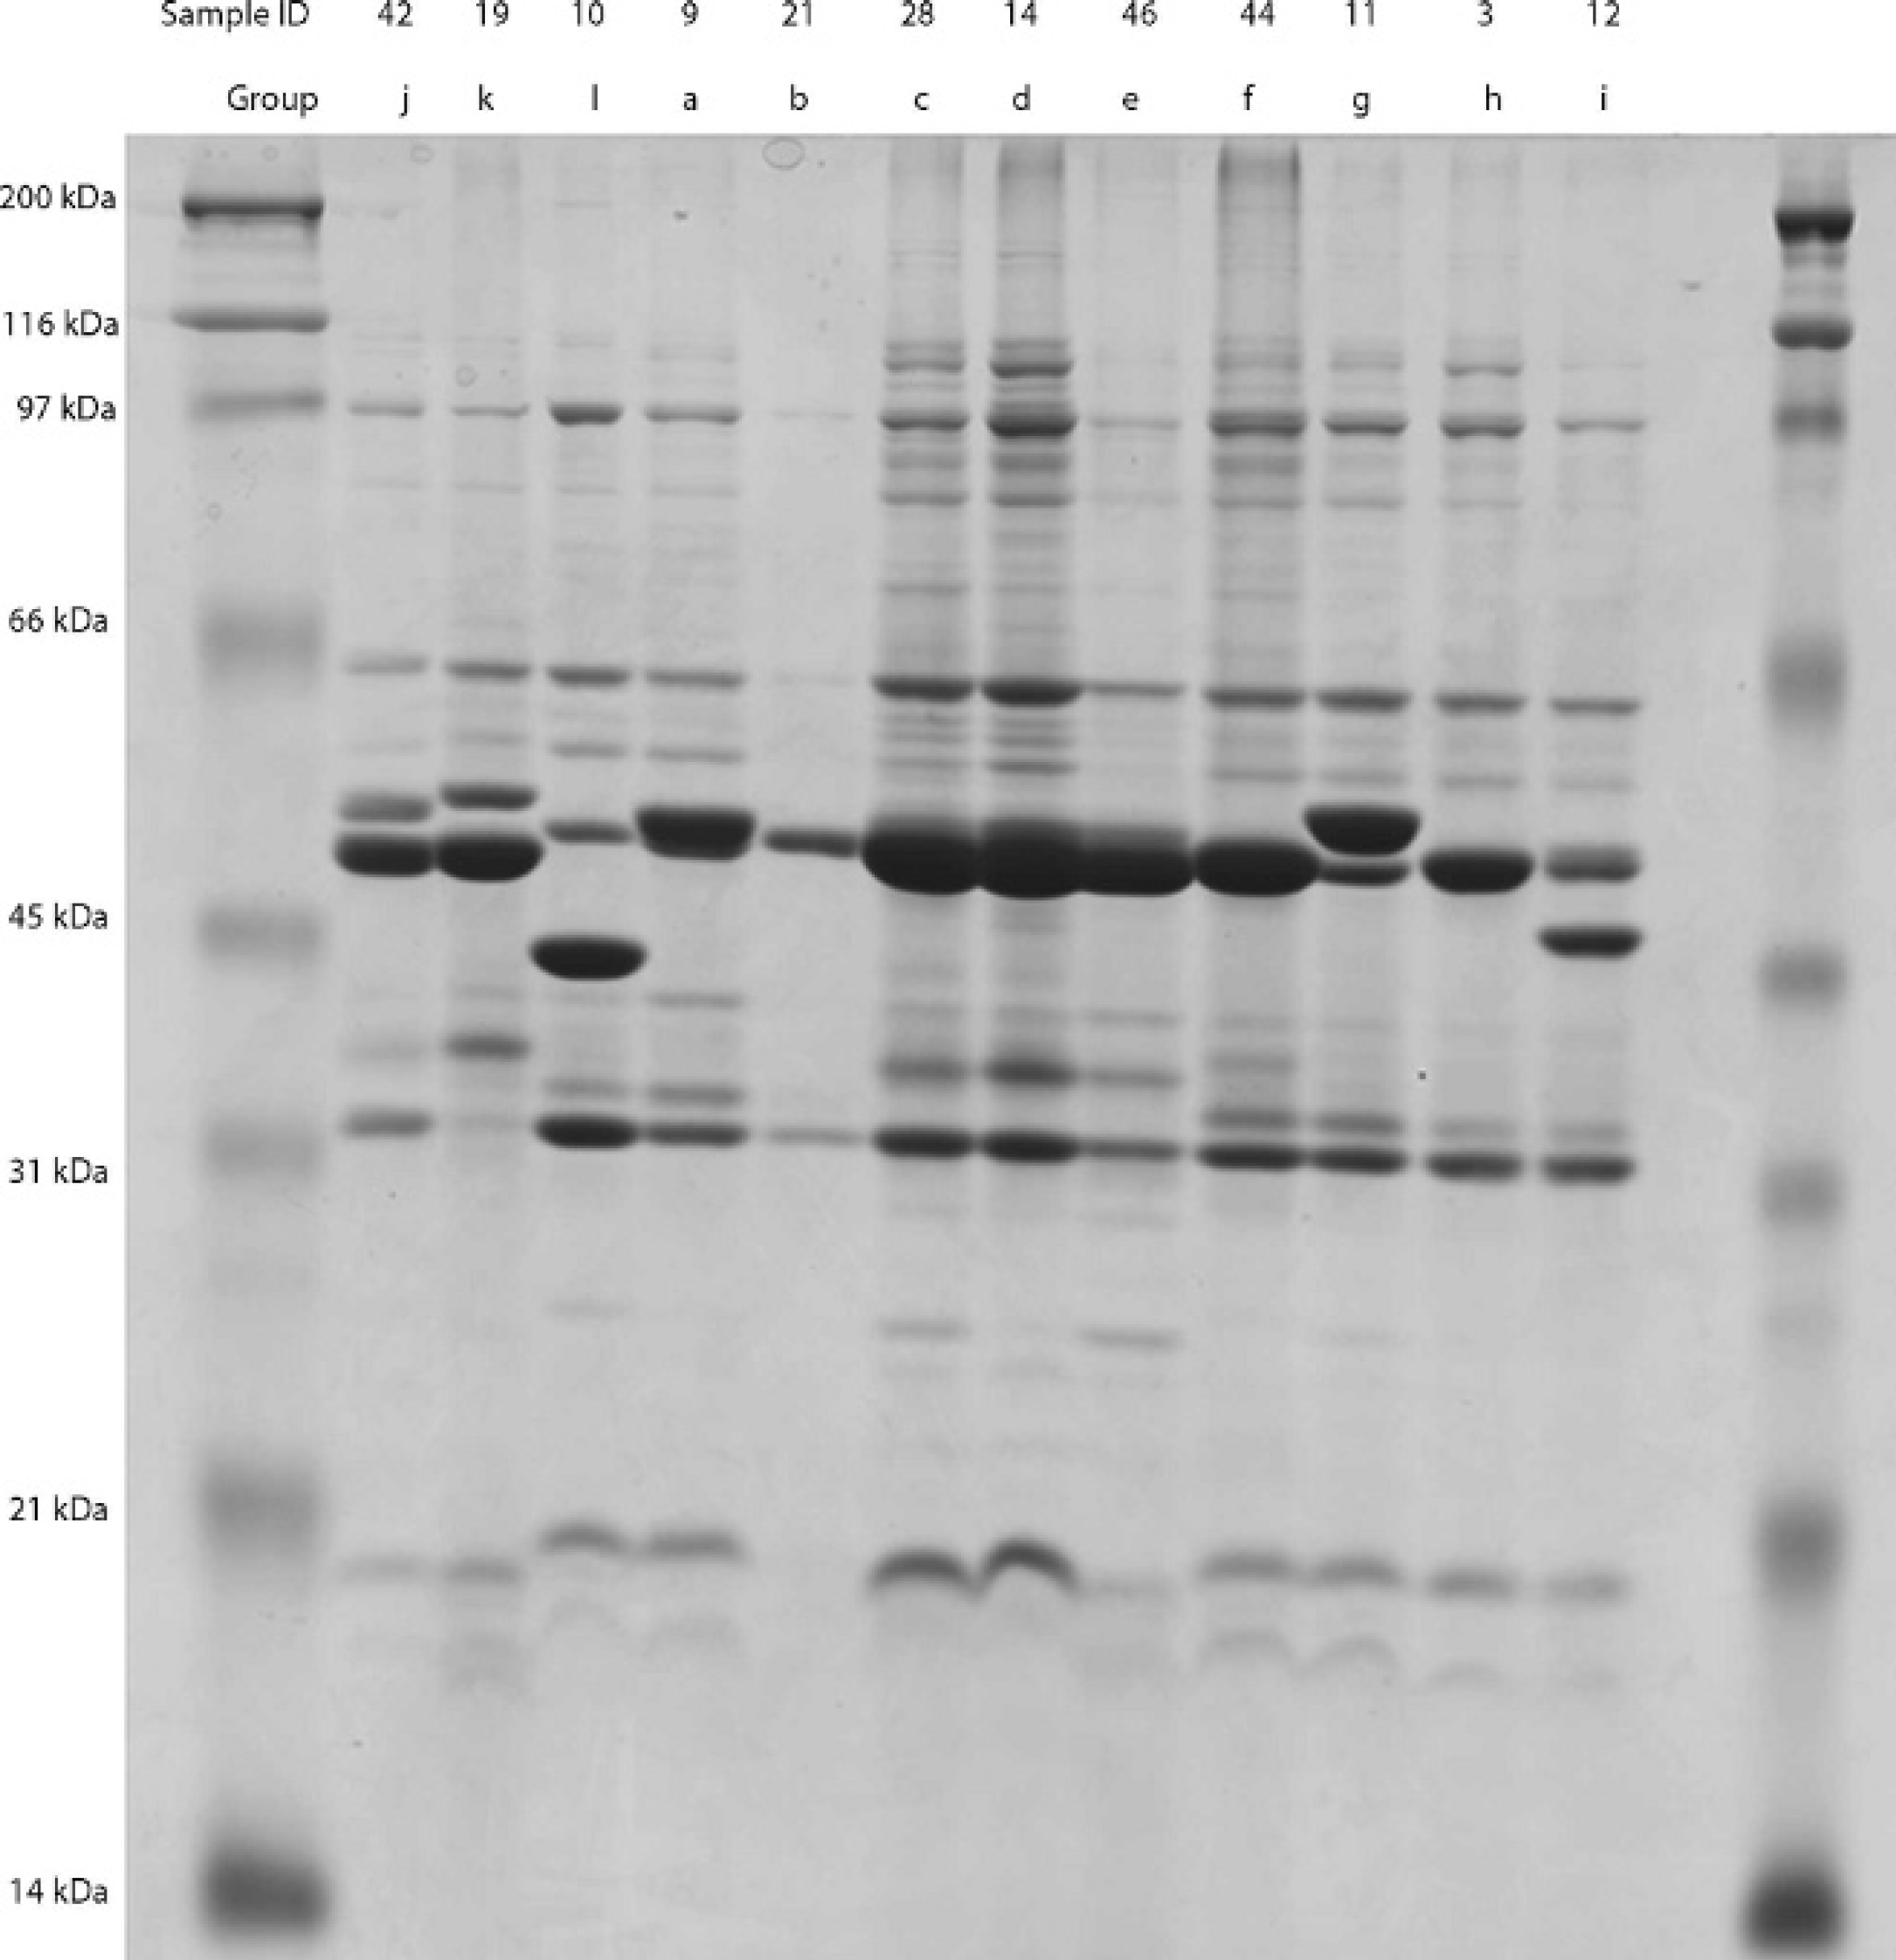
Representative samples from groups formed by analysis of banding patterns generated by outer membrane protein sodium dodecyl sulfate-polyacrylamide gel electrophoresis on 12.5% polyacrylamide gel. The individual sample ID is listed in the top line, and the group that the sample represents is in the second line.
Thirteen of the 41 calves had never been treated, 13 had been treated once or twice each, and 15 had been treated 3 or more times each. Eighteen were classified as suffering an acute death (sick ≤6 days), 5 were subacute (7–20 days), and 18 were chronically ill prior to death (>20 days). Pasteurella multocida was the only bacteria isolated from 13 calves, whereas other calves had a variety of bacteria isolated concurrently. These included M. haemolytica (9 calves), Arcano-bacterium pyogenes (7), Histophilus somni (4), and “other bacteria” (8). Contingency coefficient analysis found there was no grouping method with a significant association with numbers of treatment. Duration of illness was associated with serotyping results (P < 0.031). Other bacteria concurrently isolated were associated with OMP and WCP-OMP classification results (P < 0.021 and P < 0.05, respectively). Month of arrival was associated with modified M13 core primer results (P < 0.006).
Discussion
The samples examined in the current study demonstrated significant diversity. This may reflect diversity of P. multocida isolates in cattle in general or be reflective of these isolates in particular. One potential contributor to bacterial diversity is the variety of calves arriving at the participating feedlot, including genetic variation, source, vaccination and treatment history, and commingling and marketing exposure. An additional consideration that makes interpretation of this diversity difficult is the fact the isolates are from fatal cases. The host's immune response, as well as any antimicrobial treatments, would exert significant selection pressure on the bacteria. Thus, it is impossible to determine what relationship, if any, may exist between the pathogen recovered at time of death and those that incited the disease. Given the limited information available regarding the epidemiology of P. multocida in cattle, it is impossible to determine whether the diversity seen in this study reflects the diversity of commensal strains found in the upper respiratory tract of healthy cattle or even the spectrum seen in the lungs at initiation of disease.
Numerous studies have employed RAPD-PCR to characterize P. multocida. 6,7,14,15,25 Most of these required perfect agreement for isolates to be grouped together. Such an approach precludes quantitative assessment of the relationship between isolates, potentially concealing relationships between strains. This is particularly important when using multiple primers that result in varying numbers of bands. For example, 1 band difference between 2 isolates is more significant if only 8 bands are generated than if 16 are produced. Use of the similarity index permits consistency in establishing these relationships without requiring 100% similarity. A 92.5% combined cluster similarity coefficient was chosen as a relatively stringent criterion. This is significantly higher than that chosen by others using RAPD-PCR. 25,26 However, adopting an 80% similarity cutoff in the current study, as previous studies employed, 25,26 would have resulted in very few groups and a greatly reduced D index.
The use of OMP for characterization of P. multocida has been reported, 1,7–13 as has WCP to a lesser extent. 7,22,24 Interpretive criteria for protein profiles is more subjective than that reported for RAPD-PCR. The OMP results in the current study placed, on average, fewer samples per group than reported by others. 7,10 This may represent truly increased diversity among the samples in the present study or simply be due to variation in interpretation. Diversity discerned by WCP profiling appears similar to the result of a previous study 7 but more than that reported by another. 24 However, all of the isolates used by that second study 24 were from hemorrhagic septicemia-associated isolates, which may demonstrate less diversity than those associated with BRD.
It was necessary to combine results from multiple characterization methods to meet the previously established criterion of D index ≥0.9. Nonetheless, the resulting D values demonstrated that RAPD-PCR, as well as OMP, WCP, and serotyping, may be useful in discriminating between strains of P. multocida from BRD. It should be noted that Simpson's approach requires making 2 assumptions: 1) samples are randomly selected from the population of interest; 2) all groups are equally represented in the population.
The validity of these assumptions in the current study is questionable. Collection of samples was restricted to fatal cases of respiratory disease in a limited geographic region over a 12-month period. They were not randomly selected from the entire range of P. multocida population associated with beef cattle respiratory disease and likely do not represent that population. Second, it is not clear whether all possible groups are expected to be represented in fatal disease cases or whether certain strains may be over-represented as a result of increased pathogenicity. However, violation of these assumptions in this manner would be expected to decrease the discriminatory capability; thus, the fact that RAPD-PCR was still adequate to discern differences among these strains speaks to its robust capabilities. Similar results were obtained by phenotypic characterization techniques as well. Considering the limited information provided by serotyping and the additional labor involved in collecting, processing, and analyzing WCP and OMP, it would appear that RAPD-PCR is a preferred method.
The low Rand coefficient concordance found in the current study states that genotypic and phenotypic characterization approaches identified different relationships among the isolates. It is impossible to determine which technique(s) would be more reliable in epidemiologic investigation. The best way to assess this would be through comparison with epidemiologic data on the cattle from which the isolates were obtained. Unfortunately, epidemiologic analysis was greatly hindered by dispersion of data, not only among typing schemes but also within epidemiologic data. For example, many of the types created by 2-way grouping methods contained a single sample. Similarly, the 41 calves were housed in 35 different pens, most having only a single animal included in the study. Attempts were made to overcome some of this dispersion by grouping much of the data into categoric variables. However, the validity of the groupings used in this approach is uncertain.
The few significant associations identified between groupings and epidemiologic data were not consistent. The association of serotype and duration of illness was likely spurious, because previous studies have shown serotyping to be of no epidemiologic value. 2,29 The correlation of OMP and WCP-OMP with isolation of other bacteria suggested that 1 strain may be more likely to be found alone than in combination with other bacteria. This could indicate greater pathogenicity in this strain. However, if that were the case, one would have also anticipated that strain to be associated with other variables, including number of treatments and days from treatment to death. It is possible this finding is also spurious, because it is likely that the presence of other bacteria is influenced by multiple factors, including previous treatment and duration of disease, which may be more important than the strain of P. multocida present. The association of month of arrival at the feedlot and modified M13 core primer could be meaningful evidence of temporal clustering of strains. Ironically, the results for that primer showed poorest correlation with all phenotypic techniques.
In conclusion, the present study validates RAPD-PCR using micro- and minisatellite primers as being a repeatable and reliable means of discriminating between P. multocida isolates obtained from cattle. Isolates obtained from fatal cases of BRD in calves in a commercial feedlot demonstrated significant diversity, potentially supporting the hypothesis that P. multocida is a strictly opportunistic pathogen in cattle. However, additional work is needed to characterize the diversity of commensal strains found in healthy cattle. Moreover, larger numbers of isolates are needed with more complete epidemiologic data to examine the possibility of horizontal transmission and temporal and spatial clustering.
Acknowledgements
The authors thank the Noble Foundation and Oklahoma State University Center for Veterinary Health Sciences for funding this project.
Footnotes
a.
Promega Wizard Genomic DNA Purification Kit, Promega Corp., Madison, WI.
b.
Nano Drop Spectrophotometer, ND-1000, Thermo Fisher Scientific, Waltham, MA.
c.
Integrated DNA Technologies, Coralville, IA.
d.
Quantity One, Bio-Rad, Hercules, CA.
e.
RC DC Protein Assay, Bio-Rad Laboratories, Hercules, CA.
f.
Fisher Scientific, Fair Lawn, NJ.
g.
SPSS 16.0 for Windows, SPSS Inc., Chicago, IL.