
Abstract
Bovine anaplasmosis (BA) is a hemoparasitic disease of great importance in cattle within the tropical and subtropical regions of the world. Control programs for BA require accurate diagnostic assays but validation can be challenging because the true disease status of all animals is frequently not known with certainty. The objective of this study was to estimate the accuracy of assays for detection of Anaplasma marginale infection in lactating dairy cattle of Puerto Rico using Bayesian methods without a perfect reference test. There were 2,331 cattle with complete diagnostic results sampled from 79 herds, and the prevalence of BA was estimated as 22% (95% probability interval [PI]: 19–25%). The sensitivity (Se) and specificity (Sp) of a major surface protein 5 competitive enzyme-linked immunosorbent assay (MSP-5 cELISA) were estimated as 99% (95% PI: 96–100%) and 89% (95% PI: 87–92%), respectively. The Se and Sp of a quantitative polymerase chain reaction (qPCR) were 67% (95% PI: 60–74%) and 99% (95% PI: 99–100%). The Se and Sp of a card agglutination test were 34% (95% PI: 29–39%) and 99% (95% PI: 99–100%). Area under the receiver-operating characteristic curve for the MSP-5 cELISA was 0.748 (95% PI: 0.71–0.79). The MSP-5 cELISA appears to be the test of choice for screening cattle for subclinical BA based on the high estimated Se, rapidity of results, relative low cost, and ease of standardization.
Introduction
Bovine anaplasmosis (BA) is a hemoparasitic disease of great importance in cattle production systems in the tropical and subtropical regions of the world, including the island of Puerto Rico. 8,33 The disease is caused by the rickettsiae, Anaplasma marginale (order Rickettsiales, family Anaplasmataceae), 9 and is characterized by severe anemia and jaundice without hemoglobinemia and hemoglobin-uria. Other clinical signs include weight loss, decreased milk production, abortions, hyperexitability (as a result of cerebral anoxia), and sudden death. 29 Recovered animals become persistently infected with A. marginale and serve as a reservoir of the organism within a herd. 16
Available testing for A. marginale infection in cattle includes both direct and indirect detection methods. Direct methods, which detect the organism or its DNA, include the evaluation of Wright–Giemsa-stained peripheral blood smears and polymerase chain reaction (PCR) techniques. Indirect methods, which detect antibodies directed against A. marginale surface antigens, include the rapid card agglutination test and competitive enzyme-linked immunosorbent assay (cELISA) based on detection of antibodies specific for major surface protein 5 (MSP-5). The evaluation of peripheral blood smears is a commonly used technique that is most sensitive when used to evaluate animals that are clinically ill, typically during the acute phase of disease, 12 but parasites are seldom detected microscopically in chronic infections. Poly-merase chain reaction detects DNA of the parasite and therefore recognizes active infection, and the relative amount of DNA detected correlates with the level of parasitemia. 4 The card agglutination test employs a suspension of intact A. marginale parasites, which have been separated from erythrocytes by lysis in a French pressure cell and stained with fast green dye. 2,35 The diagnostic sensitivity (Se) and specificity (Sp) of the card test has been estimated as 98% and 99%, respectively. 26 The diagnostic accuracy of the MSP-5 cELISA estimated relative to a nested PCR coupled with MSP-5 sequence analysis and hybridization at a cutoff point of 28% inhibition had a relative Se of 96% and Sp of 95%. 31
Diagnostic Se and Sp together represent the accuracy and vary with the expected use of the test. 20 Tests evaluated for diagnosis in acute infections might not have the same accuracy when used for screening chronically infected carrier animals. Validation of assays can be challenging because the true disease status of all animals is infrequently known with certainty. Highly specific tests (Sp ≈ 1) can provide evidence that an animal is truly infected but commonly are imperfectly sensitive (Se < 1). Statistical methods that do not require the assumption of a perfect reference test have been developed, 11,19,21 and these methods can be employed for the validation of diagnostic assays. The objective of the study reported here was to estimate the accuracy of assays for detection of A. marginale infection in lactating dairy cattle of Puerto Rico using Bayesian methods without a perfect reference test.
Materials and methods
Sample collection
The selection of farms and cattle within farms has been described in a previous report. 32 In brief, commercial dairy farms in Puerto Rico constituted the list frame and were randomly selected after stratification by the 4 major ecological zones of the island and the 3 herd sizes. Lactating cattle within herds were randomly selected based on either a simple random sample or systematically as cattle exited the milking parlor. The number of selected farms was based on estimation of a herd-level prevalence of A. marginale infection of 50% (to maximize sample size because previous information was not available) and the within herd sample size was calculated based on the minimum sample size to detect disease assuming at least an 8% prevalence in truly infected herds. Two additional volunteer dairy herds in Puerto Rico and a shipment of heifers from mainland United States were also included in the diagnostic investigations.
Two blood samples were collected from each selected cow after milking via coccygeal venipuncture. One sample was drawn into a 10-ml vacutainer tube containing no anticoagulant and another containing ethylenediamine tetra-acetic acid. Samples were transported on ice to the laboratory where blood films were immediately prepared, serum was separated, and serum and whole blood specimens were frozen at −25°C until testing.
Diagnostic testing
All diagnostic assays were performed by individuals blinded to the results of other tests.
Wright–Giemsa-stained direct smears. Blood films were prepared from anticoagulated blood, air dried, and stained with Wright–Giemsa stain by a single investigator (JHR) in a research laboratory at the University of Puerto Rico, Mayagüez Campus. Slides were transported to the Department of Physiological Sciences at the University of Florida and evaluated using light microscopy by a laboratory assistant who had no prior knowledge of other test results on any sample. Small (0.3–1.0 μm in diameter), dark blue to black, round or irregular shaped inclusion bodies with the majority close to the margin of the erythrocyte 34 were considered a positive result for A. marginale infection.
Quantitative polymerase chain reaction. Quantitative PCR was performed in a research laboratory by investigators (MDD, ARA) at the University of Florida (Gainesville, FL). DNA was extracted from 200 μl of whole, anticoagulated blood using the QIAamp DNA Mini Kit or QIAamp DNA Blood Mini Kit a according to the manufacturer's instructions. The DNA was resuspended in molecular biology grade water and stored at −20°C until testing.
The OPAG2 gene sequence was amplified by quantitative PCR (qPCR) based on a previous report 3 employing 0.4 μM of each primer (RVM06-amarg: 5'-AAAACAGGCTTACCGCTCCAA-3' and RVM07-amarg: 5'-GGCGTGTAGCTAGGCTCAAAG T-3') and 0.2 μM of the probe (RVM08-PROBE-amarg: 5'-CTCTCCTCT-GCTCAGGGCTCTGCG-3') in a 25-μl volume employing sequence detection system (SDS) software.
Each PCR reaction contained 12.5 μl of the master solution, b 0.25 μl of 0.4 μM RVM06 and RVM07 primers, 0.125 μl of the RVM08 probe, 6.875 μl of molecular biology–grade water, and 5 μl of purified DNA. Reactions were performed in an automated DNA thermal cycler c for 40 cycles according to the manufacturer's instructions. After an initial, one-time denaturing step of 20 sec at 95°C, each cycle consisted of 3 sec at 95°C for melting and 30 sec at 60°C for annealing/extending. Negative controls included reaction mixtures without target DNA. An OPAG2 construct in a concentration of 4.025 × 10¹¹ copies/μ1 was serially diluted to create a standard curve composed of 9 points: 109, 108, 107, 106, 105, 104, 103, 102, and 101 OPAG2 copies. Copy numbers for each test sample were calculated based on the standard curves and specimens, with 11 or more OPAG2 copies were considered qPCR positive. The cutoff was chosen to limit the number of false positives and based on previous research suggesting a 10 copy detection limit for qPCR assays. 6
Rapid card agglutination test. Anaplasma card tests d were performed by an investigator (GLD) in a research laboratory at Texas A&M University (College Station, TX) on serum samples using a previously published protocol 2 with addition of normal bovine sera. 18 Reagents and test serum were equilibrated to room temperature prior to testing. Thirty microliters of normal bovine serum, 30 μl of test serum, and 15 μ1 of anaplasma antigen were added to each test circle. The 3 components were mixed and cards were rotated at 100 rpm on an orbital ELISA plate shaker for 4 min. Reactions with visible agglutination immediately after the rotation step were classified as test positive.
MSP-5 competitive ELISA. Sera were tested for antibodies against A. marginale using a commercially available MSP-5 cELISA c by a single investigator (JHR) at the State Veterinary Diagnostic Laboratory Dr. Gabriel González-Calderín in Dorado, Puerto Rico. Test procedures were performed according to manufacturer recommendations and have been described in a previous report. 32 An ELISA microplate reader f linked to a computer software program g was used to measure and record optical densities (ODs) at 650 nm. Percent inhibition was calculated as (mean OD of negative control – mean OD of test sera)/(mean OD of negative control) × 100, and results were interpreted at a cutoff of 30% inhibition. 26 Samples with greater than or equal to 30% inhibition were considered positive.
Beta prior probability distributions for unknown parameters in a Bayesian model to evaluate tests for bovine anaplasmosis in 2,331 dairy cattle from 79 herds in Puerto Rico in which the true infection status was unknown. *
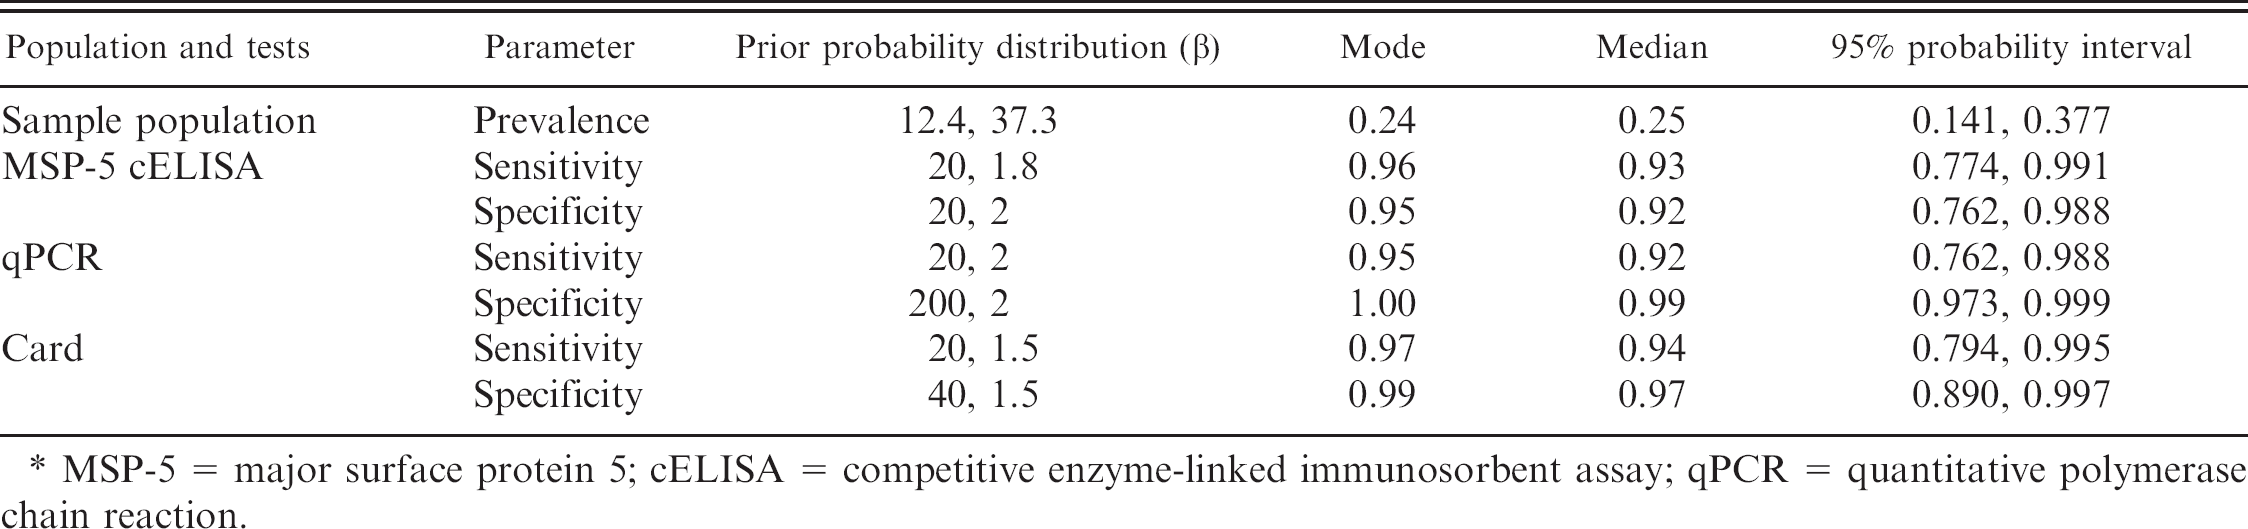
MSP-5 = major surface protein 5; cELISA = competitive enzyme-linked immunosorbent assay; qPCR = quantitative polymerase chain reaction.
Statistical analysis
Diagnostic accuracy of the card test and MSP-5 cELISA were estimated relative to qPCR results. Sensitivity was estimated as the proportion of positive test results for each test within those cattle that tested positive by qPCR. Specificity was similarly estimated within cattle that tested negative on qPCR. The design effect 25 was estimated to adjust for the clustered sampling design and 95% confidence intervals (CI) were calculated using available software. h Youden index was calculated as Se + Sp − 1.
Diagnostic accuracy of the card test, MSP-5 cELISA, and qPCR were estimated in a latent class analysis using a Bayesian framework (evaluation of direct smears were excluded because of few positive tests). Prior probability distributions for this analysis (Table 1) were based on published literature 26,31 and modified by expert opinion because previous studies employed different reference standards. A 3-test, single population model was used assuming conditional independence between pairs of diagnostic tests. All tests were dichotomized as positive or negative based on the descriptions in the previous sections for the estimation of Se, Sp, and prevalence. More information related to this modeling approach can be found elsewhere. 14
Markov chain Monte Carlo (MCMC) techniques were employed using available statistical software i to iteratively estimate diagnostic accuracy. Autocorrelation among iterate values was assessed, and only every third value was retained to reduce the impact of this correlation. Convergence was assessed by evaluating plots of model parameter iterates for all variables and was reached when parameter values (iterates) had no discernible trend over successive iterations. Convergence was further assessed by calculating the Gelman–Rubin statistic available in the software. Iterate values obtained before convergence, termed the analysis burn-in, were not used for inferences. The first 200,000 iterations were discarded as the burn-in and inferences were made based on the subsequent 20,000 iterations. Median values and percentiles were used as point estimates and probability intervals (PI), respectively. The sensitivity analysis of model results to changes in prior probability distributions was assessed by replacing informative with noninformative priors and repeating the analysis.
An empirical Bayesian approach was used to investigate the accuracy of the MSP-5 cELISA. Prior probability distributions were generated based on the results of the 3-test, single population model previously described (Table 2). The MSP-5 cELISA was evaluated quantitatively at 4 possible cutoff values, which were 15%, 30%, 55%, and 80% inhibition. These cutoff values appeared to provide adequate number of observations for each possible test result category. The analysis was performed assuming a single population, dichotomous interpretation of card and qPCR results, and conditional independence between tests. A similar analytic approach has been previously described for Johne's disease in cattle. 15
Receiver-operator characteristic (ROC) curves were plotted for the 4 evaluated cutoffs by connecting the points of the 1 – Sp (x-axis) by Se (y-axis). Area under the estimated ROC curve (AUC) was calculated by the trapezoid approximation method. 27 Using this method, AUC is equal to the summation of areas corresponding to adjacent trapezoids formed by the mean value of successive sensitivities (mean height of trapezoid) and difference in successive specificities (base width). Category-specific likelihood ratios (LR) were estimated as the change in Se divided by the change in Sp (ΔSe/ΔSp) between adjacent cELISA categories.
The quantitative cELISA model was also implemented using MCMC techniques in available software. i Autocorrelation among iterate values was assessed, and only every 10th value was retained. Convergence was assessed in the same manner as the previously described model. The first 200,000 iterations were discarded as the burn-in, and inferences were made based on the subsequent 20,000 iterations.
Results
There were 2,331 cattle sampled from 79 herds that had complete test result information. Only 5 cows were recognized to have A. marginale infection based on examination of peripheral blood smears, and this test was not included in diagnostic evaluations. One cow with a positive smear was negative on all other tests. Two cattle with positive smears were also positive on MSP-5 cELISA and qPCR but negative on the card test. The other 2 cattle were positive on MSP-5 ELISA and card but negative on qPCR. Fifteen percent (348/2,331) of sampled cattle were positive on qPCR, 7% (174/2,331) positive on the card test, and 30% (699/2,331) positive on the cELISA at the 30% inhibition cutoff (Table 3). The Se and Sp of the MSP-5 cELISA relative to qPCR were 94.2% (95% CI: 89.5–97.0%) and 81.1% (95% CI: 77.2–84.4%), respectively. The Se and Sp of the card test relative to qPCR were 27.3% (95% CI: 22.1–33.2%) and 96.2% (95% CI: 94.6–97.3%), respectively.
Beta prior probability distributions for unknown parameters in an empirical Bayesian model to evaluate a major surface protein 5 (MSP-5) competitive enzyme-linked immunosorbent assay (cELISA) for bovine anaplasmosis in 2,331 dairy cattle from 79 herds in Puerto Rico. *
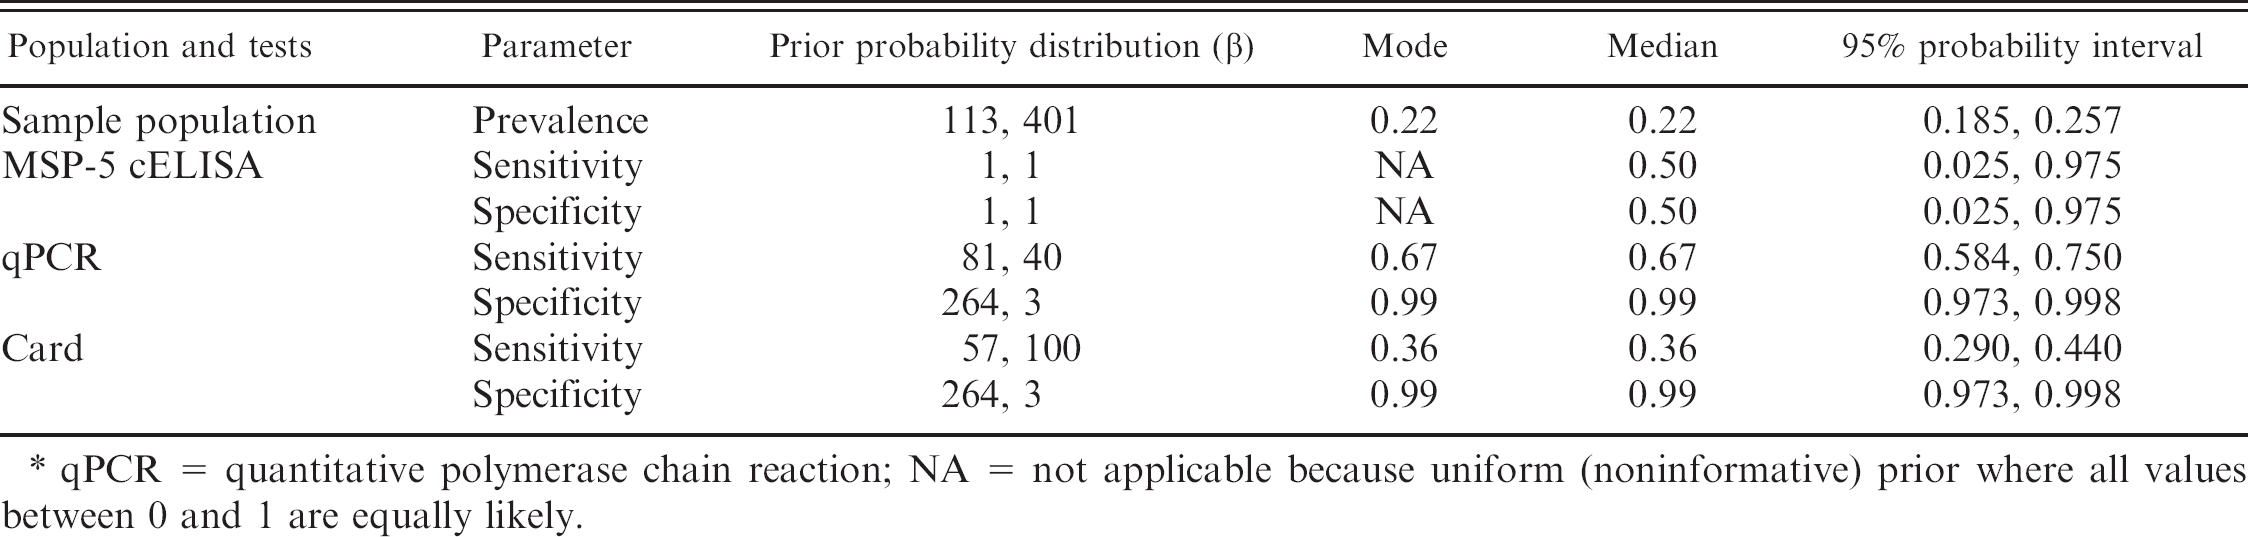
qPCR = quantitative polymerase chain reaction; NA = not applicable because uniform (noninformative) prior where all values between 0 and 1 are equally likely.
The Bayesian model based on dichotomized results estimated the Se of the card test to be only 33.6% (Table 4). The estimated Se of qPCR was also lower than expected at 67.0%. The Se and Sp of the MSP-5 cELISA were 99% and 89%, respectively. Sensitivity analysis did not suggest undue influence by prior distributions (data not shown). Youden indexes were 0.88, 0.66, and 0.33 for the MSP-5 cELISA, qPCR, and card test, respectively.
The distribution of MSP-5 cELISA results appeared bimodal but encompassed the range of possible values (Fig. 1). Sensitivity (95% PI) of the MSP-5 cELISA was 55% (49–61%), 52% (47–59%), 47% (42–53%), and 15% (12–19%) for the 15%, 30%, 55%, and 80% inhibition cutoffs, respectively. Specificity (95% PI) of the MSP-5 cELISA was 91% (88–93%), 96% (93–98%), 98% (96–1.0%), and 100% (100–100%) for the 15%, 30%, 55%, and 80% inhibition cutoffs, respectively. The resulting ROC curve based on all evaluated cutoffs (Fig. 2) had an AUC (95% PI) of 0.748 (0.711–0.787). Likelihood ratios (95% PI) for the MSP-5 cELISA were 0.50 (0.42–0.57), 0.44 (0.19–0.85), 2.4 (1.1–6.6), 22 (6.6–373), and 310 (58–1670) for the <15%, 15–29%, 30–54%, 55–79%, and ≥80% inhibition categories, respectively.
Discussion
The prevalence of A. marginale infection was estimated to be 22% within lactating dairy cattle of Puerto Rico. This was slightly lower than the MSP-5 cELISA seroprevalence of 27% estimated within this sample 32 and toward the lower end of the range of prevalence reported for the Caribbean region. 5 There was a very low prevalence of cattle positive by direct examination of Wright–Giemsa-stained blood smears (5/2331) suggesting few acute infections and possible endemic stability within some herds on the island. Relative to qPCR results, the MSP-5 cELISA had a lower Sp (81%) than suggested by previous studies. 26,31 Sensitivity of the card test was also lower than suggested by previous literature 26 when estimated relative to qPCR. PCR frequently are considered to have high diagnostic Sp, 7,13,22,24 suggesting that it is a relatively good gold standard positive assay but can have less than perfect Se. When a test with almost perfect Sp but less than perfect Se (e.g., qPCR) is used as the reference standard, there will be some truly infected animals included in the noninfected group, but all noninfected animals will be correctly classified. Estimates of diagnostic accuracy for other tests (e.g., card, cELISA) calculated based on that reference standard will be in error because of this misclassifi-cation. It is therefore possible that the true Se of the MSP-5 cELISA and card test might be less than the relative estimates because of an underestimation of the number of false negative results.
Multinomial data used in statistical methods for the evaluation of tests for bovine anaplasmosis in 2,331 dairy cattle from 79 herds in Puerto Rico in which the true infection status was unknown. *
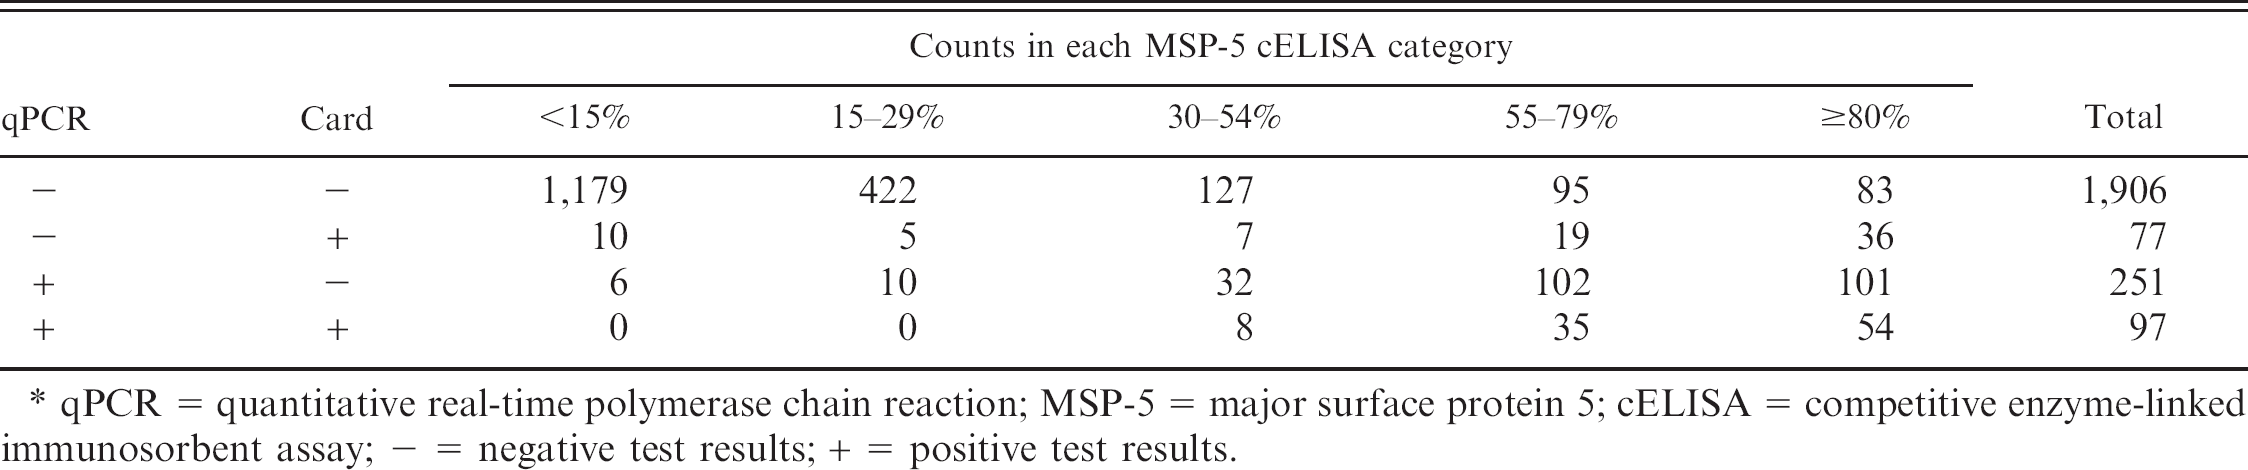
qPCR = quantitative real-time polymerase chain reaction; MSP-5 = major surface protein 5; cELISA = competitive enzyme-linked immunosorbent assay; − = negative test results; + = positive test results.
Estimates of bovine anaplasmosis prevalence and diagnostic test accuracy in 2,331 dairy cattle from 79 herds in Puerto Rico in which the true infection status was unknown (%).
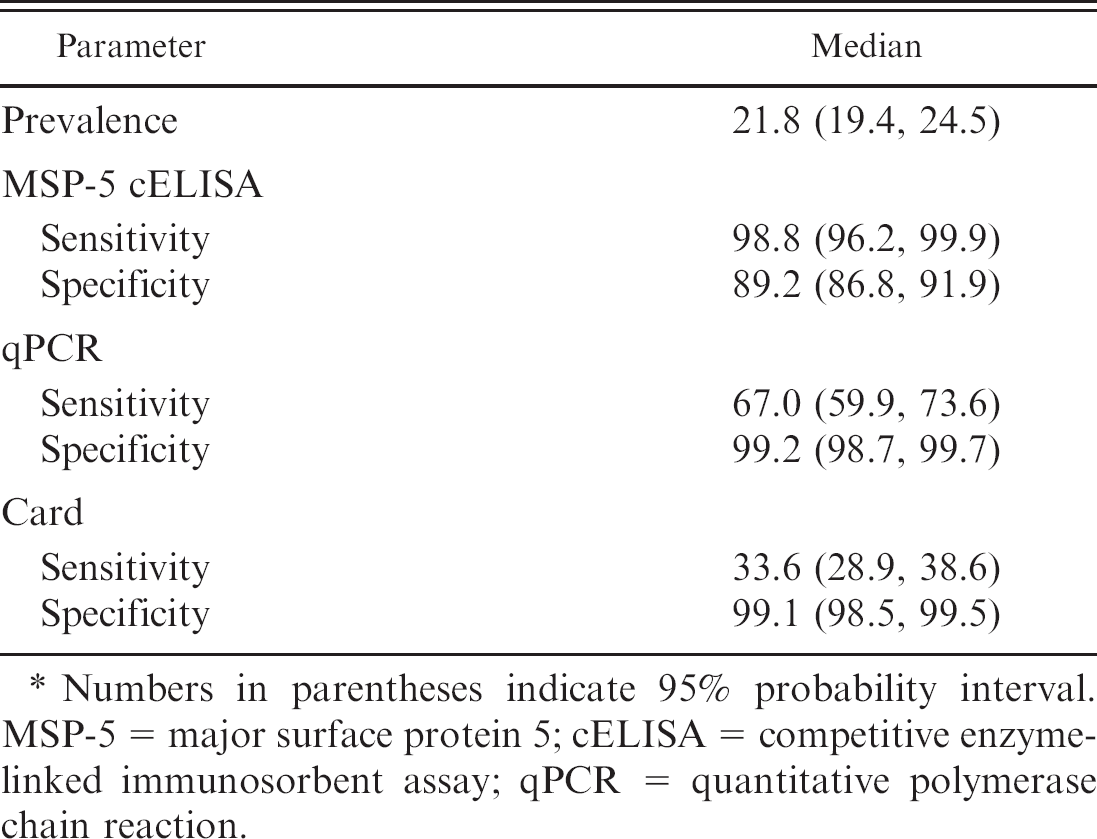
Numbers in parentheses indicate 95% probability interval. MSP-5 = major surface protein 5; cELISA = competitive enzyme-linked immunosorbent assay; qPCR = quantitative polymerase chain reaction.
Previous studies estimating the accuracy of various tests for bovine anaplasmosis have employed experimental infection or estimated relative measures of accuracy. 10,17,23,26,28,31 To the authors' knowledge, this is the first attempt at estimating accuracy of these tests using a Bayesian latent class approach. The MSP-5 cELISA had the highest accuracy of the 3 evaluated tests based on the dichotomous interpretation with a Youden index of 0.88. Sensitivity of the cELISA was estimated to be quite high (99%) suggesting that this assay would be an appropriate screening test in chronically infected or subclinical dairy cattle. The relatively low Sp (89%), however, suggested that in low-prevalence situations or in herds of undetermined infection status a more specific assay would be required to confirm positive cELISA results. The sensitivities of both qPCR and the card test were relatively low, suggesting that they would not be good first choices to use as screening tests. Both assays had high Sp, suggesting their possible use for confirmation. The specificities were comparable (99.2% vs. 99.1%), but the Se of qPCR was greater, and based on the biologic mechanisms of these tests, PCR should be considered a better choice for confirmatory testing. However, the card test might still have usefulness in some situations because of its low cost, technical simplicity, and rapidity of results.
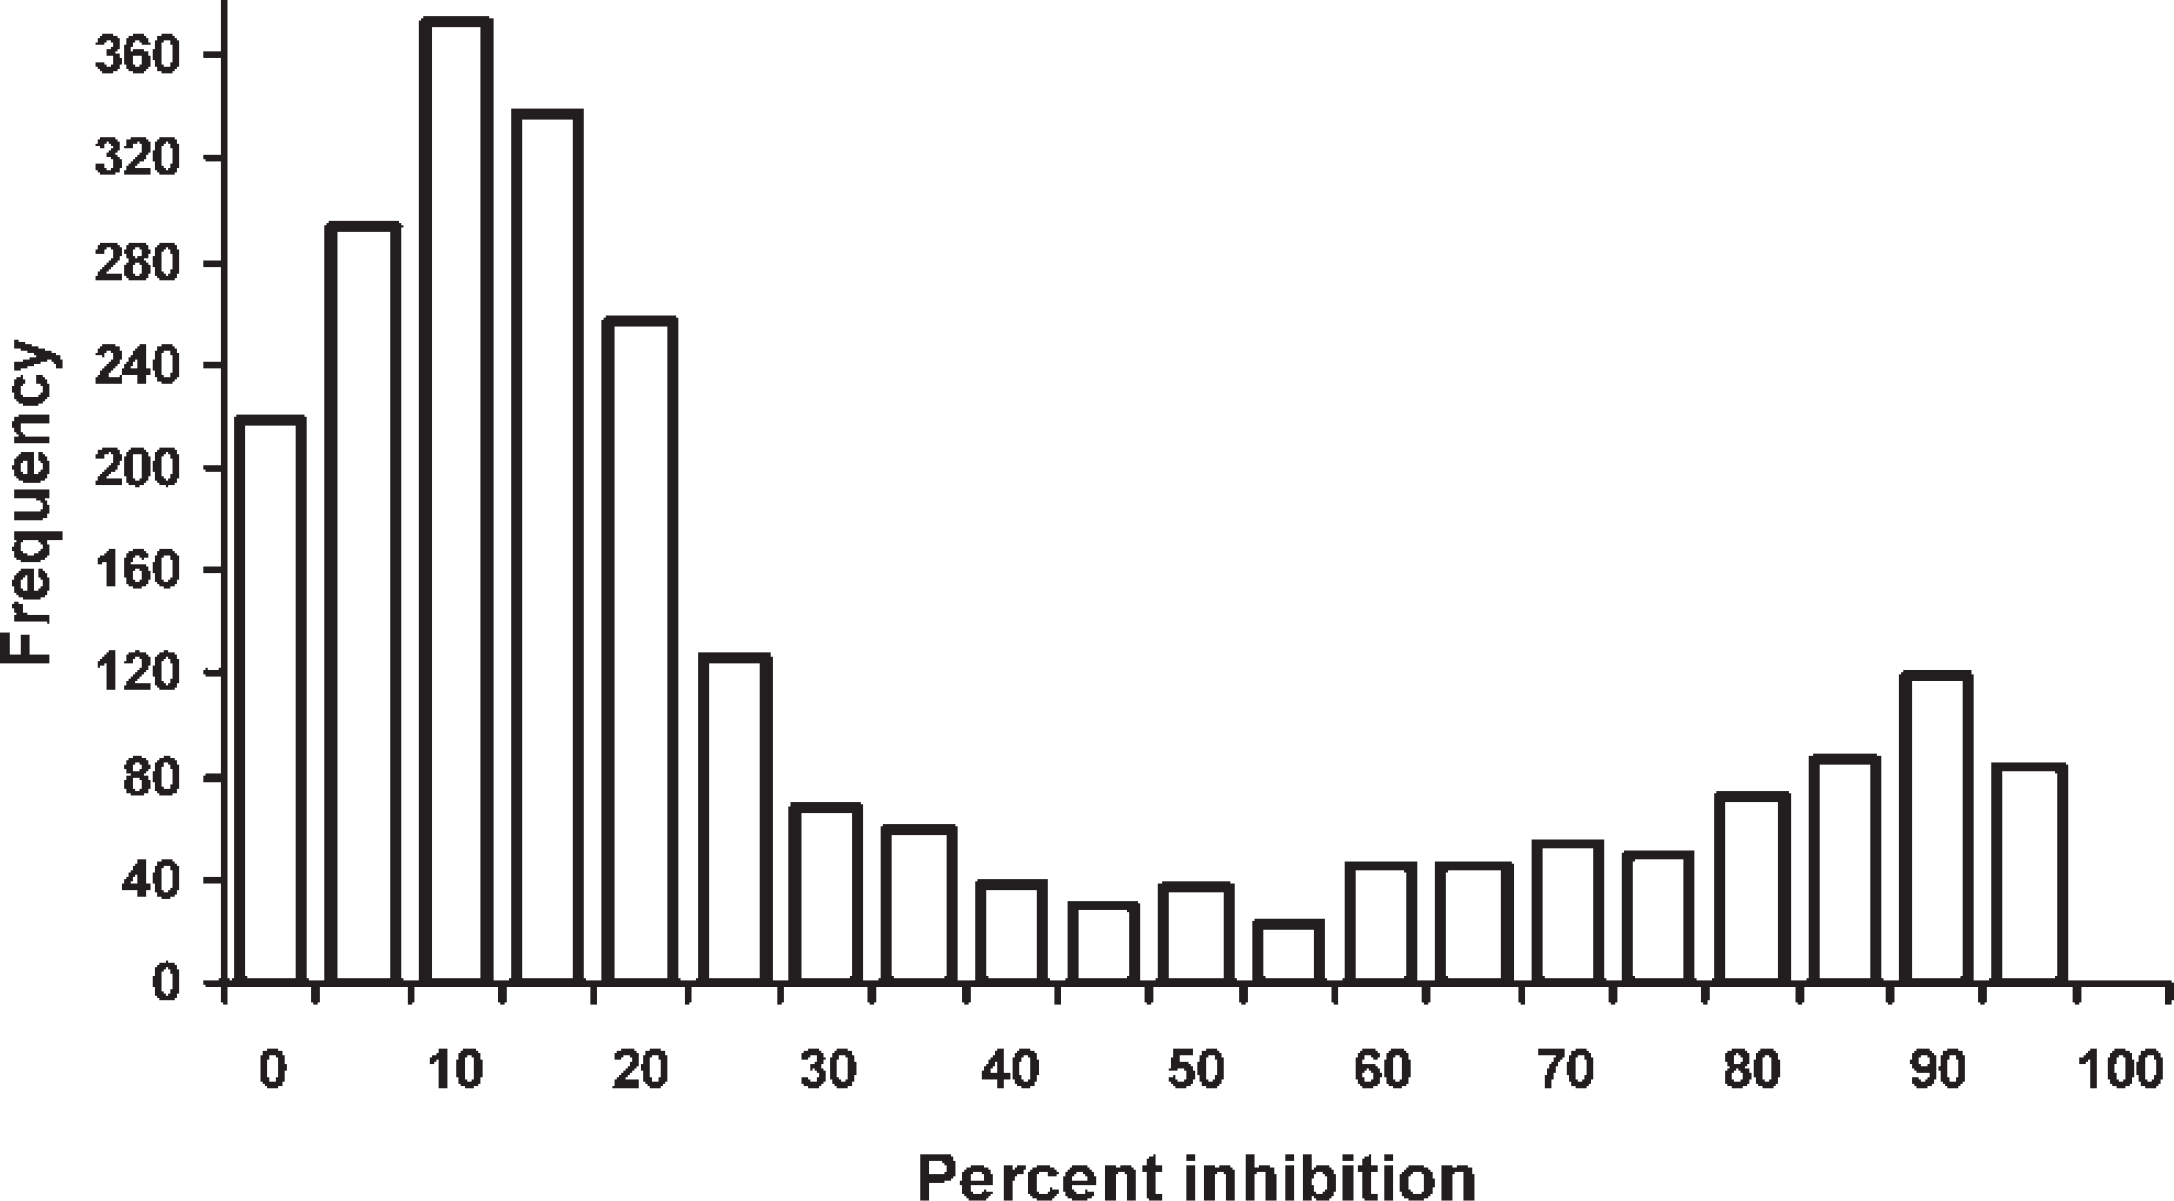
Distribution of bovine anaplasmosis serum major surface protein 5 competitive enzyme-linked immunosorbent assay results for 2,331 dairy cattle from 79 herds in Puerto Rico summed for 20 categories of percent inhibition values at 5% intervals. True infection status of animals was unknown.
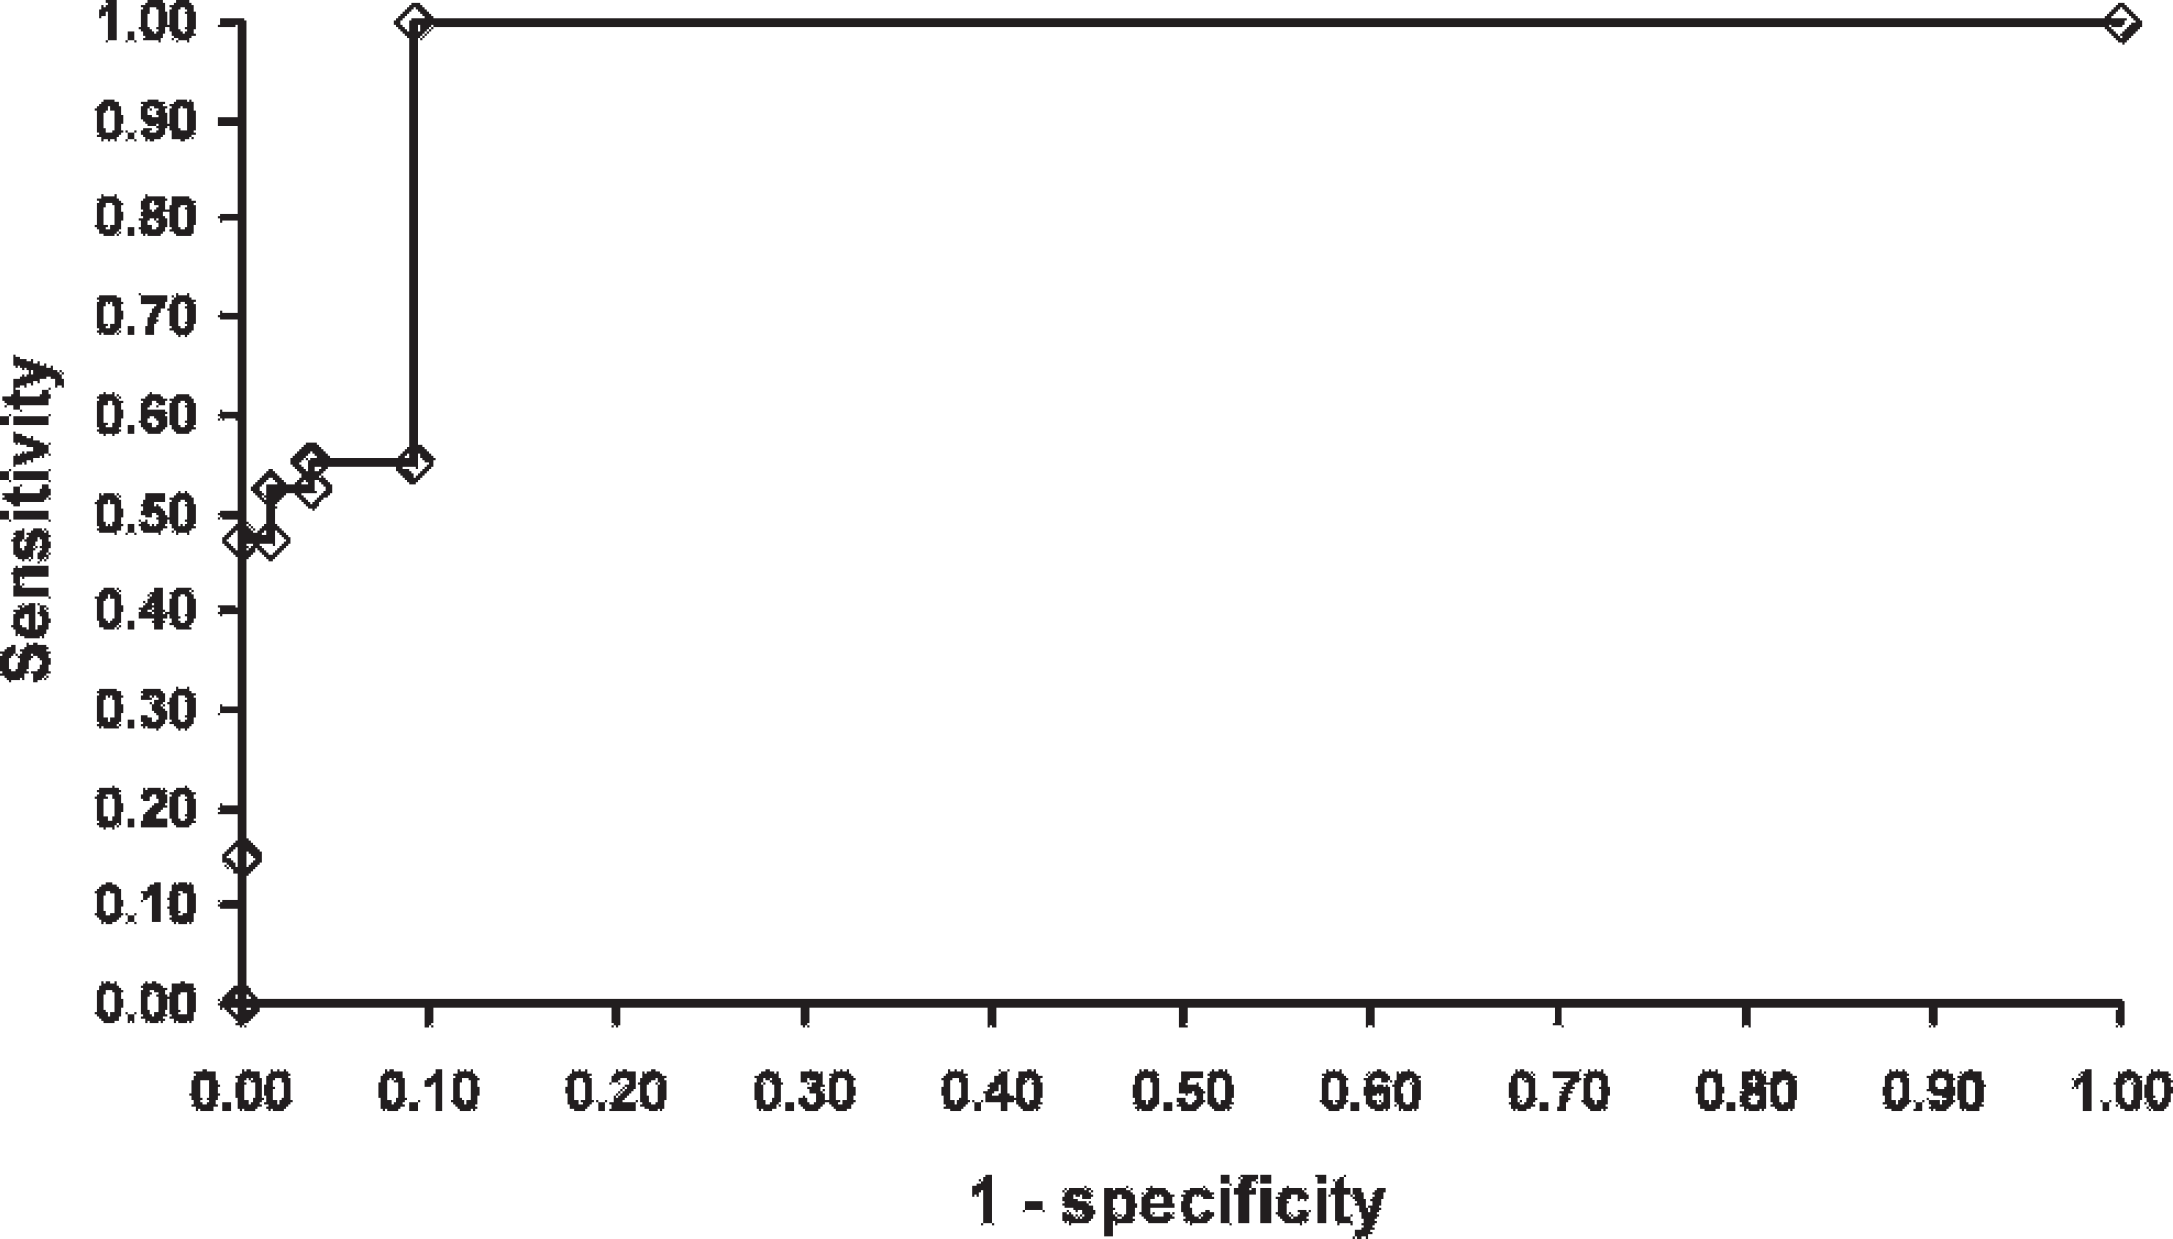
Receiver-operating characteristic curve for a bovine anaplasmosis serum major surface protein 5 competitive enzyme-linked immunosorbent assay evaluated at 4 cutoffs (15%, 30%, 55%, and 80% inhibition) for 2,331 dairy cattle from 79 herds in Puerto Rico when the true infection status of animals was unknown.
The overall accuracy of the MSP-5 cELISA was also evaluated over multiple cutoffs employing an empirical Bayesian approach. The quantitative results at the 30% inhibition cutoff were different than the results of the dichotomous model evaluated at this cutoff. The Se was noticeably lower (52% vs. 99%) and the Sp higher (96% vs. 89%). The accuracies of the qPCR and card test and the prevalence did not demonstrate variability to this same extent (data not shown). Uniform (uninformative) priors were employed for the Se and Sp of the MSP-5 cELISA, but informative priors were used on the other unknown parameters, and this might explain why other measures did not differ greatly between analytic approaches. Estimated likelihood ratios suggest that lower values in the MSP-5 cELISA might not be extremely effective at ruling out A. marginale infection (LR = 0.5), but results in the higher categories would be effective at ruling in infection (LR = 22–310).
Validation of assays is important, and employed study designs should be appropriate for the expected use of the test. Such studies need to consider both sources of systematic and random error. Selection bias is a systematic error that can occur when the animals studied do not reflect the target population of the assay. The target population of this evaluation was clinically healthy adult lactating dairy cattle of Puerto Rico. A benefit of latent class analyses is that the target population can be accurately sampled without the concern of identifying animals that are considered gold standard positive or negative based on criteria that might make them systematically different than the proposed target population. Another important source of error in validation studies is the method of gold standard, or true status determination. Relative measures of accuracy are frequently estimated, but these will be biased when the reference test is not perfect. Despite their limitation, relative measures can be especially useful when the reference test has near perfect Sp and is the consensus test of choice for the condition under evaluation. Examples of common reference tests for the determination of relative accuracies include agent isolation techniques or histopathologic examinations.
Latent class analyses for test validation do not require identification of a reference test or the prior determination of the true disease status for sampled animals. This benefit comes at the cost of trading a biological definition of disease (or affected) for a statistical model that in essence estimates the probability of disease (or affected) in each category of test results (cross-classified table of counts). Unknown parameters are found that are most likely given the statistical model and observed data without any researcher control over disease definition. The shape of the likelihood function for the data and identification of the most likely values for diagnostic accuracy occur within complex systems and over multidimensional parameter spaces. Models based on the results of 2 tests in 2 populations have been studied to a greater extent than more complicated models. The variation in results for MSP-5 cELISA accuracy across the 2 modeling approaches likely reflects the complexity of the quantitative model.
Latent class modeling approaches require making strong assumptions that should be assessed. 30 These assumptions include different disease prevalence among sampled populations, equal diagnostic accuracy across populations, and conditional independence between tests. The employed model assumed results were from a single population, so the only relevant assumption is the conditional independence between tests. The 2 serologic tests, MSP-5 cELISA and card test, might be expected to be conditionally dependent within truly affected cattle because they are both designed to detect antibodies specific for A. marginale infection. The acid buffering of the card antigen 2 suggests that it might preferentially detect bovine immunoglobulin of the immunoglobulin G1 (IgG1) subclass as has been reported for the brucellosis agglutination tests. 1 The buffered pH of the anaplasma card test is higher than the brucellosis card test, and therefore the true subclass binding specificity is unknown. The cELISA should detect multiple antibody subclasses because all can compete with the monoclonal antibody for the antigen-binding sites on the ELISA plate. The possibility of important dependence terms was not assessed, however, because the 3-test single population model only provides 7 degrees of freedom for estimation, and there were already 7 unknown parameters (3 Se, 3 Sp, and prevalence). An additional conditional dependence term would make the number of unknown parameters greater than the number of degrees of freedom available for estimation. Incorporation of informative prior information in a Bayesian framework can relax the degrees of freedom requirement. However, the effect of adding the conditional dependence term would not be distinguishable from identifiability problems that might develop. Another important assumption is that the prior probability distributions do not have excessive influence on the observed results. Findings of the sensitivity analysis did not identify prior probabilities as an important source of variation.
Bayesian statistical models might not converge and this problem occurs more frequently in situations involving complicated likelihood functions. Results from a model that does not converge should not be used to make inferences. Convergence problems can occur if the assumptions of the statistical model are violated, if the model is not specified correctly, and if data do not contain enough information to estimate all unknown parameters. Convergence and model misspecification are serious problems that must be addressed for the valid interpretation of results from these analyses. All evaluated models appeared to converge, and this issue should not have adversely affected presented results.
Bovine anaplasmosis is an economically important condition of cattle in tropical and subtropical regions of the world. Control of this disease requires the development of economic and feasible testing strategies based on sound scientific principles. The MSP-5 cELISA appears to be the test of choice for screening subclinical cattle based on the high estimated Se, rapidity of results, relative low cost, and ease of standardization. The high estimated Sp of qPCR suggests that it would be an effective confirmatory test for cELISA-positive cattle. Confirmation would be necessary to increase the positive predictive value in low-prevalence-testing situations and when infection status (of animal or herd) must be known with a high degree of confidence. The card test would likely not be as effective for confirmation of cELISA-positive cattle despite the high estimated Sp because results could be conditionally dependent within truly infected cattle. The card test, however, might be useful when qPCR confirmation is not possible because of time, cost, and availability constraints. Though not evaluated in this study, the card test might also show promise for diagnosis in clinically affected cattle because of the high Sp, low cost, and the ability to perform the test in the field.
Acknowledgements
This manuscript was prepared in part through financial support by the U.S. Department of Agriculture, Cooperative State Research, Education, and Extension Service, Grant no. 2005-34135-18020 in Tropical/Subtropical Agriculture Research, National Research Initiative Award no. 2005-35204-16087, Fondo para el Fomento de la Industria Lechera de Puerto Rico, and the Colegio de Médicos Veterinarios de Puerto Rico.
Footnotes
a.
Qiagen Inc., Valencia, CA.
b.
TaqMan® Fast Universal PCR Master Mix (2x), No AmpErase® UNG (PN 4352042), Applied Biosystems, Foster City, CA.
c.
7500 Fast Real-Time PCR System, Applied Biosystems, Foster City, CA.
d.
Reagent 140-CMP, National Veterinary Services Laboratories, Ames, IA.
e.
Anaplasma Antibody Test Kit, cELISA, catalog no. 282-5; VMRD Inc., Pullman, WA.
f.
ELX800, BIOTEK Instruments Inc., Winooski, VT.
g.
IDEXX xChek™ 3.2, IDEXX Laboratories, Inc., Westbrook, ME.
h.
Epi Info version 6.04d for Windows, Centers for Disease Control and Prevention, Atlanta, GA.
i.
WinBUGS Version 1.4, MRC Biostatistics Unit, Cambridge, U.K.