
Abstract
In the current study, a rapid chromatographic immunoassay submitted for registration in Europe was used to analyze PrPsc in 13 different areas of brain from 10 confirmed classical scrapie cases. The levels of PrPsc in the different areas of brain were plotted to draw a brain PrPsc distribution curve. This curve was compared with the brain PrPsc distribution curve obtained from immunoblotting and immunohistochemistry tests on the same samples. The distribution of PrPsc in different areas of the brain was similar, irrespective of the test applied, indicating that any of the 3 tests could be used for the characterization of classical cases of scrapie.
A rapid chromatographic immunoassay kit a was developed to diagnose bovine spongiform encephalopathy (BSE). An extension of this kit, used to diagnose transmissible spongiform encephalopathy (TSE) in small ruminants, b has been submitted for registration in Europe. Rapid tests have been evaluated previously to characterize TSE cases in comparison to immunohistochemistry (IHC) against PrPsc. 1 Based on previous studies, the brain PrPsc distribution curve (BPDC) was developed as an analytical tool to rapidly characterize TSE cases by examining the extent of PrPsc deposition in the brain. 4,5 The aim of the present study was to assess the performance of the new rapid test b for classical scrapie diagnosis and also its ability to detect PrPsc in different areas of the brain. The results were compared with IHC detection of PrPsc as one of the gold standards for postmortem TSE confirmation and to an immunoblotting detection kit. c
Ten adult female Rasa Aragonesa sheep (ARQ/ARQ) older than 18 months that were diagnosed positive for scrapie by means of third eyelid biopsy were included in the present study, along with 2 control sheep. All scrapie cases were diagnosed within the framework of the National TSE Surveillance Programme at the Spanish National Reference Centre for TSE diagnostics (Zaragoza, Spain). Scrapie status was determined in vivo via neurological examination and/or third eyelid biopsy. The animals were obtained from 5 different outbreaks of scrapie. Further flock screening allowed identification and clinical examination of other scrapie cases within these flocks. Cases for study were selected based on confirmation of scrapie status.
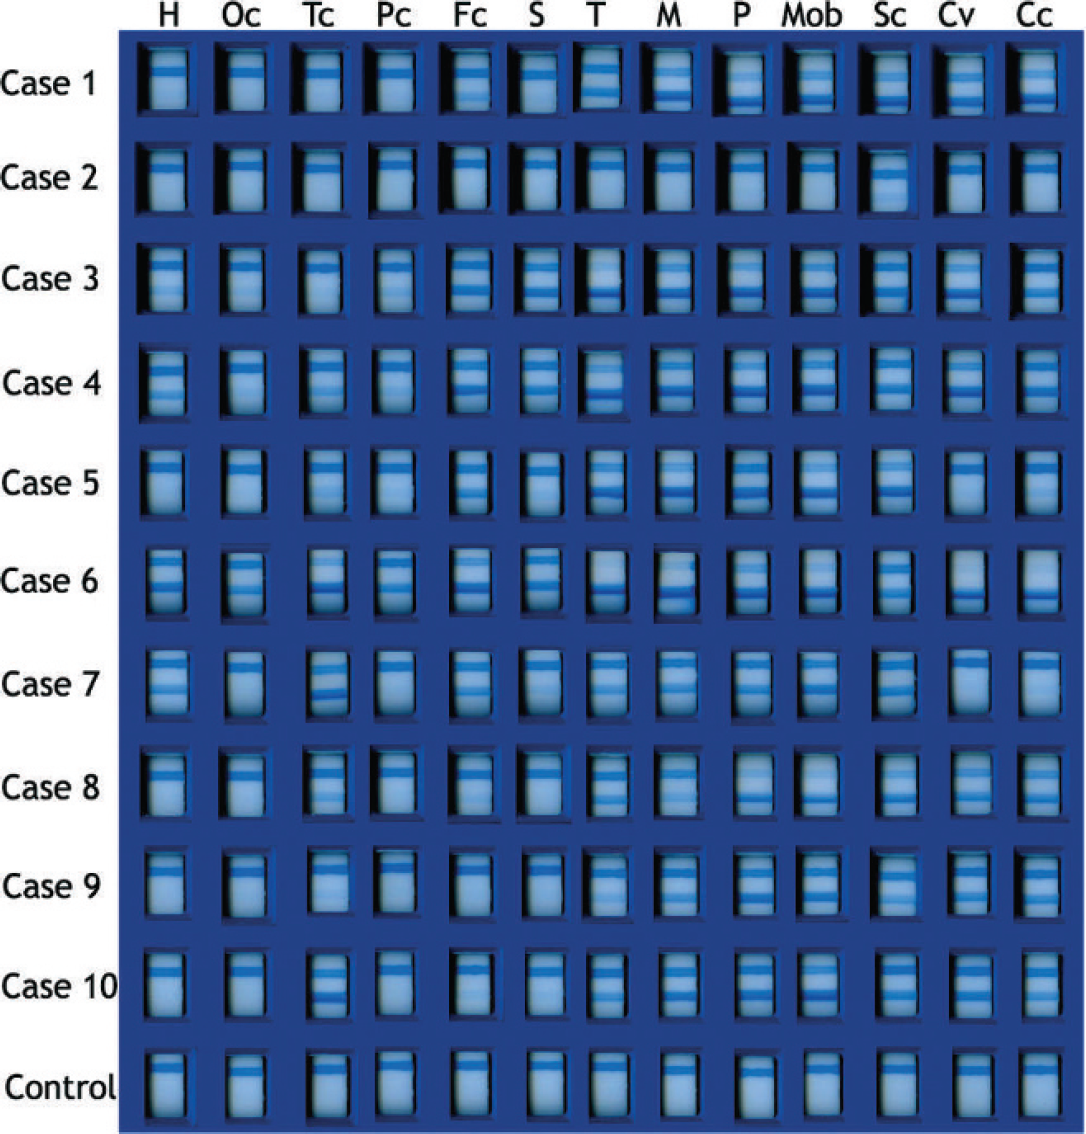
Scan of the chromatographic immunoassay strips from all cases studied. H = hippocampus; Oc = occipital cortex; Tc = temporal cortex; Pc = parietal cortex; Fc = frontal cortex; S = striatum (includes caudate and lenticular nuclei); T = thalamus; M = mesencephalon; P = pons; Mob = medulla oblongata; Sc = spinal cord; Cv = cerebellar vermis; Cc = cerebellar hemispheres.
After preliminary necropsy, the whole brain was removed; one half was immediately frozen for rapid tests, and the remaining half was immediately immersed in 10% phosphate buffered formalin for 10 days. After fixation, 4-mm–thick tissue sections were blocked and immersed in 98% formic acid for 1 hr to reduce prion infectivity. Increasing concentrations of alcohol were used to dehydrate the tissues, which were then embedded in paraffin wax. Tissues were sectioned at 4-μm thickness and routinely stained with hematoxylin and eosin for microscopic evaluation of histologic changes. Replicate sections were cut and mounted on triethoxysilyl propylamine–treated glass slides for IHC. Thirteen regions of the central nervous system were sampled (see Fig. 1 legend). For rapid tests, samples were homogenized at 10% w/v with the kit homogenization buffer. The experimental procedure (PI02/08) was approved by the University of Zaragoza Ethical Committee.
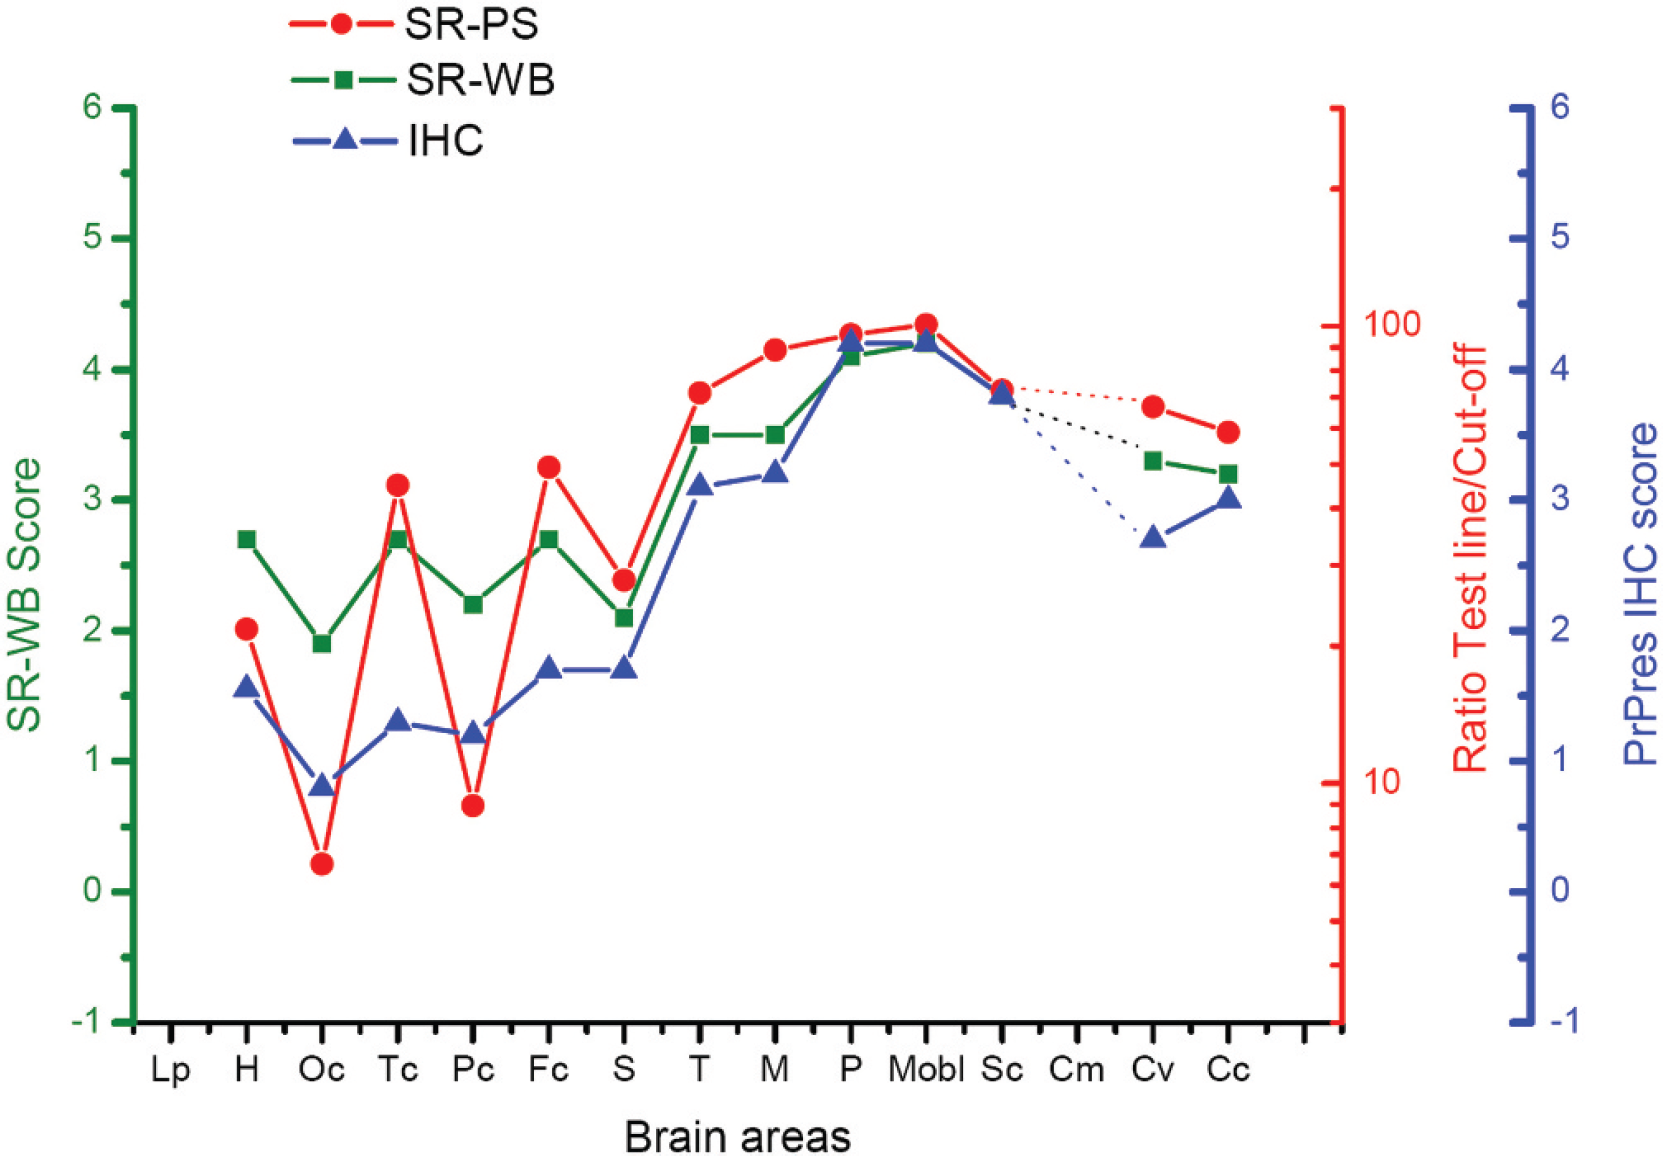
Average brain PrPsc distribution curve (BPDC) graphs of the 10 classical scrapie cases assessed with the following techniques: chromatographic immunoassay, immunoblotting, and immunohistochemistry (IHC). The morphology of the graphs is parallel, indicating that the 3 techniques are equally valid to construct the BPDC graphs. Note that each graph has its own scale. The ratio between the discrimination value and the densitometric reading of the test line was plotted for the chromatographic immunoassay results in a log10 scale as a function of the brain area. To allow a comparison of the chromatographic immunoassay results with those of the immunoblotting and IHC analysis, values below 0.05 in the chromatographic immunoassay were set equal to 0.05 to show up in the graph. Otherwise, since a logarithmic scale was used, a gap would appear in the graph for values between 0.05 and 0. See brain area abbreviations in the legend to Figure 1. Lp = piriform lobe; Cm = cerebellar medulla.
The rapid test kits were used according to the manufacturer's instructions. Briefly, the chromatographic immunoassay kit b used 100-μl aliquots of brain tissue homogenates, which were digested with proteinase K (PK) for 1 hr at 47°C. The digestion was stopped, and samples were preincubated with assay buffer containing the anti-PrP detection antibody conjugated to blue-colored latex beads. The chromatographic immunoassay kit b used combs that were lowered into the sample mixture. The antibody-prion protein complexes subsequently migrated up the strips and were bound at the test line with the sprayed capture antibody. Uncomplexed antibodies bound the support matrix at the control line. Interpretation of the results was performed either visually or by densitometric analysis. The samples were considered negative if only the control line was visible. If both the control and the test line were visible, the samples were classified as positive. All samples were processed simultaneously, and the corresponding results are presented in Figure 1.
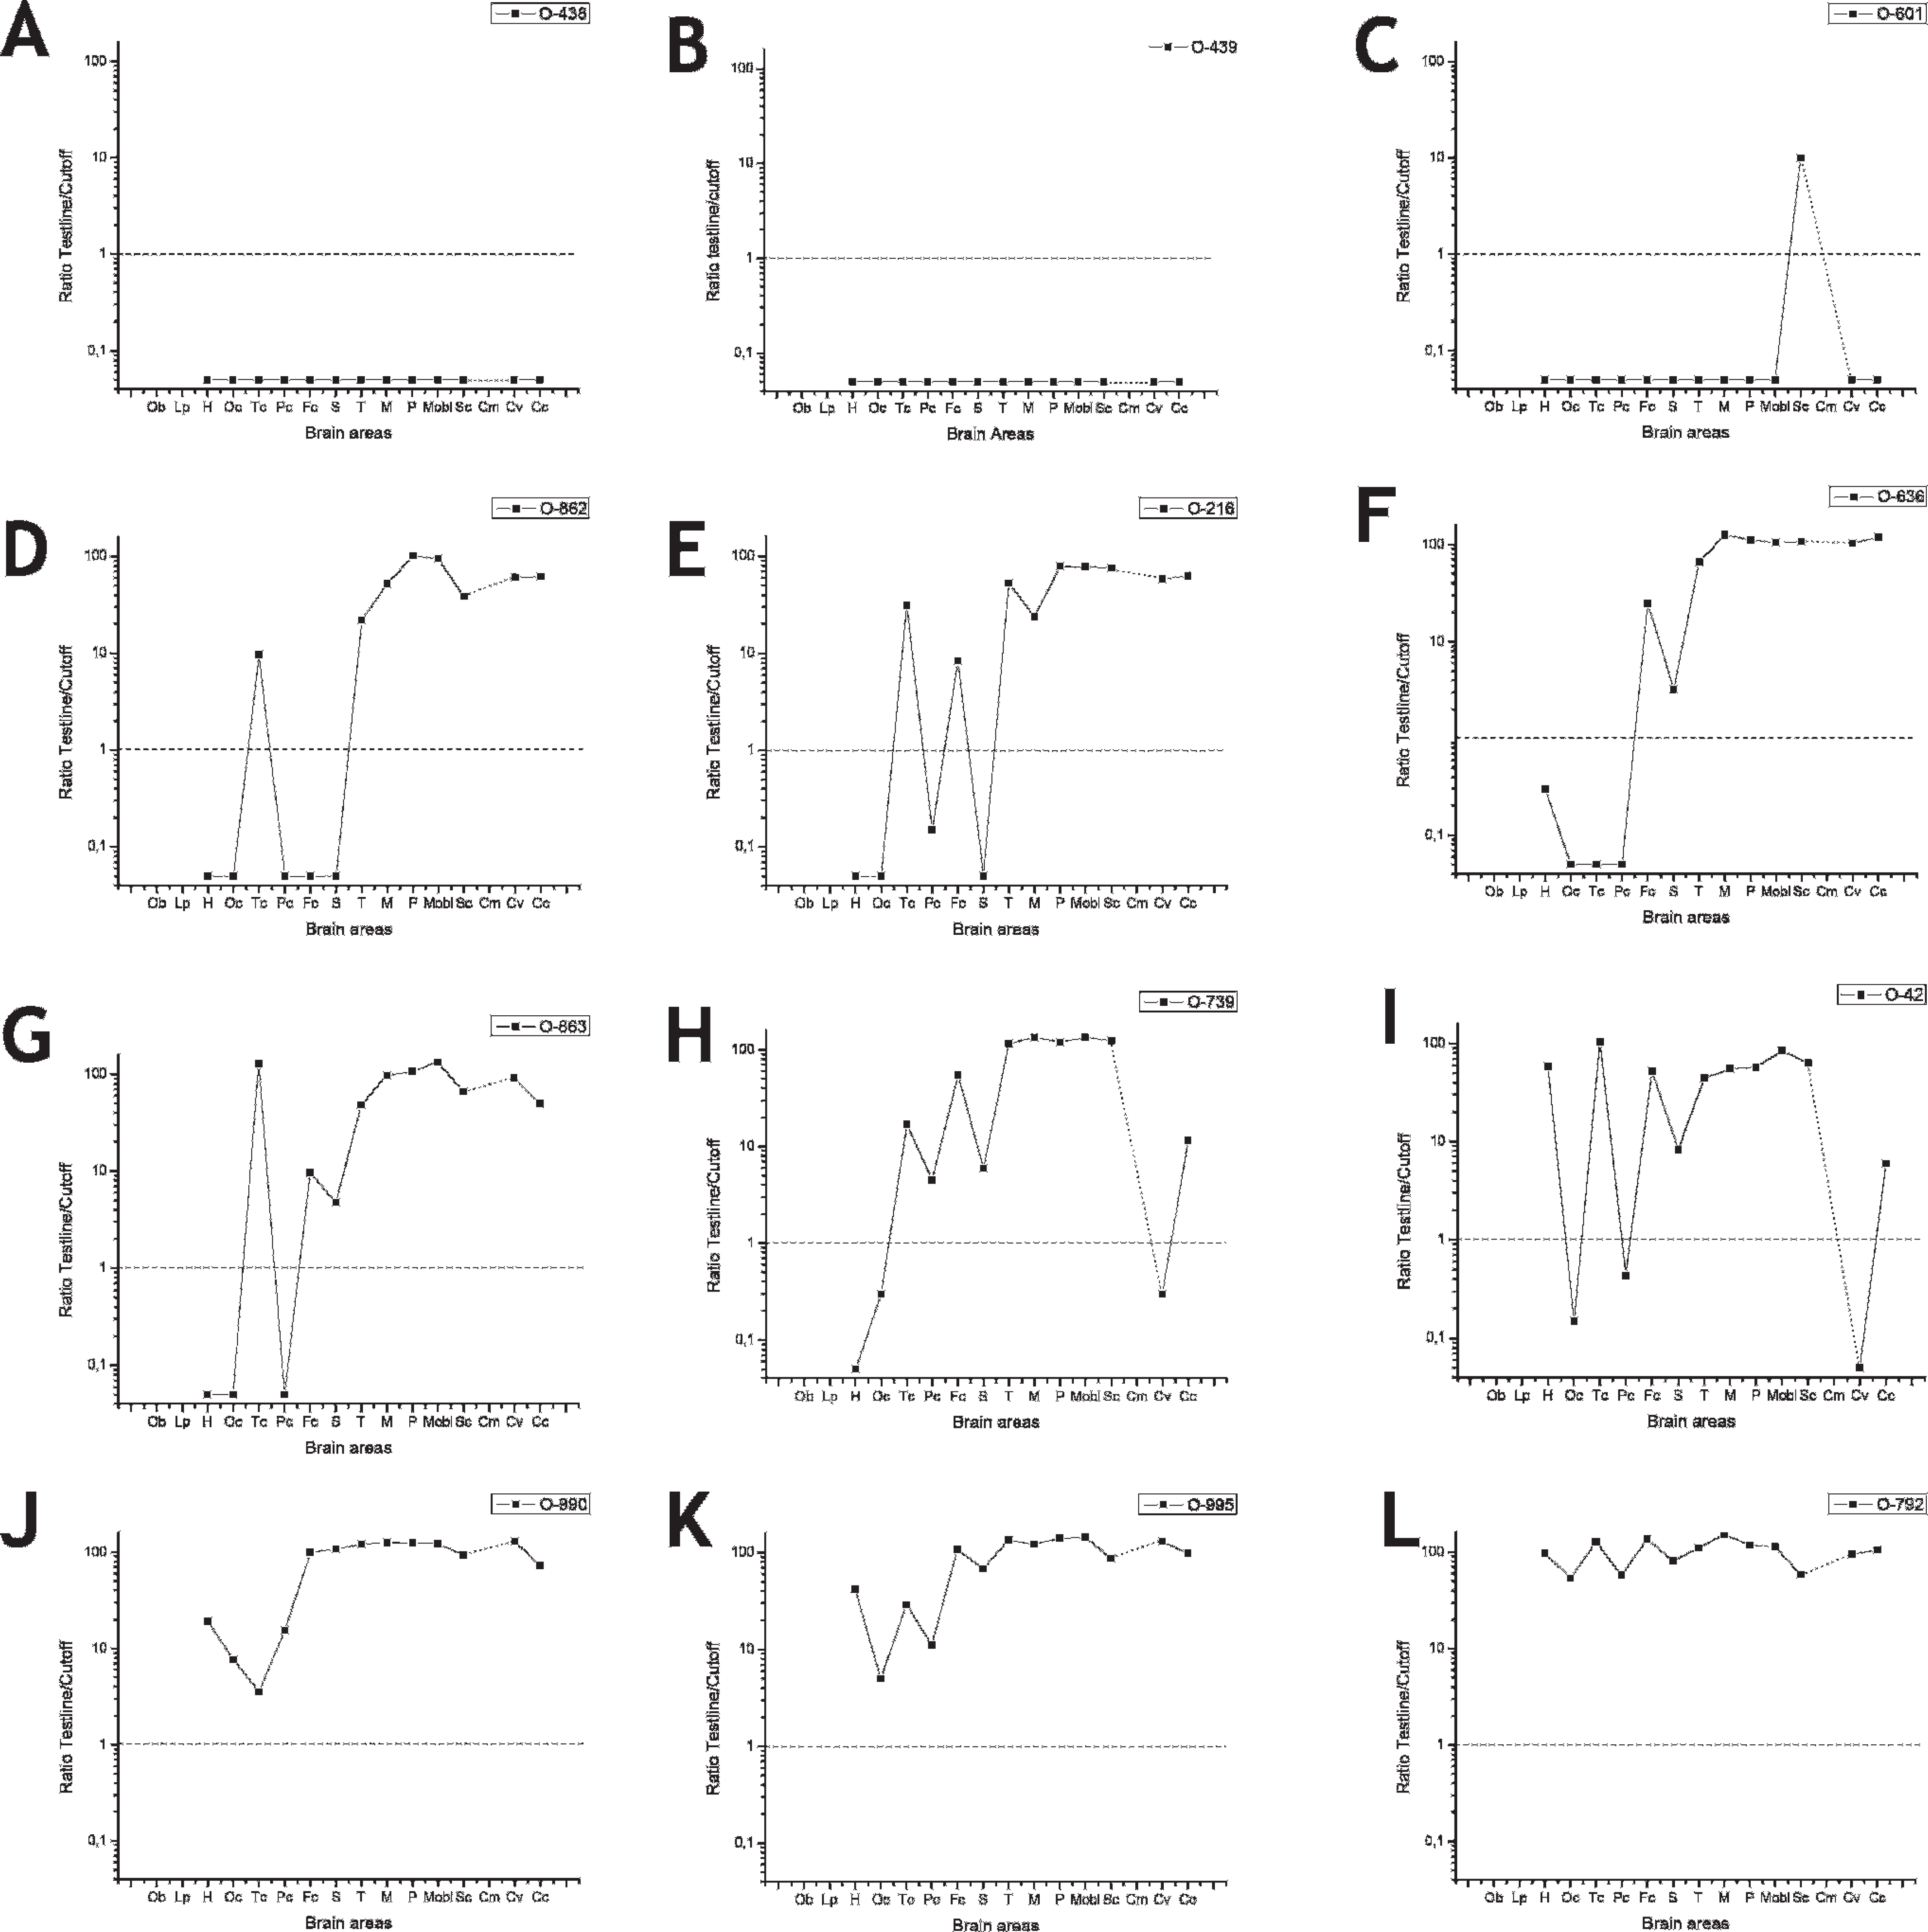
Brain PrPsc distribution curve (BPDC) graphs of the 10 scrapie cases (C–L) and 2 control sheep (A and B) obtained with the chromatographic immunoassay. The vertical axis shows the ratio between the densitometry reading of the test line and the discrimination value and the horizontal axis shows the brain areas studied. The dashed line indicates the discrimination value (i.e., dots below the line indicate the area is negative for PrPsc). The cases have been ordered from the least affected (C) to most affected (L) according to the shape of the BPDC. See brain area abbreviations in the legends to Figures 1 and 2. Ob = olfactory bulb.
For densitometric analysis d of the test strips, the discrimination value of the lot was 60 relative density units. Above this value, samples were considered positive, which allowed an objective evaluation of the results and quantification of the level of PrPsc deposits in each area of the brain. The BPDC was constructed as described previously. 4 Briefly, the ratio between the discrimination value and the densitometric reading of the test line was plotted in a log10 scale as a function of the brain area.
The immunoblotting c procedure also involved an initial PK digestion step of the homogenized brain tissue after which samples were denatured and electrophoresed in an sodium dodecyl sulfate–polyacrylamide gel. Proteins were then transferred to a polyvinylidene fluoride membrane, and PrPsc were detected by means of an anti-PrPsc monoclonal antibody and a secondary antibody conjugated to a chemiluminescent system. The data obtained by immunoblotting c were semiquantitatively given a visual score of 0 to 5 according to the intensity of the 3 PrPsc bands. Immunohistochemistry was done using the L42 f antibody against PrPsc as described previously. 3 Briefly, the applied pretreatments included immersion in formic acid for 15 min, PK e treatment for 15 min at 37°C (4 μg/ml), and hydrated autoclaving. After incubating with the primary antibody (1:500 dilution for 30 min), a polymer-bound secondary antibody visualization system was applied, g and 3,3′-diaminobenzidine was used as the chromogen substrate. A scrapie-positive brain tissue slide was included as a positive control, and a slide in which the primary antibody was omitted was included as a negative control to detect unspecific staining in each IHC run. PrPsc labeling was scored 0–5 semiquantitatively, with 0 indicating an absence of staining and 5 indicating maximum intensity immunolabeling. A BPDC was generated by plotting the PrPsc results obtained from IHC and both rapid tests versus the anatomical brain region. In the negative control animals, PrPsc was not detected in any of the regions studied.
The BPDCs obtained from classical scrapie cases showed a wide distribution of PrPsc throughout the brain with major involvement of the brain stem and cerebellar structures, irrespective of the technique used (Fig. 2). PrPsc deposition on the different cerebral lobes was more variable. The BPDCs obtained with the chromatographic immunoassay kit b for each individual case are presented in Figure 3. The shape of the BPDC obtained with the chromatographic immunoassay kit b (Fig. 2) paralleled the curves obtained by immunoblotting c and IHC, indicating that chromatographic immunoassay can be used to rapidly characterize classical cases of scrapie.
The PrPsc distribution observed, which was in agreement with neuroinvasion of the prion through the brain stem, was similar to that described for BSE cases but with a greater involvement of cortical structures. This could be explained by the fact that the cases included in the present study were in the clinical stage of the disease whereas the samples were supposedly preclinical in the BSE study. 4
When cases were examined separately, some differences were observed (Fig. 3). For example, a lack of PrPsc signals by both chromatographic immunoassay b and immunoblotting c existed primarily in the cerebral cortices. These areas stained weakly by IHC and reflected a slightly lower sensitivity of the rapid tests in these regions of the brain. The disagreement between results from the rapid tests and IHC might be partly explained by uneven distribution of PrPsc in the brain tissue, particularly in weakly positive samples. Differences in BPDC shape between single cases might be due to different disease progression or to PrPsc tropism associated with the prion strain. 2 Conversely, the chromatographic immunoassay kit b showed a diagnostic sensitivity of 100% on tissue samples from the medulla oblongata and the cervical spinal cord in classical cases of scrapie. These results are in accordance with those described for PrPBSE distribution BPDC in cattle. 5
In summary, results from the current study suggest that the scrapie rapid chromatographic immunoassay kit b is useful to generate BPDCs of classical scrapie infection in sheep. The BPDCs are comparable to those obtained by immunoblotting and IHC, but the rapid chromatographic immunoassay kit b has the advantage of being faster and easier to use. Moreover, an objective assessment of the signal can be obtained by densitometric analysis.
Acknowledgements. The authors wish to acknowledge Arancha Fran, Silvia Castejón, and Silvia Ruíz from the Research Centre for Prion and Emerging Diseases (University of Zaragoza, Spain) for assistance in sample processing. This study was supported by the Department of Agriculture of the Aragón Government and the Network of Excellence for Prion Diseases. Prionics AG is also acknowledged for supply of the rapid test kits.
Footnotes
a.
Prionics®-Check PrioSTRIP, Prionics AG, Schlieren-Zürich, Switzerland.
b.
Prionics®-Check PrioSTRIP SR, Prionics AG, Schlieren-Zürich, Switzerland.
c.
Prionics®-Check WESTERN SR, Prionics AG, Schlieren-Zürich, Switzerland.
d.
PrioSCAN®, Prionics AG, Schlieren-Zürich, Switzerland.
e.
Proteinase K, F. Hoffmann-La Roche AG, Basel, Switzerland.
f.
L42 Mouse monoclonal antibody, R-Biopharm AG, Darm stadt, Germany.
g.
EnVisionTM, Dako Denmark A/S, Glostrup, Denmark.