
Abstract
Asymmetric reverse transcription polymerase chain reaction (RT-PCR) and microarrays were combined to distinguish 4 viruses, including Avian influenza virus (AIV), Newcastle disease virus (NDV), Infectious bronchitis virus (IBV), and Infectious bursal disease virus (IBDV), and hemagglutinin (HA) subtypes H5, H7, and H9, and neuraminidase (NA) subtypes N1 and N2 of AIV. The AIV matrix protein (M), and HA and NA genes, IBV nucleoprotein (NP) gene, NDV NP gene, and IBDV A fragment gene were cloned into plasmids. These genes were amplified from these positive recombinant plasmids, which included the inserted target genes by PCR. The PCR products were purified and printed on the amino-modified slides as the probes. RNA was extracted from samples and labeled by asymmetric RT-PCR using a cyanine (Cy)3–labeled primers. The labeled complementary (c)DNA was hybridized to the probes immobilized on the glass slides. After hybridization, the microarrays were scanned, and the hybridization pattern agreed perfectly with the known location of each probe. No cross-hybridization could be detected. Results demonstrated that microarray based on asymmetric RT-PCR is an effective way to distinguish AIV, IBV, NDV, and IBDV simultaneously.
Introduction
Avian influenza and Newcastle disease are highly contagious diseases with high occurrence in poultry. 18,20 Infectious bronchitis and infectious bursal disease are also commonly observed diseases in poultry. 12,17 These infectious diseases seriously impact the health of the poultry industry. Because spread is associated with movement of infected birds or their products, the presence of these viruses is cause for concern. However, the key components for the prevention and treatment of these epidemic diseases are accurate, rapid, and highly specific methods of diagnosis. The detection methods for the causative agents of the above-mentioned diseases include virus isolation, hemagglutination inhibition (HI) tests, and reverse transcription polymerase chain reaction (RT-PCR), 1 all of which can only detect one disease in each round of testing. DNA microarray, also known as microarray technology, is a high-throughput, high-specificity, and high-sensitivity automated gene detection technology that can be used in parallel to detect hundreds of disease-related genes. 8,16 This powerful technique has been adopted by many biomedical disciplines and will likely have a profound impact on the diagnosis, treatment, and prognosis of diseases. 28 Compared with traditional detection methods, microarrays can be used to detect viruses that cause similar symptom diseases and subtype specificity of one virus 19 as well as variants of pathogenic microorganisms. In the current study, a detection method of microarrays in combination with asymmetric RT-PCR was developed to identify Avian influenza virus (AIV), Newcastle disease virus (NDV), Infectious bronchitis virus (IBV), Infectious bursal disease virus (IBDV), and the major subtypes of AIV.
Materials and methods
Viruses
A/Goose/Guangdong/1/96 (H5N1), A/African/starling/ 983/7 (H7N1), and A/Turkey/Wisconsin/1/66 (H9N2) were from the authors’ laboratory; IBV (LX4), IBDV, and NDV (F48E9) used in this study were kindly provided by the avian disease research groups at the Harbin Veterinary
Primers used in the current study. *
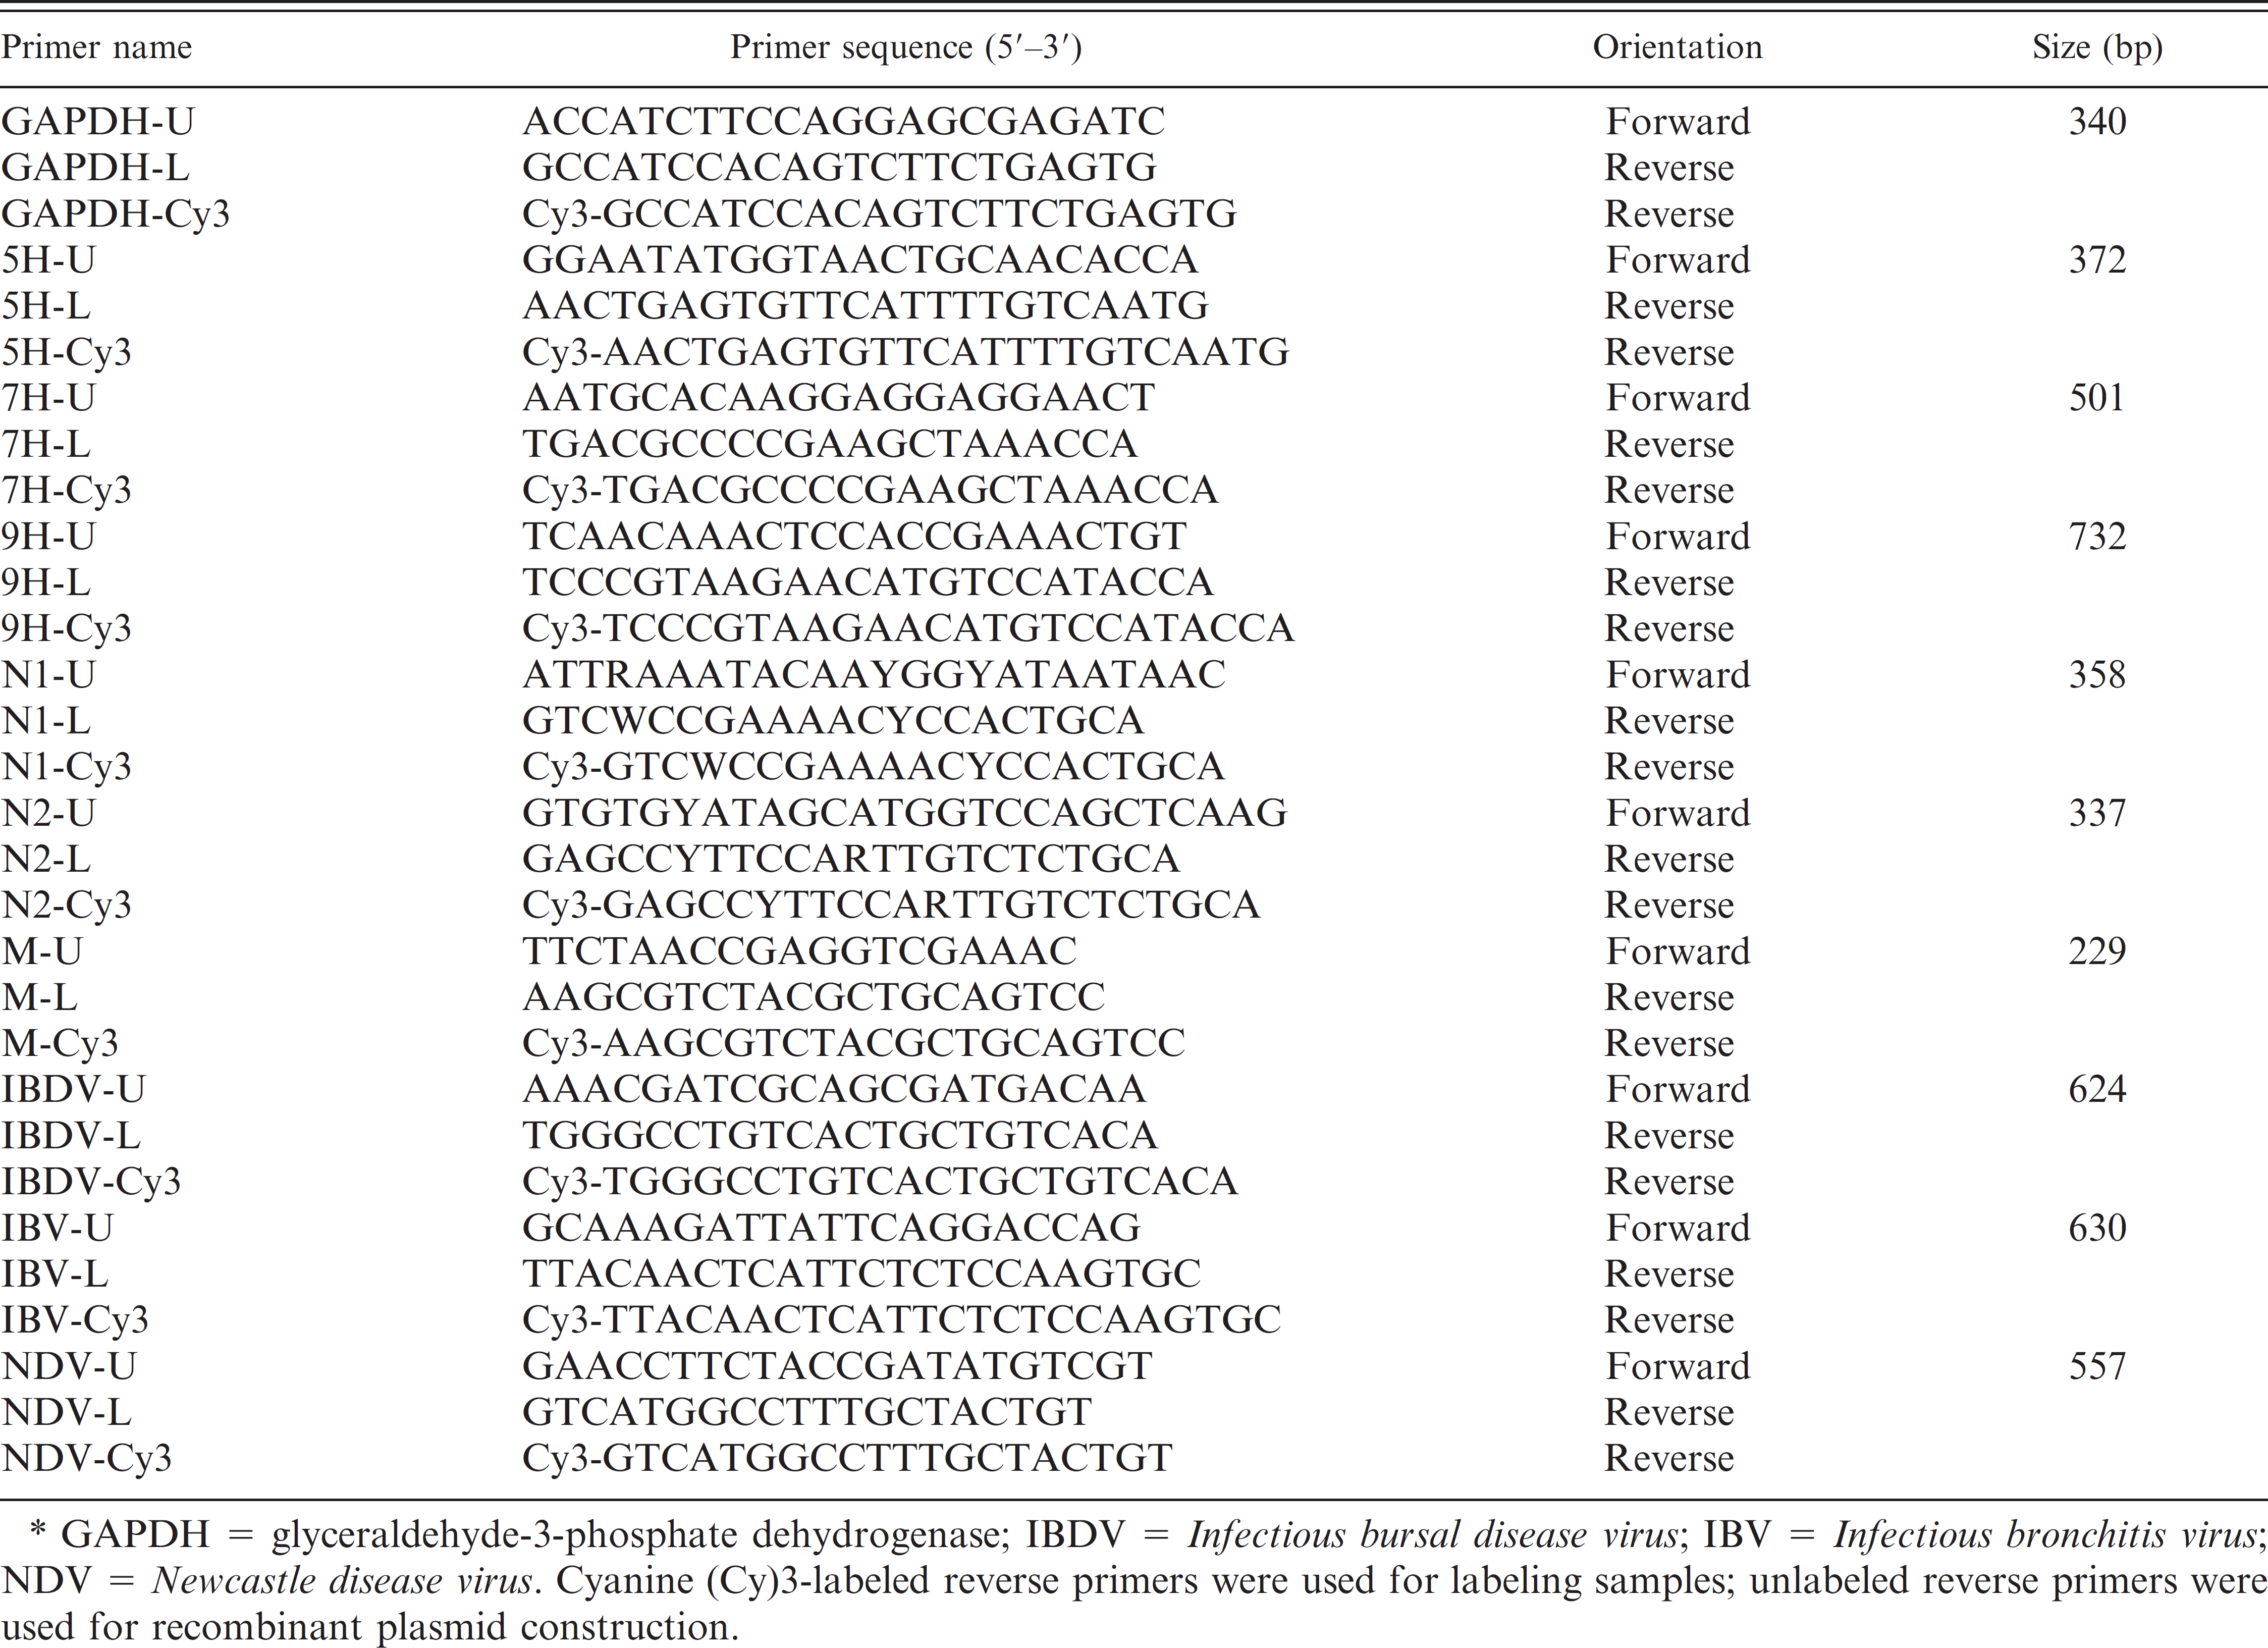
GAPDH = glyceraldehyde-3-phosphate dehydrogenase; IBDV = Infectious bursal disease virus; IBV = Infectious bronchitis virus; NDV = Newcastle disease virus. Cyanine (Cy)3-labeled reverse primers were used for labeling samples; unlabeled reverse primers were used for recombinant plasmid construction.
Research Institute of the Chinese Academy of Agricultural Sciences (Harbin, China).
Gene cloning and recombinant plasmid construction
According to sequences of AIV matrix protein (M) gene, AIV hemagglutinin (HA) genes (subtypes H5, H7, and H9), AIV neuraminidase (NA) genes (subtypes N1 and N2), NDV nucleoprotein (NP) gene, IBV NP gene, IBDV A fragment gene, and the reference gene (glyceraldehyde–3–phosphate dehydrogenase [GAPDH]), 10 pairs of oligonucleotide primers (Table 1) were designed using the Oligo version 6.0 b software. All reverse primers were synthesized twice; one time was unlabeled while the other time was labeled with cyanine (Cy)3 at its 5’ end. Target DNA fragments were amplified by RT-PCR using a commercial RT-PCR system. c The reaction mixture (total volume: 50 μl) consisted of 10 μl of 5x reaction buffer, 2 μl of 10 mmol/l deoxyribonucleotide triphosphate (dNTP), 2 μl of 25 mmol/l MgSO4, 2 μl of forward primer, 2 μl of unlabeled reverse primer, 1 μl of Avian myeloblastosis virus (AMV) d reverse transcriptase, 1 μl of Tf1 DNA polymerase, 25 μl of diethylpyrocarbonate (DEPC)-treated sterile double-distilled H2O, and 5 μl of RNA. The RT-PCR parameters were as follows: reverse transcription at 45°C for 45 min; predegeneration at 94°C for 2 min; 35 cycles of 94°C for 45 sec, 52°C for 45 sec, and 68°C for 60 sec; and a final extension at 68°C for 10 min. The PCR products were analyzed by electrophoresis in a 1.0% agarose gel, purified by using a commercial PCR purification kit, e cloned into the pMD18-T vector, f and the transformed cells were selected for PCR identification and sequencing. The positive recombinant plasmids were designated pMD18–H5, pMD18–H7, pMD18–H9, pMD18–N1, pMD18–N2, pMD18–M, pMD18–NDVnp, pMD18–IBVnp, pMD18–IBDVa, and pMD18–GAPDH.
Preparation probes
Polymerase chain reaction was performed for both the positive recombinant plasmid-containing probe sequences and the reference genes using unlabeled forward primers and reverse primers. Anhydrous alcohol was added to the PCR products (2.5 times volume) along with 3 M sodium acetate (1/10 volume), and the products were precipitated at −20°C. The concentrations were determined and adjusted to 1 μg/μl. After addition of an equivalent volume of printing buffer 7 (3– saline-sodium citrate [SSC], 1.5 mol betaine), the products were transferred to 384-well plates and stored at −20°C for printing.
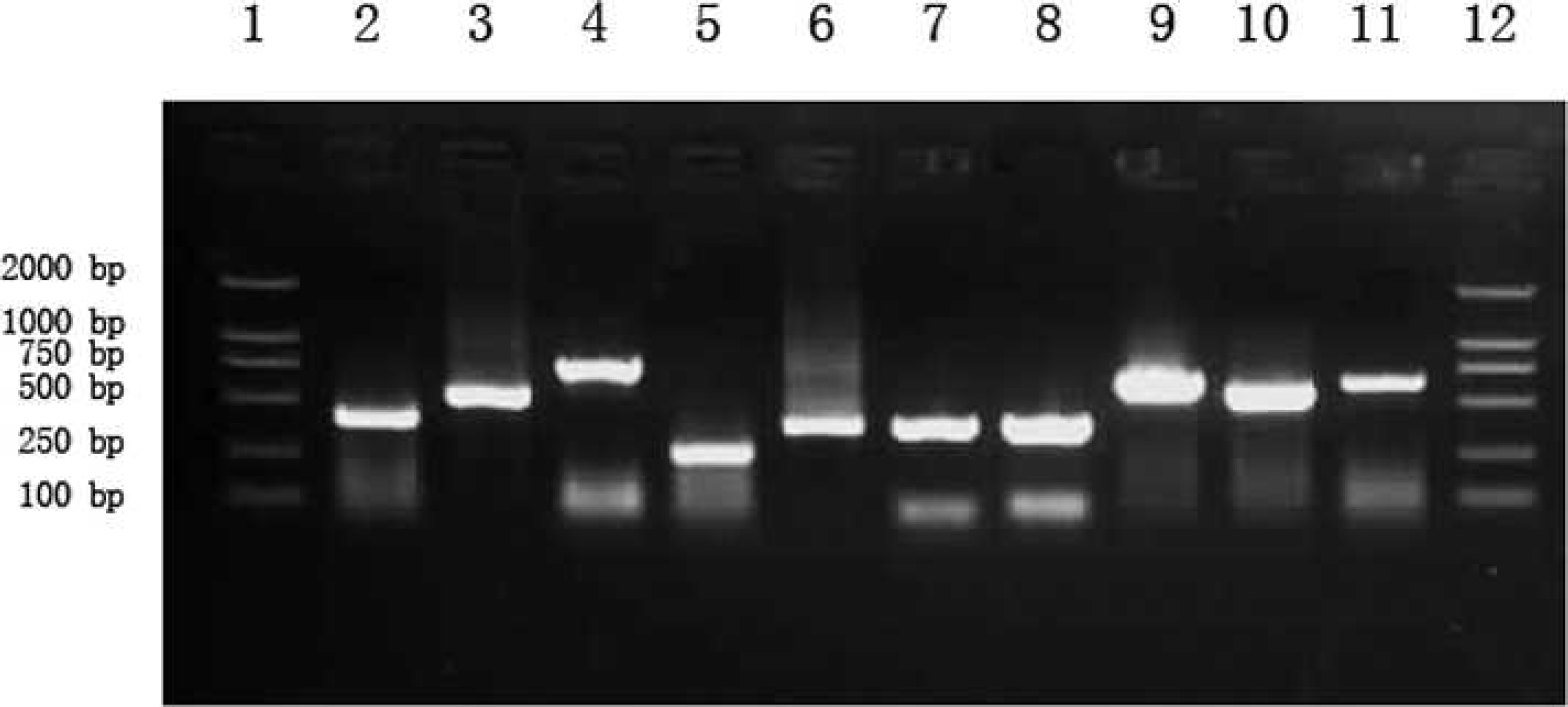
Identification of recombinant plasmids by polymerase chain reaction. Lane 1: DL2000 DNA markers; lane 2: H5; lane 3: H7; lane 4: H9; lane 5: M; lane 6: G; lane 7: N1; lane 8: N2; lane 9: Infectious bursal disease virus; lane 10: Newcastle disease virus; lane 11: Infectious bronchitis virus; lane 12: DL2000 DNA markers.
Microarray printing and processing
DNA microarrays were printed with microspotting pins g with 60% relative humidity and placed in a dry environment at room temperature for 20 hr. The microarrays were observed under microscope to determine the shapes of the point spots in the spotting matrix. Microarrays with leaking spots or connected spots were discarded, and good microarrays were rehydrated for 10 sec at 65°C and immediately placed in an 80°C dry environment. The DNA on the microarrays was fixed for 25 min by ultraviolet cross-linking at 254 nm wavelength. h The microarrays were washed with double-distilled H2O twice for 2 min each time, treated with sodium borohydride (75% phosphate buffered saline, 25% ethanol, and 0.1 M NaBH4) for blocking and denaturation, washed again for 2 min, air dried at room temperature, and stored dry in the dark at room temperature.
Preparation of samples
One-hundred microliters of a 1:1,000 dilution of the 4 viruses (containing antibiotics) were inoculated into the allantoic cavity according to standard procedures and incubated at 37°C for 3 days. Infective allantoic fluid was collected and stored at −20°C for RT-PCR. The collected AIV subtype H5N1 allantoic fluid (1:10) was diluted in sterile phosphate buffer solution (without antibiotics). The diluted virus (0.1 ml) was intravenously inoculated into ten 6–week-old specific pathogen-free (SPF) chicken. All animals were housed in negative pressure bio-secure facilities. Cloacal swab specimens were collected at 24, 48, and 72 hr postinfection, and tissue samples were collected postmortem. All samples were stored at −20°C for RT-PCR.
Preparation of labeled cDNA samples
Total RNA was extracted from samples using TRIzol LS i according to the manufacturer's instructions. The isolated RNA was subjected to 1-step RT-PCR amplification using a commercial RT-PCR system. c The reaction mixture (total volume: 50 μl) consisted of 10 μl of 5– reaction buffer, 2 μl of 10 mmol/l dNTP, 2 μl of 25 mmol/l MgSO4, 2 μl of forward primer, 2 μl of Cy3–labeled reverse primer, 1 μl of AMV d reverse transcriptase, 1 μl of Tf1 DNA polymerase, 25 μl of DEPC-treated sterile double distilled H2O, and 5 μl of RNA. The RT-PCR parameters were as follows: reverse transcription at 45°C for 45 min; predegeneration at 94°C for 2 min; 35 cycles of 94°C for 45 sec, 52°C for 45 sec, and 68°C for 60 sec; and a final extension at 68°C for 10 min. The PCR method was used to amplify and label the reference gene. 13 This reaction mixture (total volume: 100 μl) consisted of 10 μl of 10x PCR buffer, 4 μl of dNTP (mixed with Cy3–2'-deoxyuridine 5'-triphosphate [dUTP]), j 1 μl of Taq DNA recombinant polymerase (rTaq), k 2 μl of forward primer, 2 μl of Cy3–labeled reverse primer, 1 μl of GAPDH plasmid, and 80 μl of DEPC-treated sterile double distilled H2O. The thermal cycler conditions were 5 min of predenaturation at 95°C, followed by 35 cycles of 94°C for 45 sec, 53°C for 45 sec, and 72°C for 60 sec; and a final 10-min extension at 72°C. The PCR products were
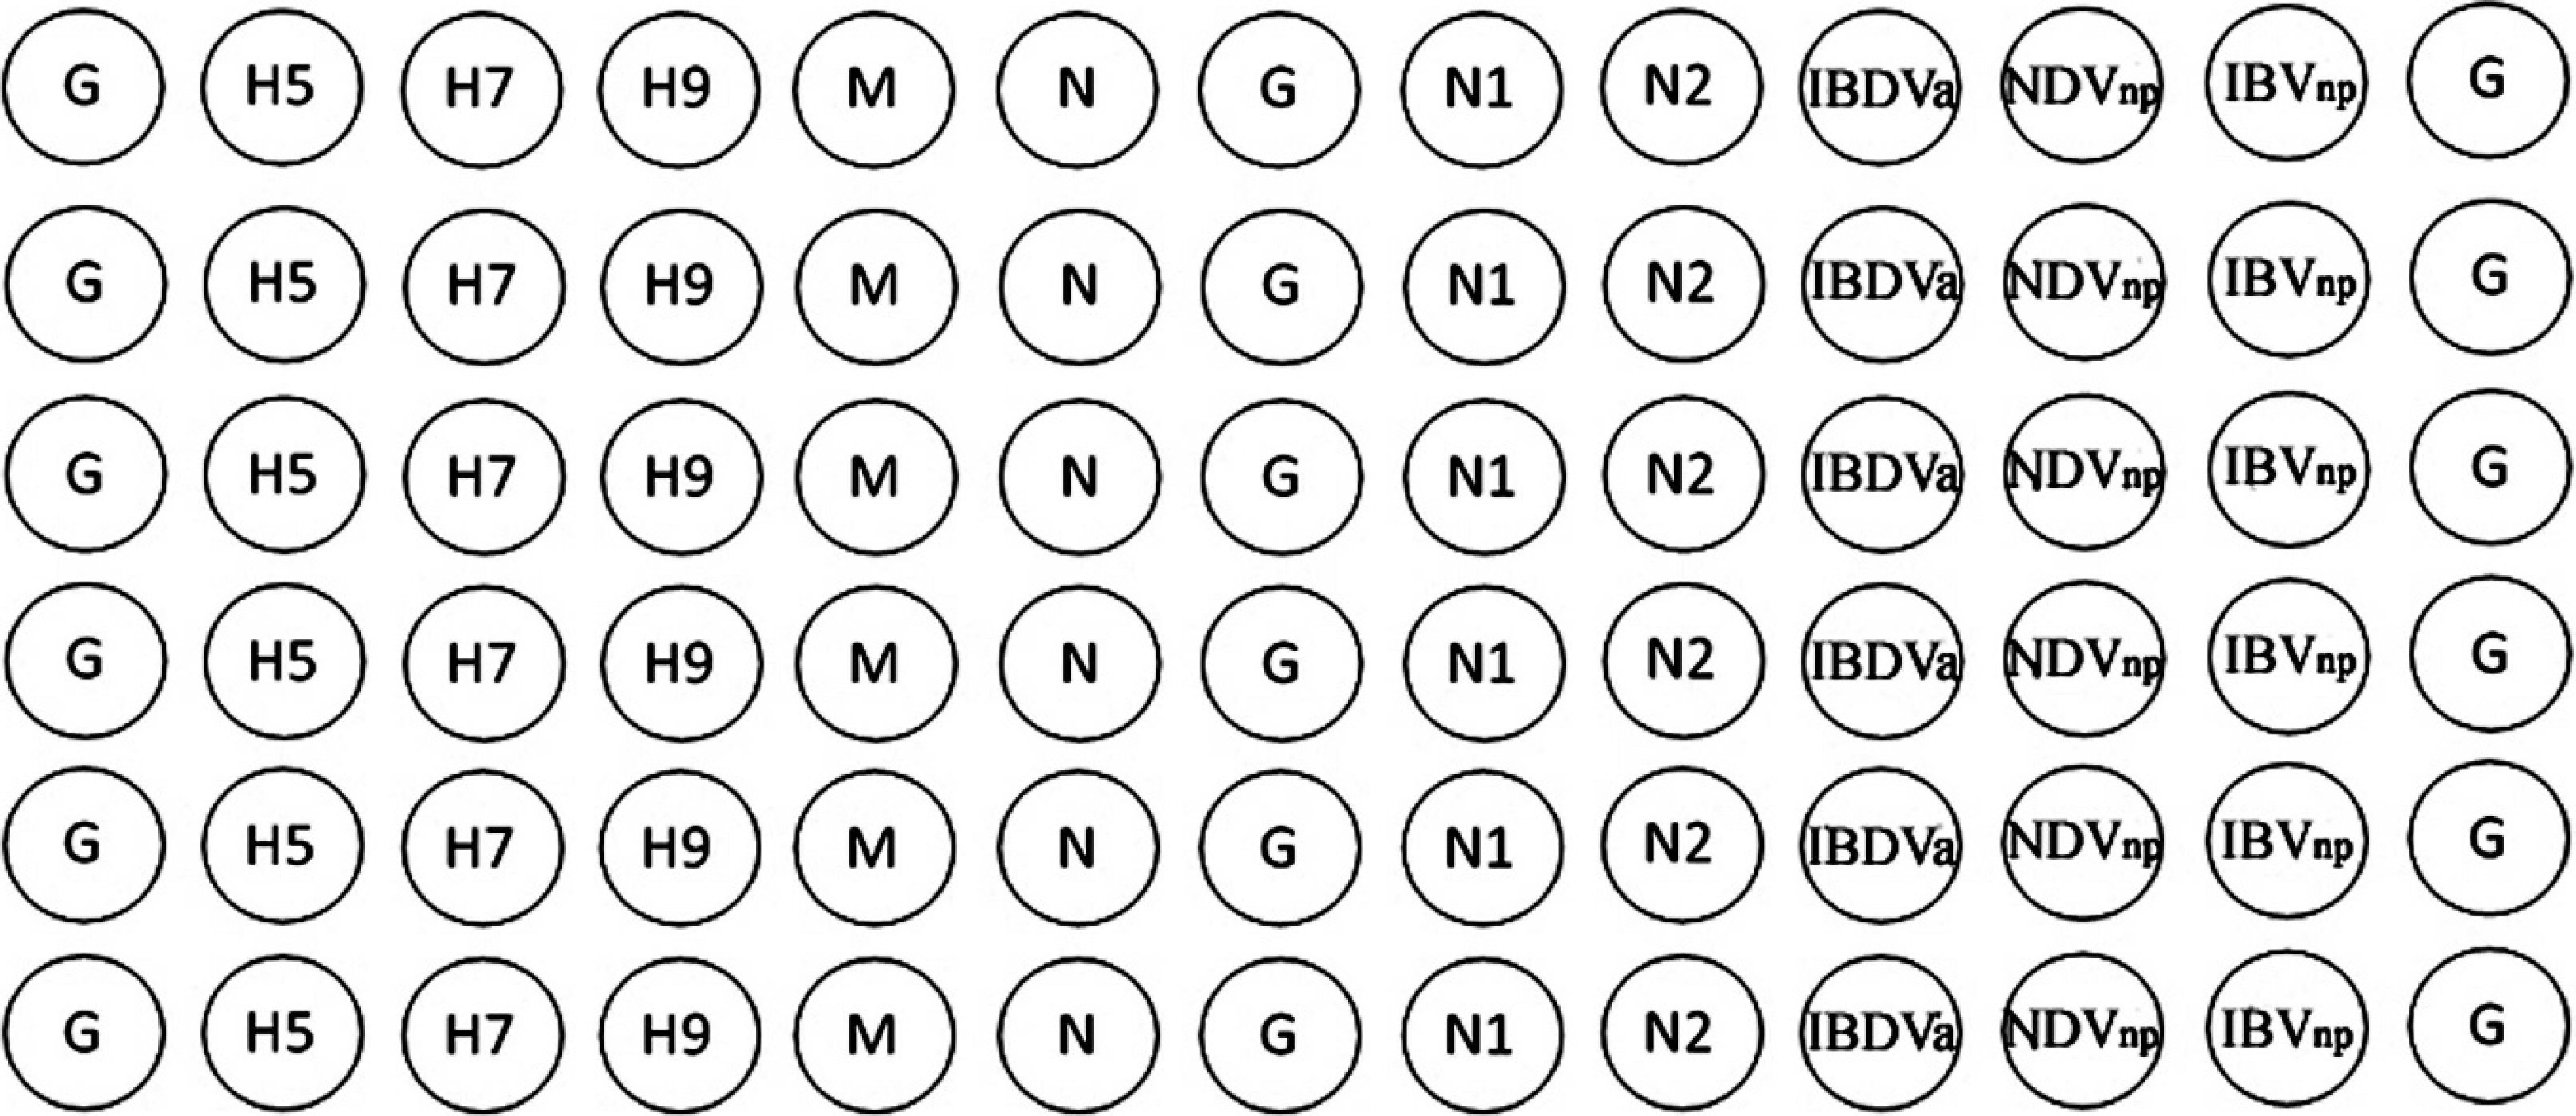
The diagnostic DNA microarray matrix for Avian influenza virus (AIV), Newcastle disease virus (NDV), Infectious bronchitis virus (IBV), and Infectious bursal disease virus (IBDV). N = negative control; G = positive control.
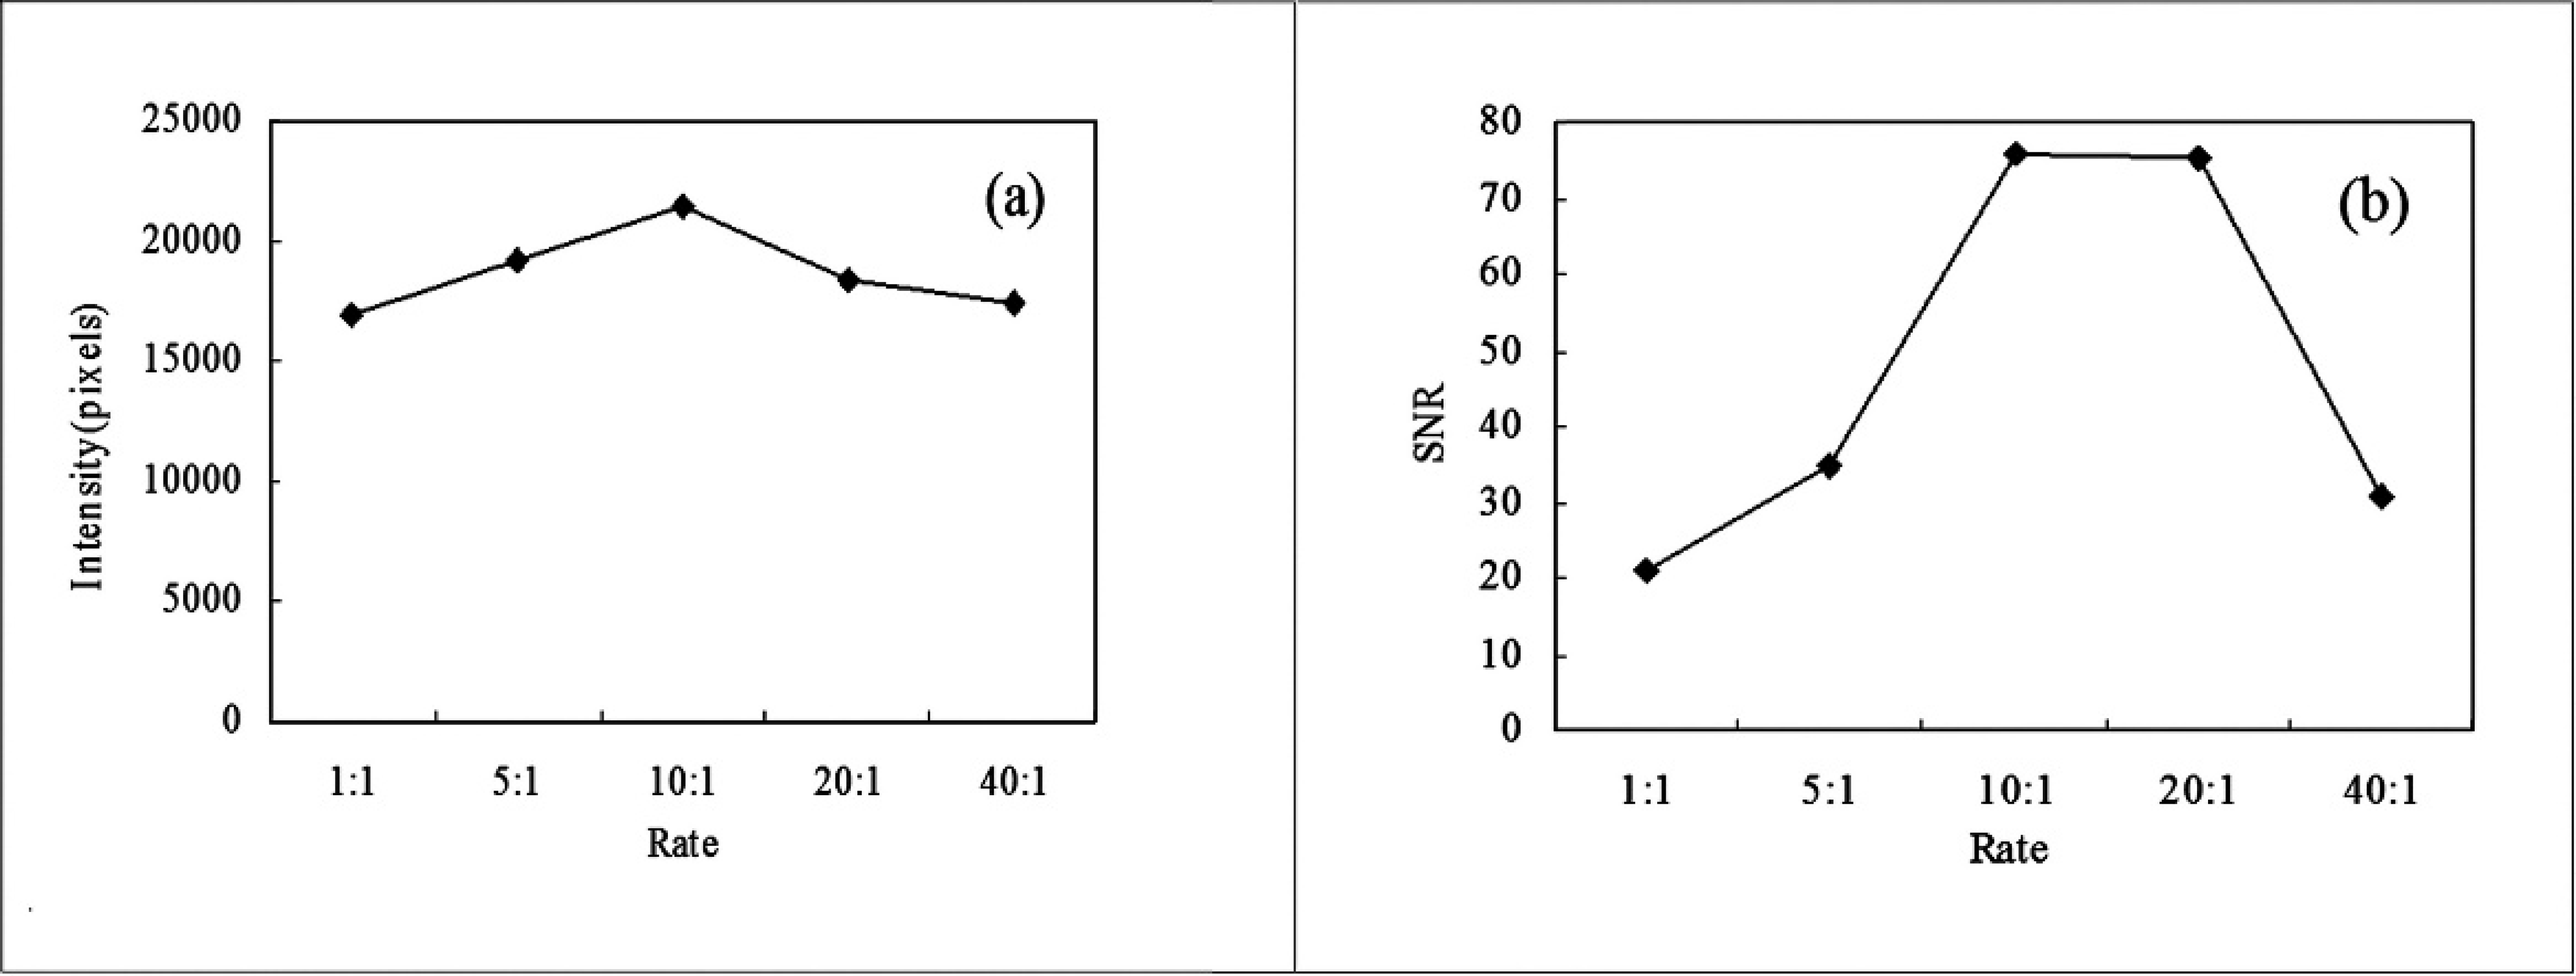
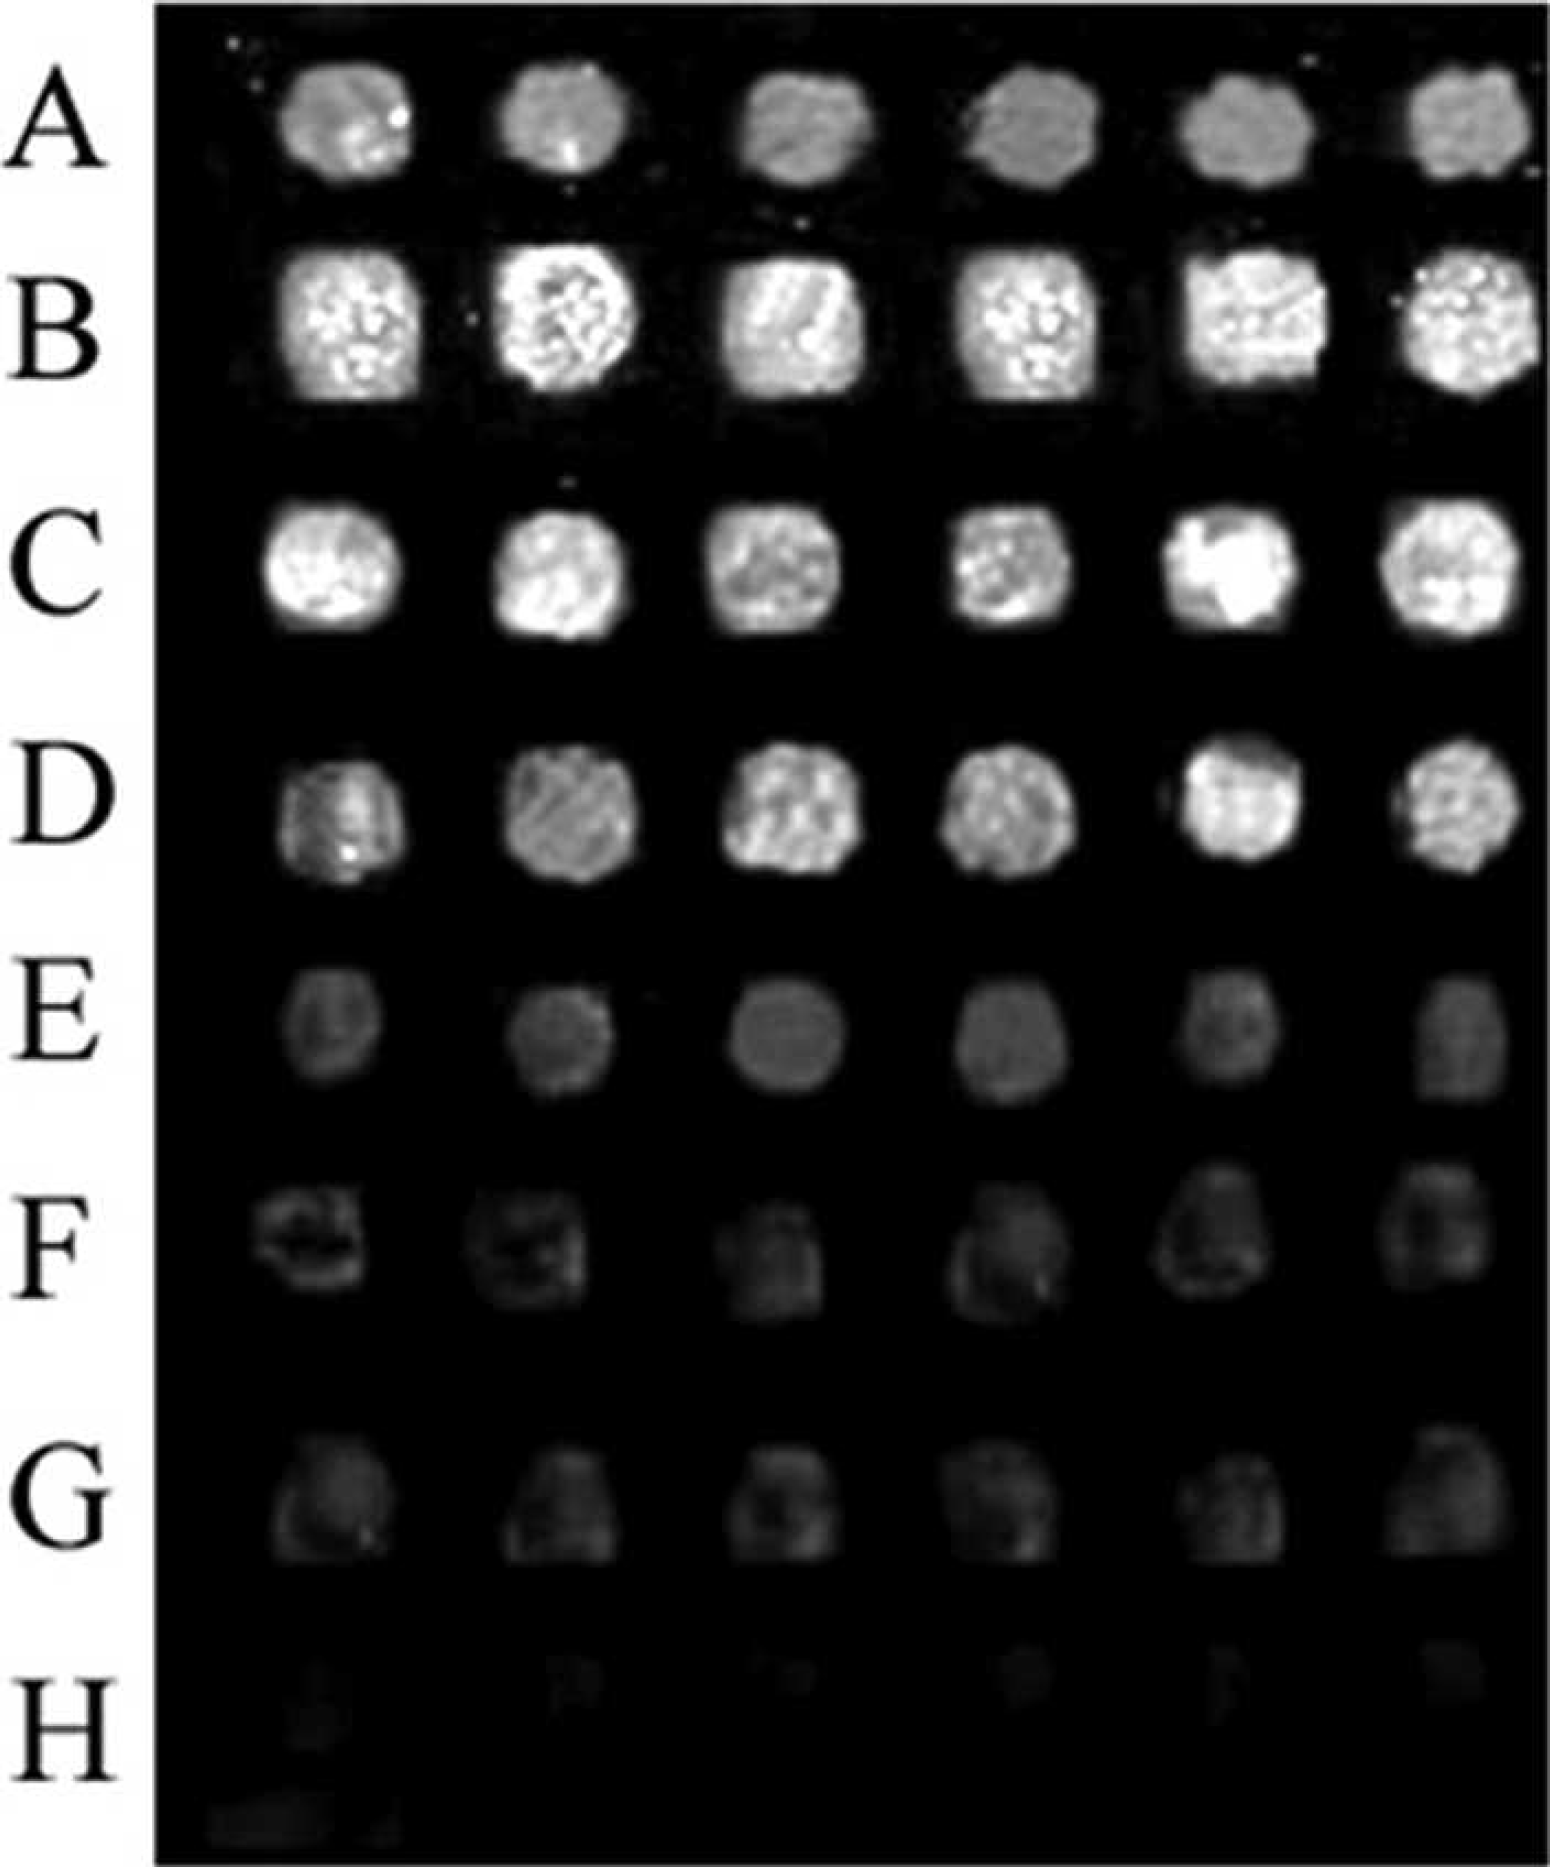
Optimization of the working concentrations of labeled and unlabeled primers. There are 3 rows in each Figure; top row shows the results of positive control, middle row shows H5 gene hybridization results, bottom row shows the results of negative control. Microarray (
analyzed by electrophoresis in a 1.0% agarose gel and purified by using a commercial PCR purification kit. e
Hybridization and analysis of signals
The 5 μl of labeled cDNA samples were mixed with 5 μl of hybridization buffer (50% formamide, 10x SSC, 0.2% sodium dodecyl sulfate [SDS]) and 2 μl of GAPDH reference DNA, denatured for 5 min at 95°C with a thermal cycler, and then cooled to 4°C. The 12 μl total volume was hybridized to the microarray, covered with a silica coverslip, and put into a waterproof slide chamber. Hybridization was carried out for 8 hr in a hybridization
Chip sensitivity detection.
oven at 42°C. After hybridization, the microarrays were washed with 2– SSC + 0.1% SDS, 0.2– SSC + 0.1% SDS, and 0.2– SSC for 5 min each at room temperature and dried at room temperature in the dark. Then the micro-arrays were fixed with ice-cold anhydrous alcohol, centrifuged, dried, and scanned with a confocal laser scanner. l The hybridization signals were analyzed with the GenePix Pro6.0 software. m Fluorescence signals of SNR532 > 3 and B532 +2 SD > 55 were considered positive.
Optimization of reaction conditions
The positively cloned plasmid pMD18-H5 (108 copies/μl) was used as a template for asymmetric PCR with a Cy3-labeled reverse primer and unlabeled forward primer at ratios of 1:1, 5:1, 10:1, 20:1, and 40:1, and then hybridized with the prepared microarrays. The hybridization signals were scanned and analyzed.
Detection of microarray sensitivity and specificity
The plasmid concentrations ranged from 108 to 10 copies/μl through a 10-fold dilution series. The dilution series was applied to compare sensitivity of the microarray and PCR. Total RNA were extracted from allantoic fluid, including H5N1 subtype AIV, H7N1 subtype AIV, H9N2 subtype AIV, NDV, IBV, IBDV, a mixture of AIV subtypes H5N1, H7N1, H9N2, and a mixture of NDV, IBV, IBDV using TRIzol LS h according to the manufacturer's instructions. The RNA was amplified by asymmetric RT-PCR. After PCR amplification, 5-μl product was analyzed by 1.0% agarose gel electrophoresis. The other amplified products were purified by using a commercial PCR purification kit, e then concentrated, hybridized with prepared microarrays, and scanned. The hybridization signals were analyzed.
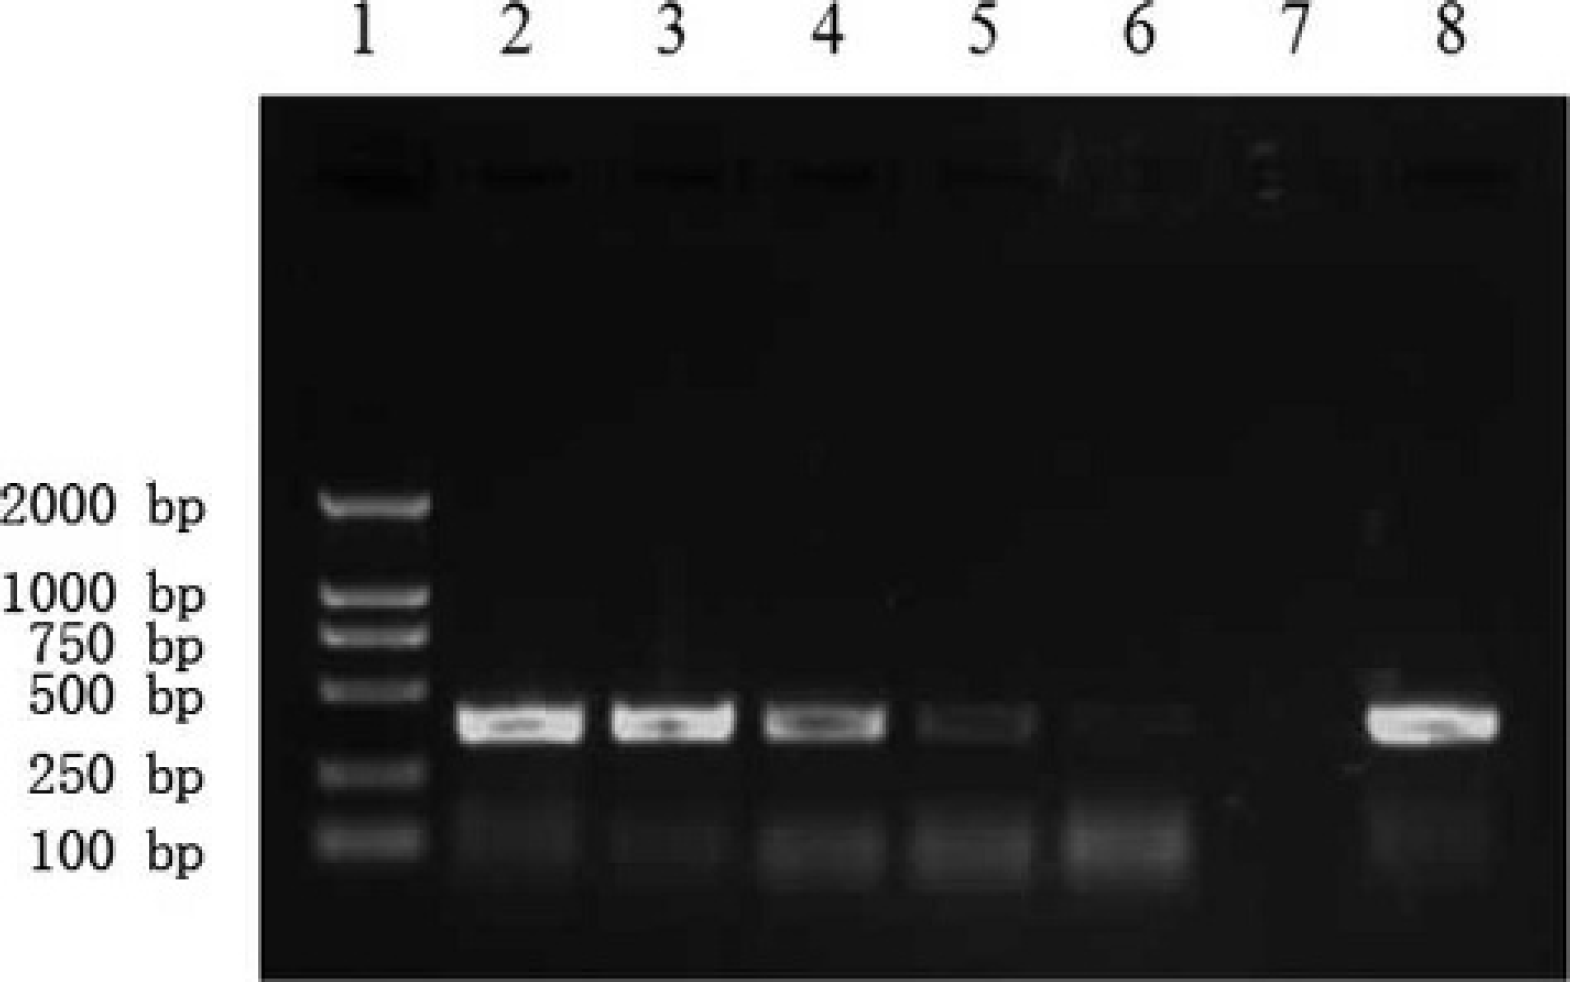
Sensitivity of reverse transcription polymerase chain reaction. Lane 1: DL-2000; lane 2: 2–107 copies; lane 3: 2–106 copies; lane 4: 2–105 copies; lane 5: 2–104 copies; lane 6: 2–103 copies; lane 7: negative control; lane 8: positive control.
Microarray reproducibility and retention period tests
Three randomly chosen microarrays from same batch and from 3 batches were hybridized with the same samples to test intra- and inter-batch reproducibility. Microarrays prepared in the same batch were stored hermetically at room temperature for 10, 20, 30, 40, 50, 60, and 70 days, and hybridized with the same samples to assess the retention period of the microarrays.
Detection of experimental and field samples
Thirty cloacal swabs and tissue samples of experimental samples were tested by microarray, RT-PCR, and chicken embryo inoculation analyses. The results were recorded, and the accordance rates were calculated. Tissue samples from 57 chickens that died of various diseases were collected in field and detected with RT-PCR and the microarrays. The detection results of the 2 methods were compared.
Results
Cloning and microarrays preparation
The constructed recombinant plasmids were determined to be positive after PCR identification (Fig. 1) and DNA sequencing (data not shown). A matrix of probes is shown in Figure 2. The order of the probes on the microarrays from left to right is as follows: GAPDH (G); H5; H7; H9; M; negative control (N); GAPDH (G); N1; N2; IBDVa; NDVnp; IBVnp; and GAPDH (G). Each probe was repeatedly spotted 6 times in the longitudinal direction in one matrix.
Optimization of reaction conditions
The H5 gene was amplified by asymmetric PCR using Cy3-labeled reverse and unlabeled forward primers at ratios of 1:1, 5:1, 10:1, 20:1, and 40:1, hybridized with prepared microarrays, and scanned. The fluorescence signals were strongest and most specific when the primers were used at the ratio of 10:1 (Figs. 3, 4).
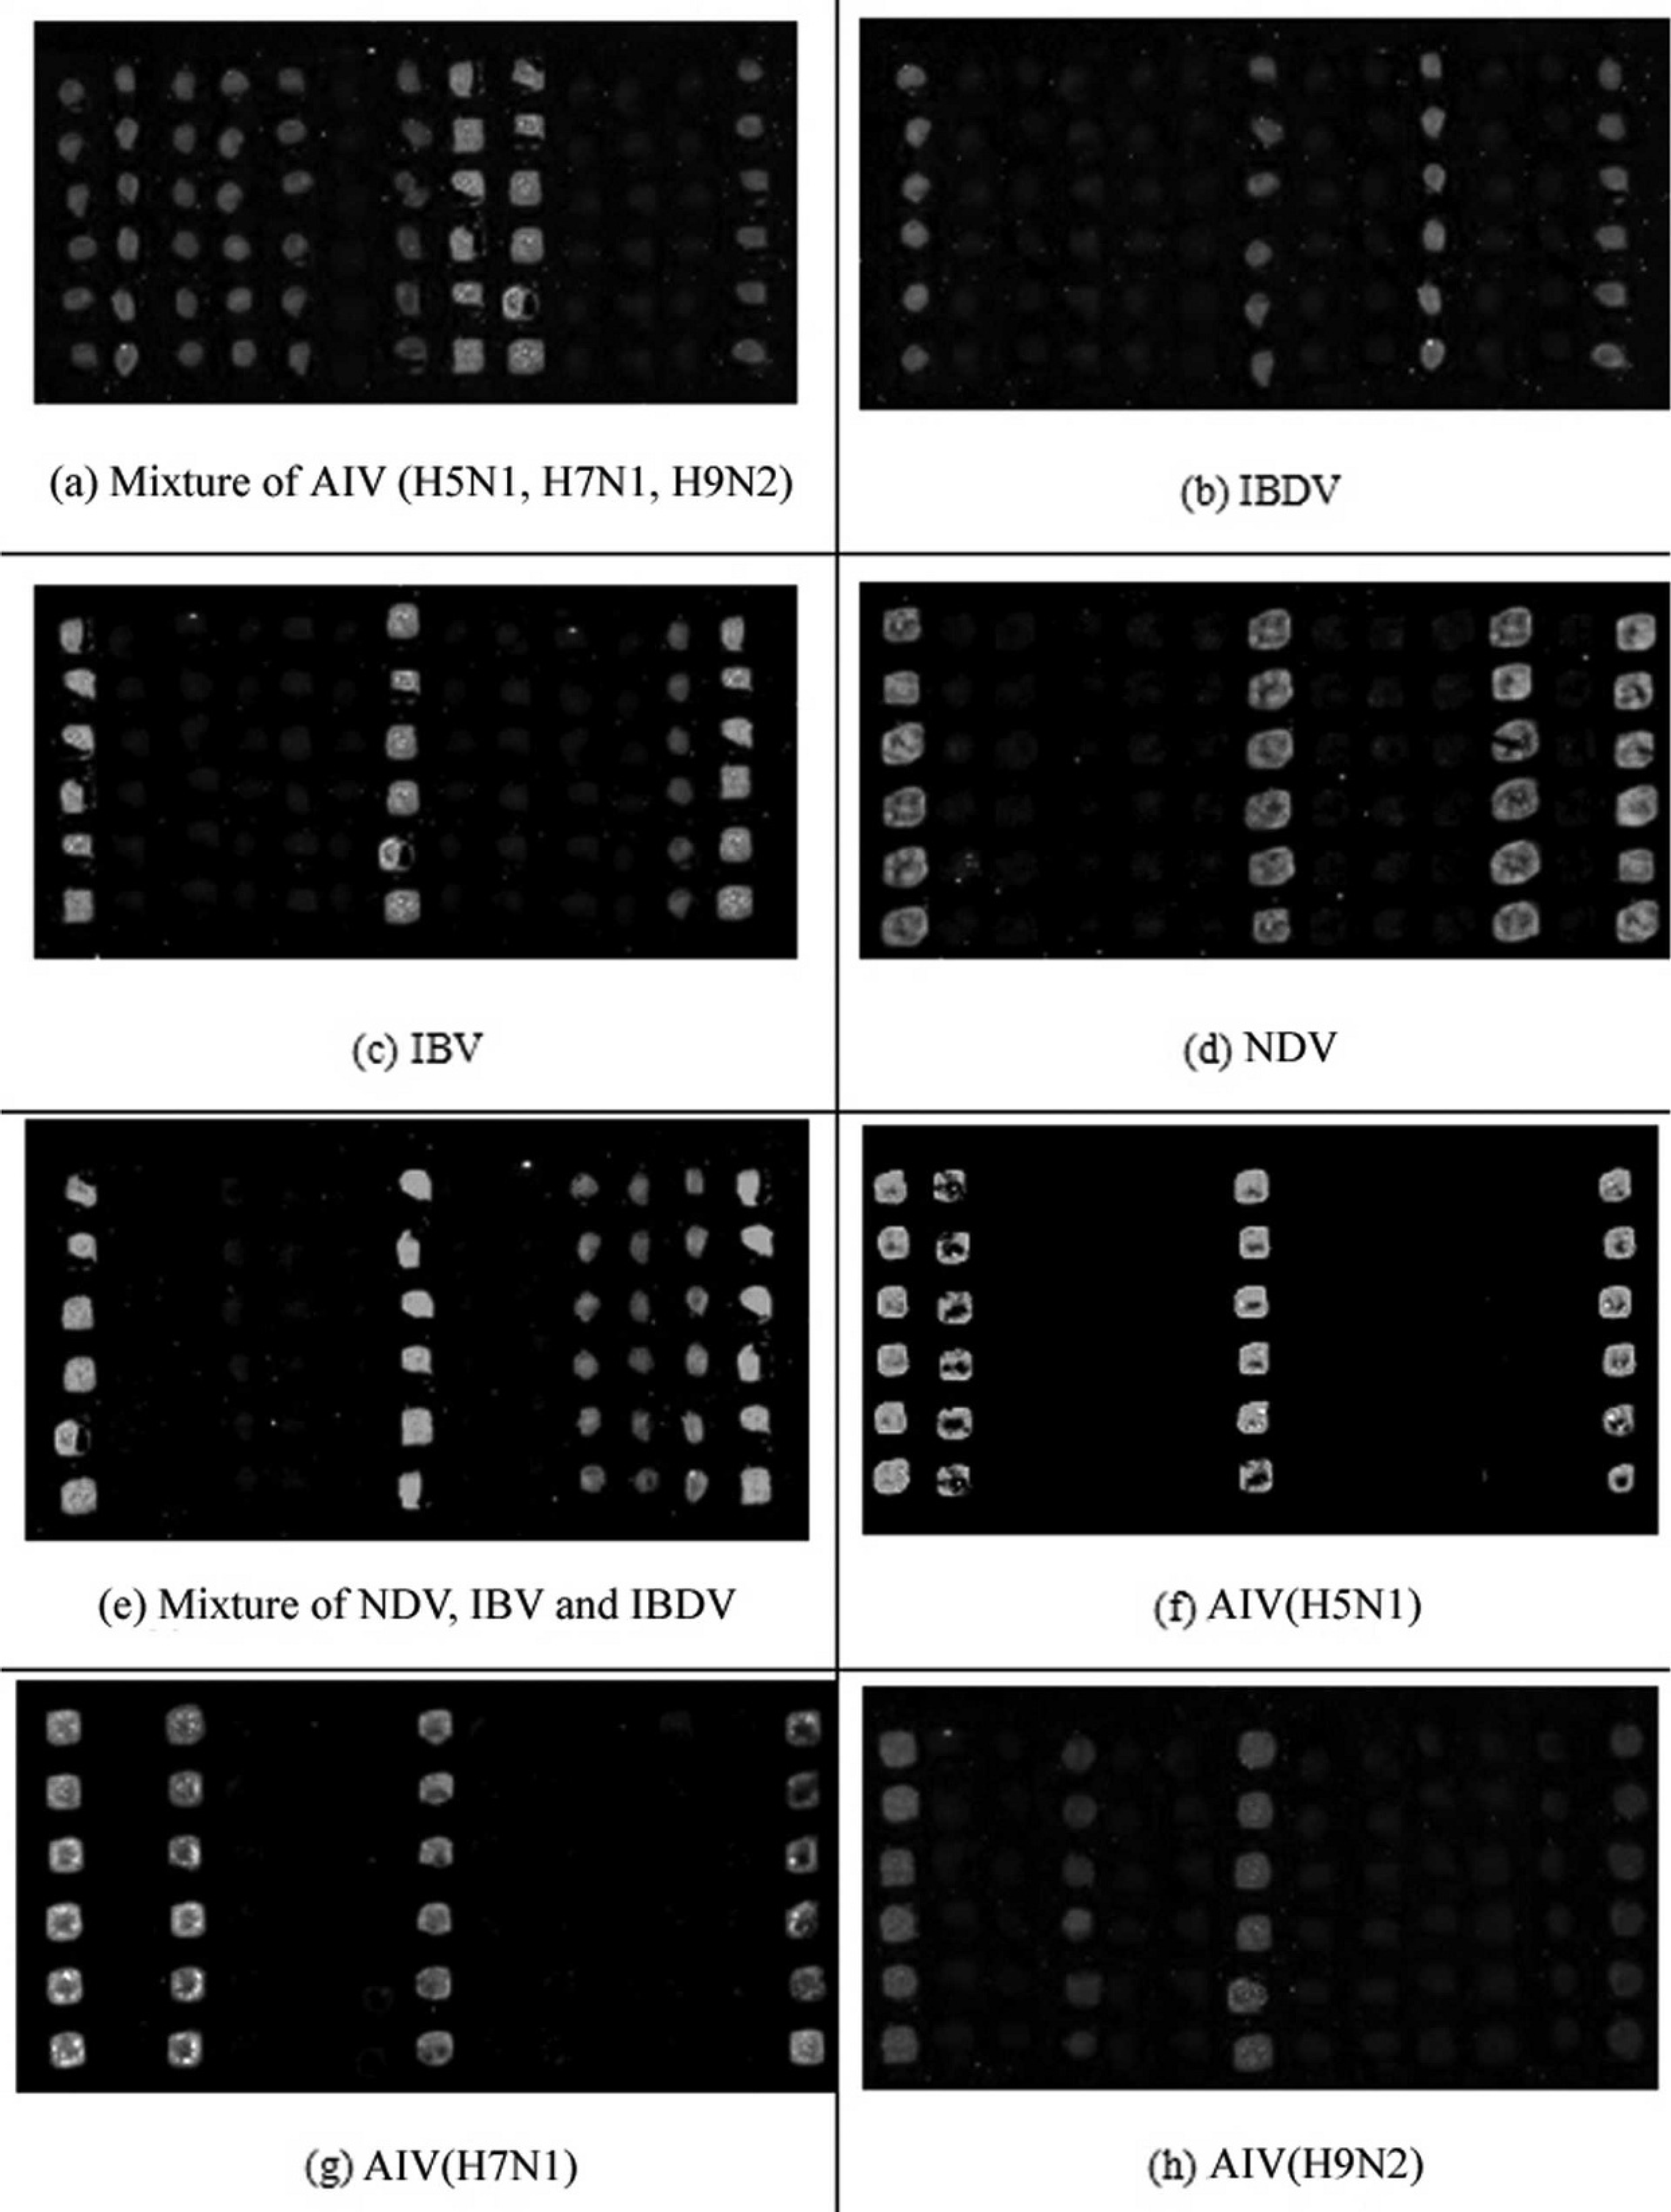
Specificity of the diagnostic microarrays.
Detection of experimental samples by 3 diagnostic methods. *
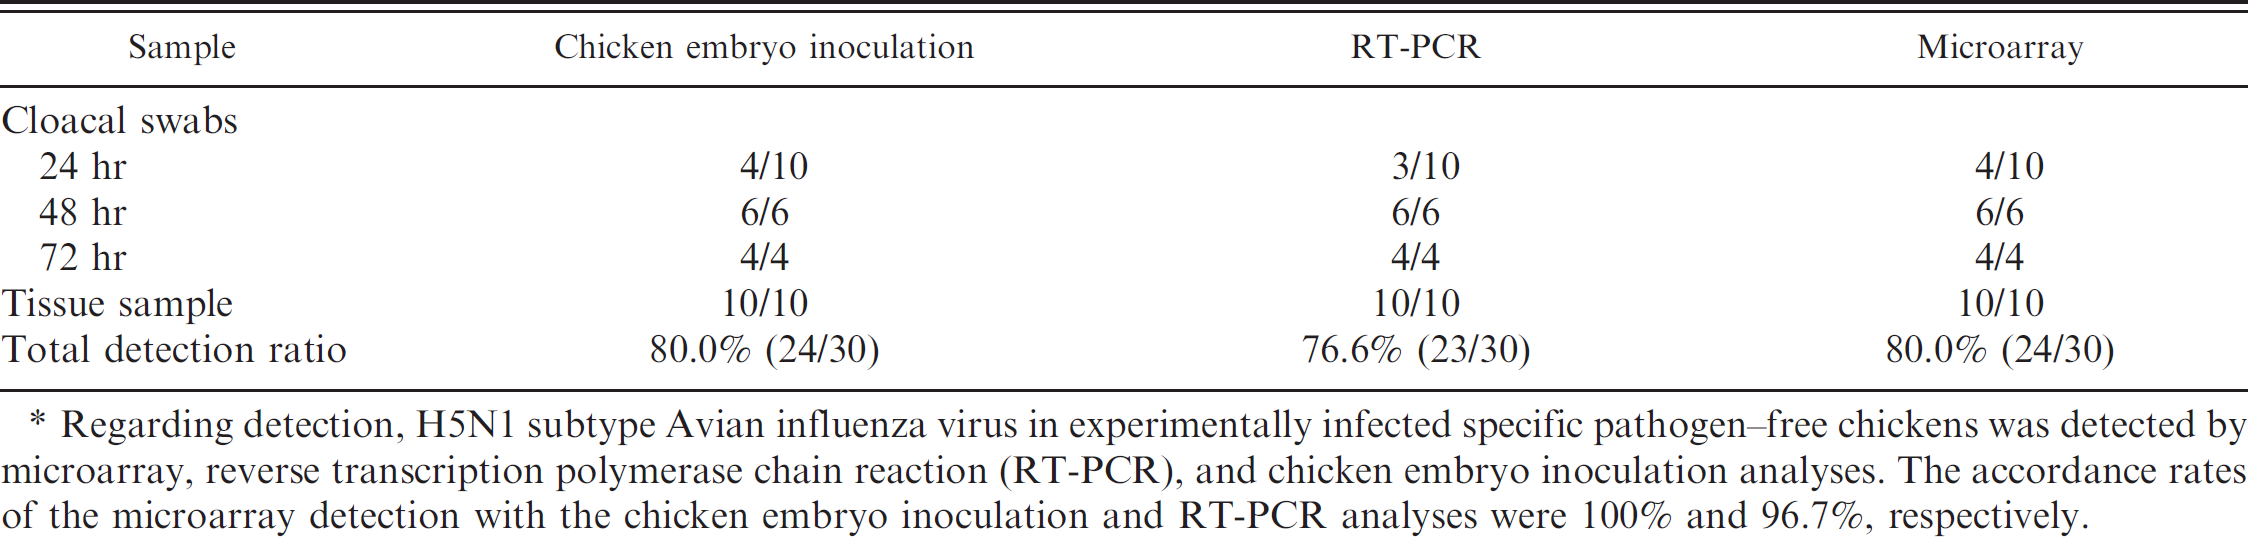
Regarding detection, H5N1 subtype Avian influenza virus in experimentally infected specific pathogen-free chickens was detected by microarray, reverse transcription polymerase chain reaction (RT-PCR), and chicken embryo inoculation analyses. The accordance rates of the microarray detection with the chicken embryo inoculation and RT-PCR analyses were 100% and 96.7%, respectively.
Detection of microarrays sensitivity
Both the microarrays and PCR were found to accurately detect the templates at concentrations above 2–105 copies, and the ratio of the Cy3–labeled reverse and unlabeled forward primers was 10:1. When the template concentration was 2–104 copies, the RT-PCR data was not sufficiently clear to enable positive identification. However, when the template concentration was 2–103 copies, the microarrays still showed relatively strong fluorescence signals. These results revealed that the sensitivity of the microarrays was higher than that of RT-PCR using the same primer ratios. The data is shown in Figures 5 and 6.
Detection of specificity
Total RNA was extracted from samples of AIV (subtypes H5N1, H7N1, H9N2), NDV, IBDV, and IBV preserved in the laboratory. The RNA was labeled and hybridized with the microarrays. All AIV samples can be detected by hybridization signals on the site-located M probe. AIV subtype H5N1 samples can be detected by hybridization signals on the site-located M probe, H5 probe, and N1 probe. The other virus samples can be detected by hybridization signals on the site-located corresponding probe. No cross-hybridization could be detected. The results showed that the hybridization pattern agreed perfectly with the known location of each probe and that the microarray has good specificity (Fig. 7).
Microarrays reproducibility and retention period
Hybridization signals of the same samples with microarrays of the same batch and the same samples with microarrays of the different batches were analyzed with the GenePix Pro6.0 software. 1 Results revealed that the coefficient of variation (CV) of the F532-B532 median was within 20%, and that the microarray has good reproducibility for intra- and inter-batches. Testing for the retention period of the microarrays revealed that the spotted and treated microarrays could be preserved for at least 60 days at room temperature under airtight conditions.
Detection of experimental samples
Thirty collected cloacal swabs and tissue samples were tested by microarray, RT-PCR, and chicken embryo inoculation analysis (Table 2). The accordance rates of the microarray detection with chicken embryo inoculation and RT-PCR were 100% (30/30) and 96.7% (29/30), respectively. These results showed that the sensitivity of the microarray was similar to the chicken embryo inoculation method, and that the sensitivity of microarray was higher than that of RT-PCR.
Detection of field samples
Tissue samples from 57 chickens that died of various diseases were collected in field and detected with RT-PCR and the microarrays. For both methods, the detection rates of IBDV were the highest followed by NDV, IBV, and H9 and H5
Reverse transcription polymerase chain reaction (RT-PCR) and microarray for detection field samples. *
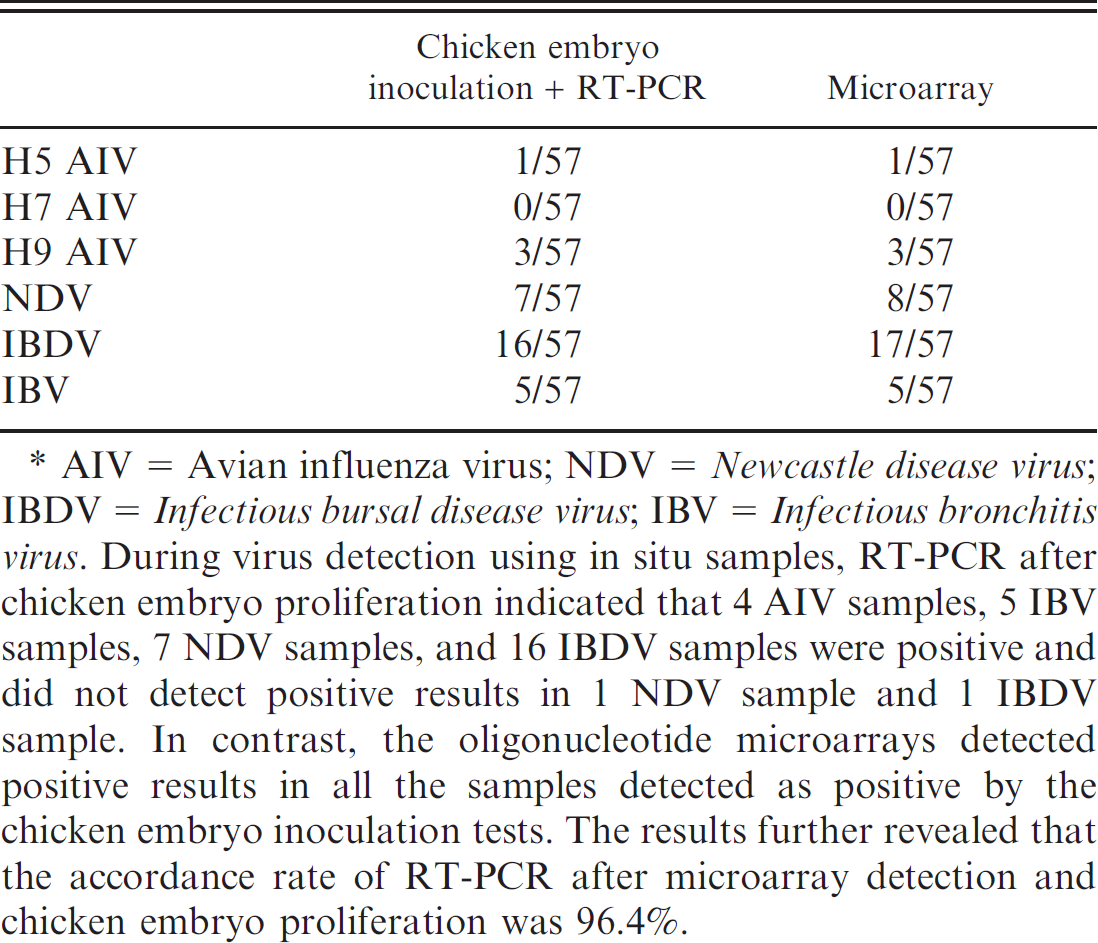
AIV = Avian influenza virus; NDV = Newcastle disease virus; IBDV = Infectious bursal disease virus; IBV = Infectious bronchitis virus. During virus detection using in situ samples, RT-PCR after chicken embryo proliferation indicated that 4 AIV samples, 5 IBV samples, 7 NDV samples, and 16 IBDV samples were positive and did not detect positive results in 1 NDV sample and 1 IBDV sample. In contrast, the oligonucleotide microarrays detected positive results in all the samples detected as positive by the chicken embryo inoculation tests. The results further revealed that the accordance rate of RT-PCR after microarray detection and chicken embryo proliferation was 96.4%.
subtypes of AIV, while H7 subtype AIV was not detected (Table 3). Results of the microarray detection were in accordance with those of the RT-PCR detection, showing that microarray detection can be applied to field sample detection.
Discussion
The differential diagnosis of avian influenza, Newcastle disease, infectious bronchitis, and infectious bursal disease can initially be determined according to the clinical symptoms and necropsy changes for primary diagnosis. 5 Virus isolation, antigen detection, and serologic analysis are the methods currently used for the laboratory diagnosis of these viruses. Viral isolation techniques are considered the gold standard for identification of active viral infections in blood and tissues. Other alternative diagnostic techniques, such as viral antigen detection, have included RT-PCR, real-time RT-PCR, fluorescent antibody test, and enzyme-linked immunosorbent assay (ELISA). In addition, the ELISA also can be frequently used to determine antibodies of AIV, 15 NDV, 11 and IBDV. 24 Each of these methods, however, has its advantages and limitations. Regarding large-scale epidemiological investigations and analyses, different detection methods can be chosen according to the differences in pathogens for investigation and the preferences of different laboratories. Microarray originated in the late 1980s. The technology has the advantages of being high-throughput, specific, sensitive, and automated. It is currently the major means for performing genome research, drug analyses, 3 and also for disease diagnosis. For example, as previously reported, DNA microarrays have successfully been used to detect known viruses 22 and genotyping of viral pathogens. 23 Asymmetric PCR uses conventional PCR primers at unequal concentrations to generate single-stranded DNA (ssDNA). Hybridization experiments were carried out with genomic probes constructed with an asymmetric PCR strategy. In the current study, microarray based on asymmetric RT-PCR was developed as a diagnostic method that integrates the rapid, accurate, and highly sensitive characteristics of PCR technology with the high-throughput and automated superiorities of microarray technology.
Sample labeling can be divided into random primer labeling, 14 end transfer labeling, 6 and PCR fluorescence labeling. 21 Experiments have shown that the labeling efficiency of random primer labeling may fulfill the detection requirements for cDNA micro-array sensitivity, but its specificity is low and the false-positive detection rate is comparatively high. 4 In addition, it is difficult to control the optimal concentration of Cy3–dUTP h during the amplification of random primers, which may affect the efficiency of amplification. End transfer labeling uses the terminal deoxynucleotidyl transferase enzyme to add the fluorescent substance Cy5 to the end of conventional PCR products. However, its labeling efficiency is often related to the reaction time, leading to low efficiency and an inability to meet diagnostic specificity and sensitivity requirements. PCR fluorescence labeling involves addition of the fluorescent substance Cy3 to the 5’ end of PCR primers. After each amplification, there is a fluorescent molecule on the reverse strand of the amplified fragment, which may exhibit a fluorescence signal after hybridization with the probe on the positive strand, which has a fluorescent molecule located at its 5’ end. This method of labeling can realize simultaneous labeling with large-scale amplification of the template in samples. In the present study, PCR fluorescence labeling was used and incorporated asymmetric amplification. Asymmetric PCR amplification has a linear relationship with the amount of target fragments within a certain cycle; conventional forward primers and labeled reverse primers were used at unequal concentrations to generate labeled ssDNA. A previous study showed that probes undergoing asymmetric PCR amplification labeling exhibited alterations in their signal-to-noise ratios after hybridization. 25 Experimental results revealed that when the ratio between the fluorescently labeled primer and the unlabeled primer was 10:1, the PCR products had the highest proportion of single strands and the lowest amount of nonspecific hybridization. Optimization of the microarray hybridization conditions can also increase the sensitivity and specificity of micro-array detection. The results of the sensitivity test showed that the microarray could detect 2–103 copies, which was far superior to the sensitivity of RT-PCR.
Another important application in DNA microarray is differential diagnosis of field virus infection from vaccinated animals; some vaccinated and field virus infection animals can be discriminated theoretically depending on the virus genome sequence difference, such as AIV, 2,23 NDV, 9 and IBDV. 10 For recombinant live-attenuated AIV vaccines including NP or M gene deletion, design additional probes is recommended for differential diagnosis. 24,25 Live attenuated NDV vaccine has a deletion of fusion (F0) protein from 112 to 117 amino acid, which is the cleavage site. 26 But when it comes to IBV, there is no obvious sequence differences between vaccine strain and outbreak virus, so vaccine strain and filed isolates IBV cannot be differentiated by DNA microarray. The present study aimed to differentiate mixed infections of these 4 poultry viruses, and the method was not capable of discriminate vaccine strain from field virus.
It is thought by some that mixed infection cases occur frequently in the field, especially co-infection of avian influenza and Newcastle disease. The surveillance of NDV and AIV in mallards showed that 11 of 38 blood serum samples collected in August were serologically positive for both AIV and NDV. However, all of the 32 blood serum samples collected in December were negative for antibodies against AIV and NDV. 27 The results showed that the chance to detect 2 viruses simultaneously depends on the samples collecting time. In the current study, no mixed infection was detected in the collected samples. This may be caused by the prevalence of diseases related to season; samples collecting during IBDV spreading resulted in a small number of AIV- and NDV-positive samples, let alone mixed infection.
Results of the detection of experimental and field samples showed that microarray combined with asymmetric RT-PCR was as good as, if not slightly better than, RT-PCR. The microarray could identify IBV, NDV, IBDV, and AIV, and specifically differentiate AIV HA subtypes H5, H7, and H9, and NA subtypes N1 and N2. Furthermore, the microarrays showed good reproducibility and a retention period of up to 60 days, making them suitable for large-scale epidemiological investigations and field screening of AIVs. Microarray in combination with asymmetric RT-PCR is an effective way to identify and differentiate 4 poultry diseases simultaneously.
Acknowledgements
This study was supported by an International Collaborative Project (2007DFR30360).
Footnotes
a.
Amino-modified slides, Shanghai Baiao Biological Engineering Co. Ltd., Shanghai, China.
b.
Oligor version 6.0, Cambio Ltd, Cambridge, UK.
c.
Access RT-PCR system, Promega Corp., Madison, WI.
d.
Avian myeloblastosis virus (AMV) reverse transcriptase, Takara Bio Inc., Otsu, Shiga, Japan.
e.
QIAquickr PCR Purification kit, Qiagen Inc., Valencia, CA.
f.
TaKaRa pMD18-T vector, Takara Bio Inc., Otsu, Shiga, Japan.
g.
Stealth microspotting pins (SMP3), TeleChem International Inc., Sunnyvale, CA.
h.
Ultraviolet Crosslinker Model CL-1000, UVP, LLC, Upland, CA.
i.
TRIzol LS RNA extraction kit, Invitrogen Corp., Carlsbad, CA.
j.
CY3-dUTP, Amersham Biosciences, Piscataway, NJ.
k.
Taq DNA recombinant polymerase (rTaq), Takara Bio Inc., Otsu, Shiga, Japan.
l.
VersArray ChipReaderTM, Bio-Rad Laboratories, Hercules, CA.
m.
GenePixr Pro6.0, Molecular Devices Corp., Sunnyvale, CA.