
Abstract
Measurements of glycated proteins such as serum fructosamine, glycated hemoglobin, and glycated albumin (GA) are increasingly used to complement serum glucose concentration for better management of diabetes mellitus. For example, the degree of glycemic control in diabetic cats can be determined by evaluating fructosamine concentration. Unfortunately, fructosamine tests are currently not performed in Japan, and as such, the measurement of GA may serve as a replacement test. The objectives of the current study were 2-fold. First, serum GA and fructosamine level were evaluated for positive correlation in cats as a preliminary gauge on whether serum GA use is applicable. Second, a GA percentage reference range was determined from healthy control cats for possible future diagnostic use. A positive correlation was determined for fructosamine and GA in both normal and diabetic cats. Moreover, the serum GA percentage reference interval based on control cats was determined to be 7.5–13.9% (95% nonparametric interfractile interval). Interestingly, no significant difference in serum GA percentages was observed between samples from diabetic cats with excellent glycemic control and control cats. However, good, fair, and poor glycemic control diabetic cats resulted in a significant increase in serum GA percentages in comparison to control cats. Therefore, these results indicate that serum GA may be a useful glycemic control indicator that could substitute for fructosamine to monitor glycemic control in diabetic cats.
Glycated blood protein assays such as serum fructosamine, glycated hemoglobin, and glycated albumin (GA) have significantly improved the accuracy of diagnosing diabetes mellitus (DM) by facilitating exclusion of epinephrine-induced physiologic hyperglycemia in cats. 2,4 Specifically, serum fructosamine concentration reflects the degree of glycation of serum proteins and the mean serum glucose concentration from the previous 1–3 weeks in cats. 4,5,7 Serum fructosamine concentration increases when glycemic control in diabetic cats deteriorates and decreases when glycemic control ameliorates; therefore, the measurement of fructosamine is considered to be the gold standard for monitoring glycemic control in diabetic cats. 2 Unfortunately, fructosamine testing is currently not being performed on cats in Japan because commercial reagents required for testing have been discontinued. Alternatively, the measurement of GA has been commonly advocated in human diabetic patients and can also provide an index of glycemic control for 1–3 weeks. 3,6,9,10 In addition, a recent study demonstrated that serum GA could substitute for fructosamine with diabetic dogs. 8 As such, the working hypothesis of the current study is that GA could be substituted for fructosamine in diagnosis and treatment monitoring of diabetic cats because GA is a main constituent of fructosamine. Therefore, the study objectives were 2-fold. First, GA and fructosamine levels were evaluated for correlation in control and diabetic cats to validate the study's hypothesis. Second, a GA percentage reference interval from healthy control cats was identified and created to evaluate glycemic control in diabetic cats based on GA percentage.
A total of 169 cats were used for the current study. Sixty-three healthy control cats (Table 1) were kept and maintained by volunteer families around Nippon Veterinary and Life Science University (NVLSU; Tokyo, Japan) and Nyanda Park (Chiba, Japan). The cats were fed various commercial diets. Serum biochemistry test values, including assays for glucose, total protein, albumin, cholesterol, triglyceride, blood urea nitrogen, creatinine, sodium, potassium, chloride, aspartate aminotransferase, alanine aminotransferase, and alkaline phosphatase were within reference intervals classified as nondiabetic for these animals. The diabetic group of cats consisted of 106 diabetic cats who had recently visited NVLSU. Diabetic cats were categorized into 4 groups based on glycemic control level (excellent, good, fair, poor), which was assessed by serum fructosamine concentration and previously described (Table 2). 2 In brief, most owners are happy with their cat's response to insulin treatment if serum fructosamine concentration can be kept between excellent to good glycemic control. Fair control suggests inadequate control of the diabetic state, and poor control indicates serious lack of glycemic control. Inclusion criteria for diabetic cats were the following: >250 mg/dl plasma glucose level, persistent glucosuria, polyuria, polydipsia, polyphagia, and insulin-treated or untreated. If diabetic cats had any concurrent disease (e.g., dermatosis, heart failure, hyperthyroidism, liver failure), they were not included in the study.
List of healthy control cats used in the current study.
Blood samples (2 ml) were arbitrarily collected from the peripheral vein of individual animals from both groups and collected into tubes a for evaluating serum fructosamine and GA levels. Samples were allowed to clot at room temperature for 30 min before being centrifuged (1,700 × g) for 10 min in order to separate the serum. After centrifugation, serum was collected and stored at −80°C prior to use within 7 days after initial freezing. Before use, serum samples were thawed at room temperature and processed immediately thereafter. Serum GA concentrations were measured by an enzymatic method with the Lucica GA-L b assay and processed by an autoanalyzer. c Total serum albumin concentrations were measured with the Auto Wako Albumin assay d and processed by an autoanalyzer. c Lastly, serum GA levels were calculated by percentage of GA in total albumin. Serum fructosamine concentrations were determined by the fructosyl amino acid oxidase–N-ethyl-N-(2-hydroxy-3-sulphopropyl)-m-toluidine (FOD-TOOS) e method, an enzymatic assay for glycated proteins, and processed by an autoanalyzer. c Fructosamine was measured directly in micromoles (μmol). Intra-assay reproducibility of the serum GA was estimated using 2 pooled serum samples with normal (level 1) and abnormal (level 2) levels of GA with 10 replicates. The same kinds of specimens were also used for evaluating the interassay imprecision, with 10 independent runs over 1 month. Linearity was assessed by serially diluting a high-level serum pool (approximately 35–36% GA up to 32-fold) to obtain various GA values.
Interpretation of glycemic control of diabetic cats used in the current study.
For statistical analysis, values were expressed as mean ± SD or median and 95% nonparametric interfractile interval. In order to assess significance between groups, the Mann–Whitney U-test or Kruskal–Wallis test and Dunn's multiple comparison test, when appropriate, was employed for data with non-normal distribution. Moreover, the D'Agostino–Pearson omnibus test was used for testing normality of distribution. Spearman's correlation coefficient by rank was used to identify significant correlations between measurements, and Spearman's correlation coefficient, r, is displayed. Receiver operating characteristics (ROC) curves analyses were applied from the GA percentages between adjacent glycemic control level (according to fructosamine concentration) to detect the sensitivity (true-positive rate) and specificity (1 minus the false positive) of GA percentages at each cutoff point. The optimal values of cutoff points for GA were calculated from higher likelihood ratio. All tests were conducted using GraphPad Prism analysis software. f
Correlation between serum glycated albumin and fructosamine levels in arbitrary samples for (
Assessing intra- and interassay coefficients of variation of the glycated albumin (GA) assay.*
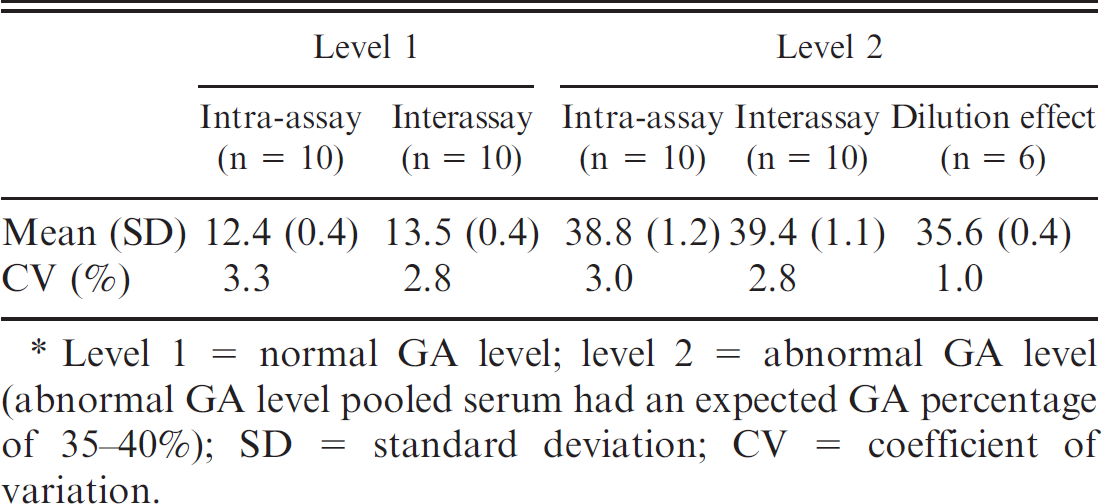
Level 1 = normal GA level; level 2 = abnormal GA level (abnormal GA level pooled serum had an expected GA percentage of 35–40%); SD = standard deviation; CV = coefficient of variation.
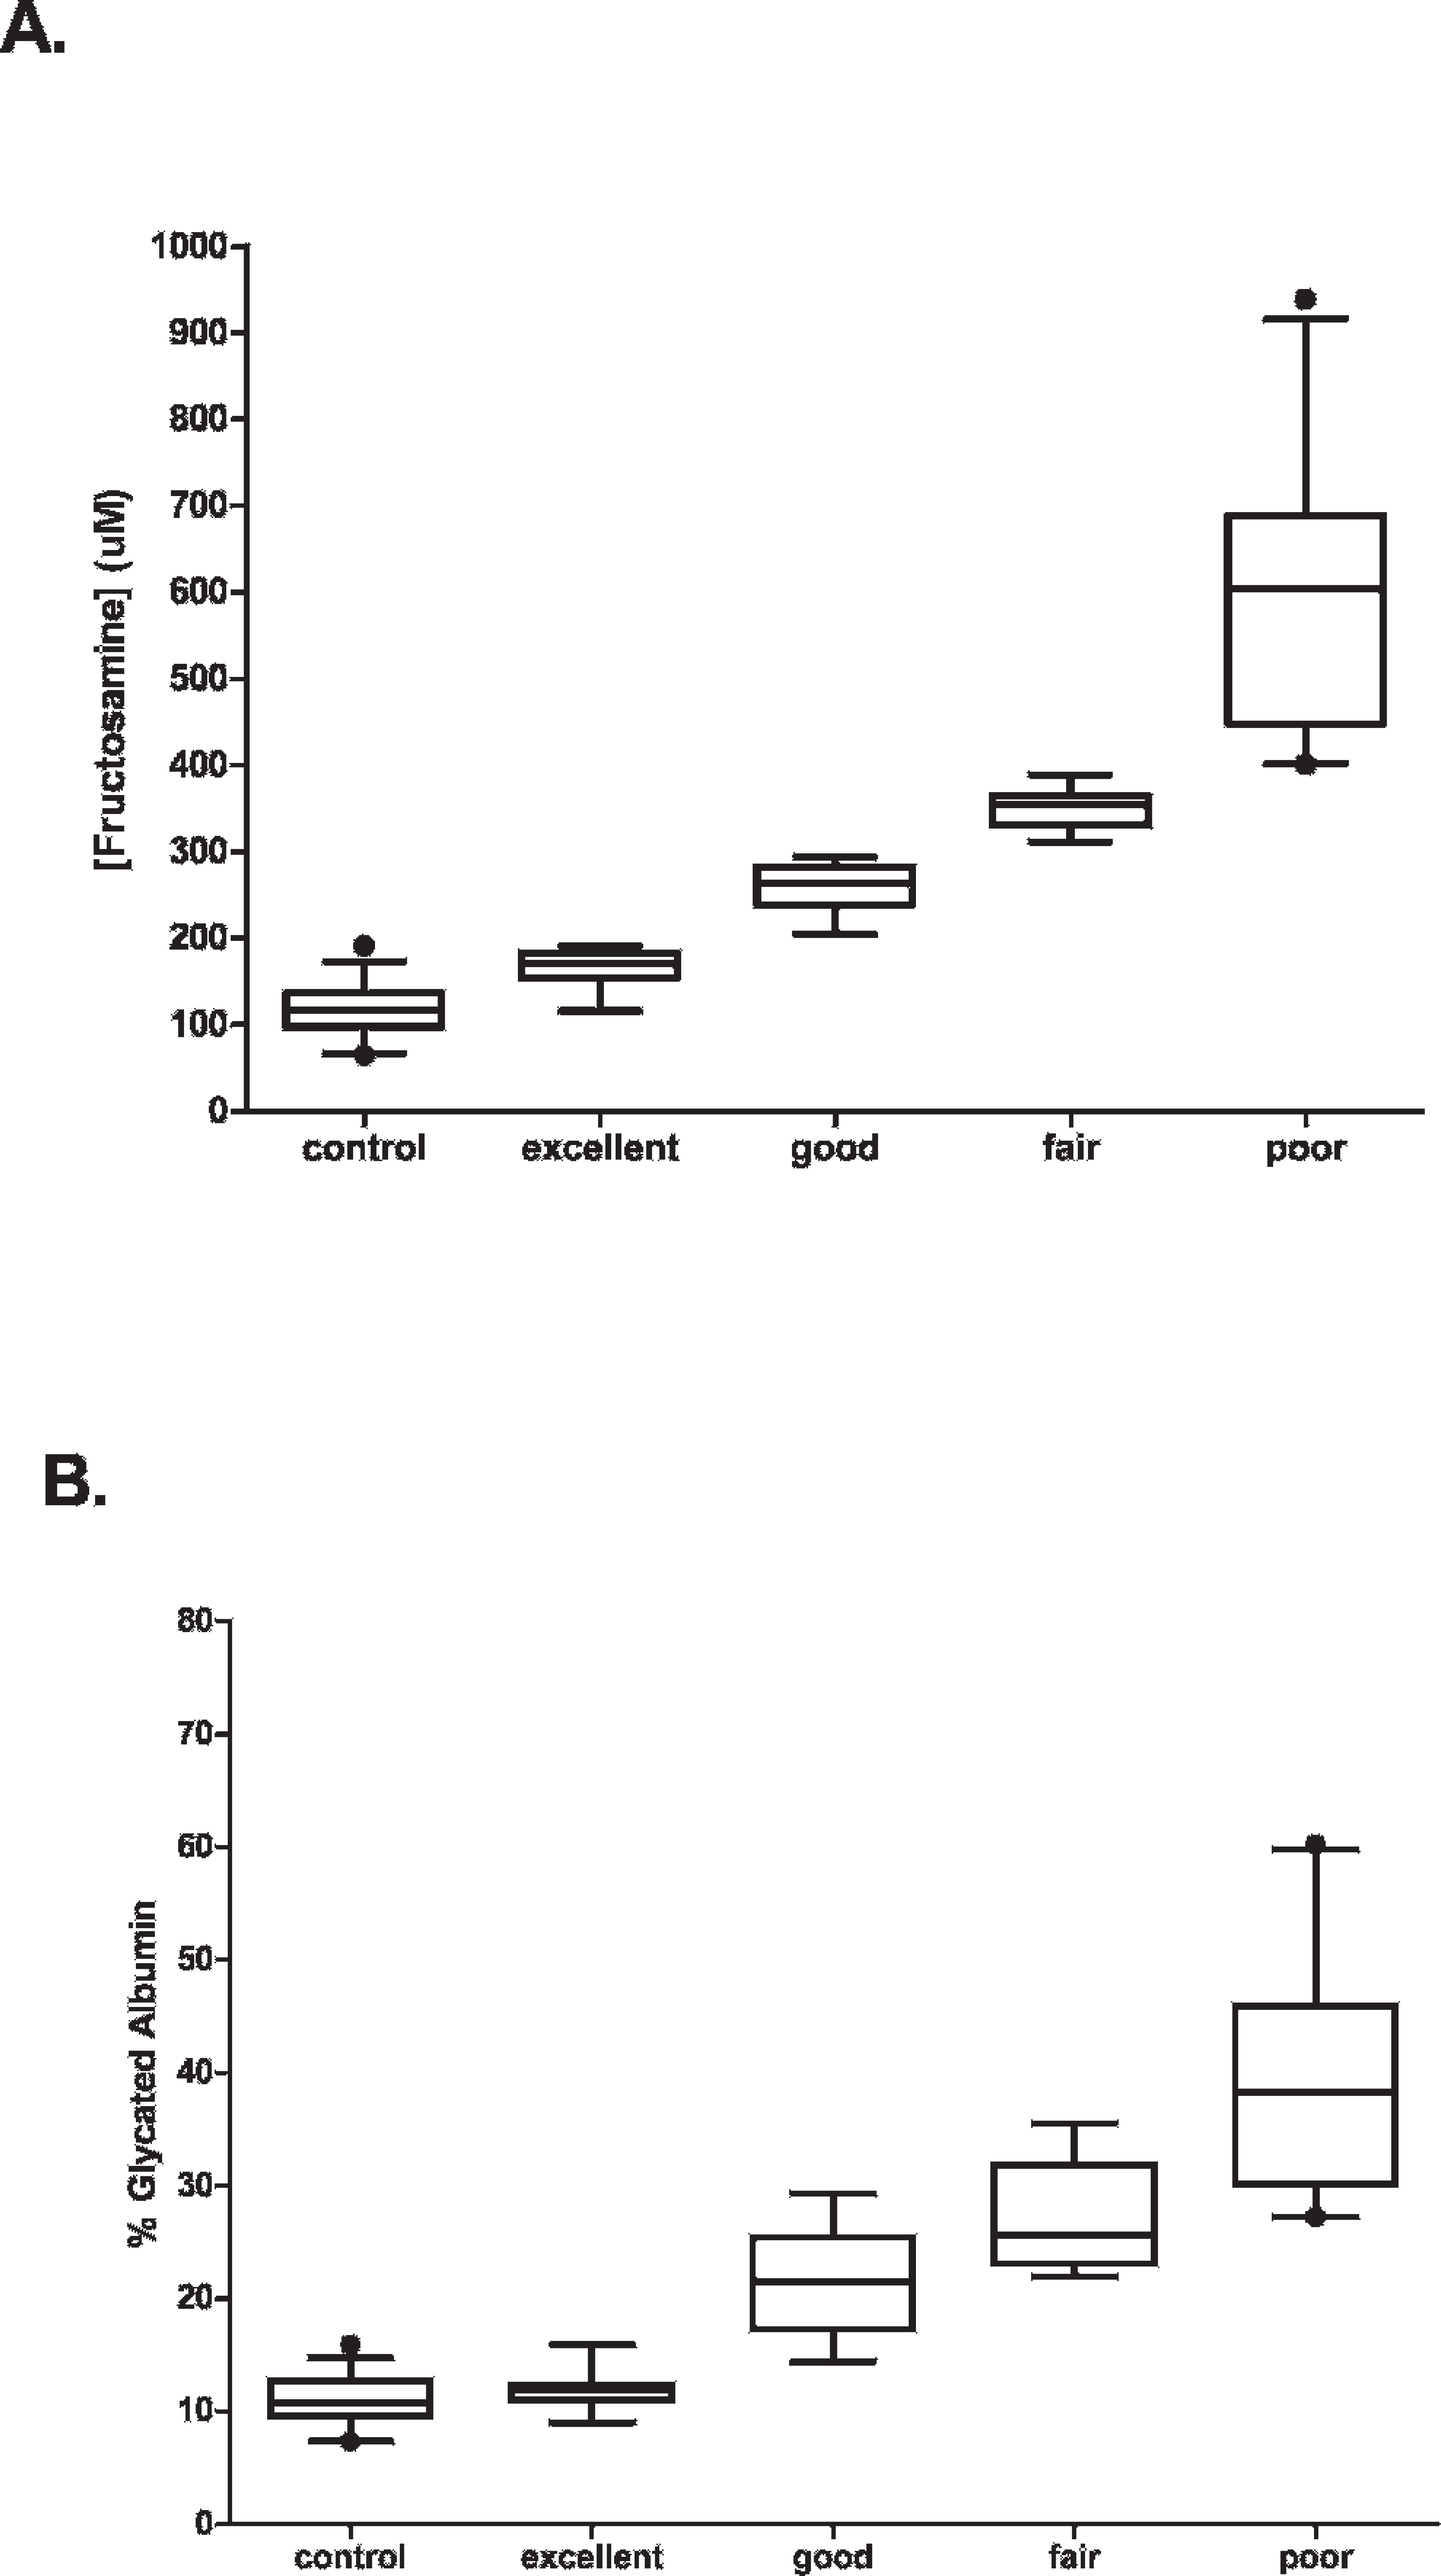
Diabetic cats had significantly higher serum fructosamine and GA levels as compared to control animals (Fig. 1, P < 0.05, Mann-Whitney U-test). When fructosamine and GA levels were examined for each group, a positive correlation between fructosamine and GA percentage was observed (control group: r = 0.785, P < 0.001; DM group: r = 0.939, P < 0.001; Fig. 2A, 2B). When both groups were combined, a positive correlation (r = 0.967, P < 0.001) was observed for all animals (Fig. 2C). A high level of correlation between GA and fructosamine was observed with control and diabetic cats. Moreover, this correlation occurred with a range of serum level regardless of breed and age of cats, thus illustrating its strength.
To the authors' knowledge, a normal GA percentage range in cats has never been previously reported. Since fructosamine and GA levels positively correlated, a GA percentage reference range originating from healthy normal cats would be considered useful for diagnosing and treatment monitoring of diabetic cats for glycemic control. The feline population representing the control group passed the D'Agostino–Pearson omnibus test revealing a Gaussian distribution (P = 0.55). The reference interval of serum GA percentage in control cats was determined to be 7.5–13.9% (95% nonparametric interfractile interval). Because GA percentage was determined using a combination of 2 different assays, it was important to assess its reproducibility and imprecision. Analytical evaluation of the serum GA assay with Lucica GA-L and Auto Wako Albumin indicated acceptable analytical imprecision, with intra- and interassay coefficients of variation (CVs) not exceeding the commonly accepted 5% limit (Table 3). Intra- and inter-assay CVs for GA percentage with normal (level 1) levels of GA were <4.0% and <3.0%, respectively. When abnormal (level 2) levels of GA were tested, intra- and interassay CVs for GA percentage were <3.0%. Moreover, excellent linearity was demonstrated with all of the dilutions tested, up to 32-fold dilution (Table 4), with an intra-assay CV of 1.0%, indicating that the serum GA assay with Lucica GAL and Auto Wako Albumin is reliable and that its results are reproducible and accurate.
Linearity and sensitivity of the glycated albumin (GA) assay.*
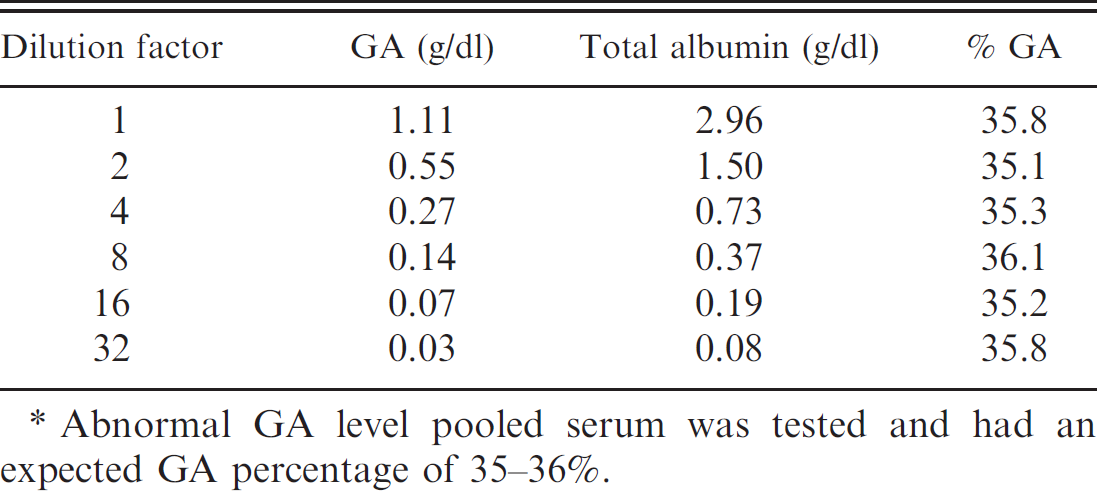
Abnormal GA level pooled serum was tested and had an expected GA percentage of 35–36%.
Relationship between fructosamine, glycated albumin (GA) percentage, and glycemic control.*
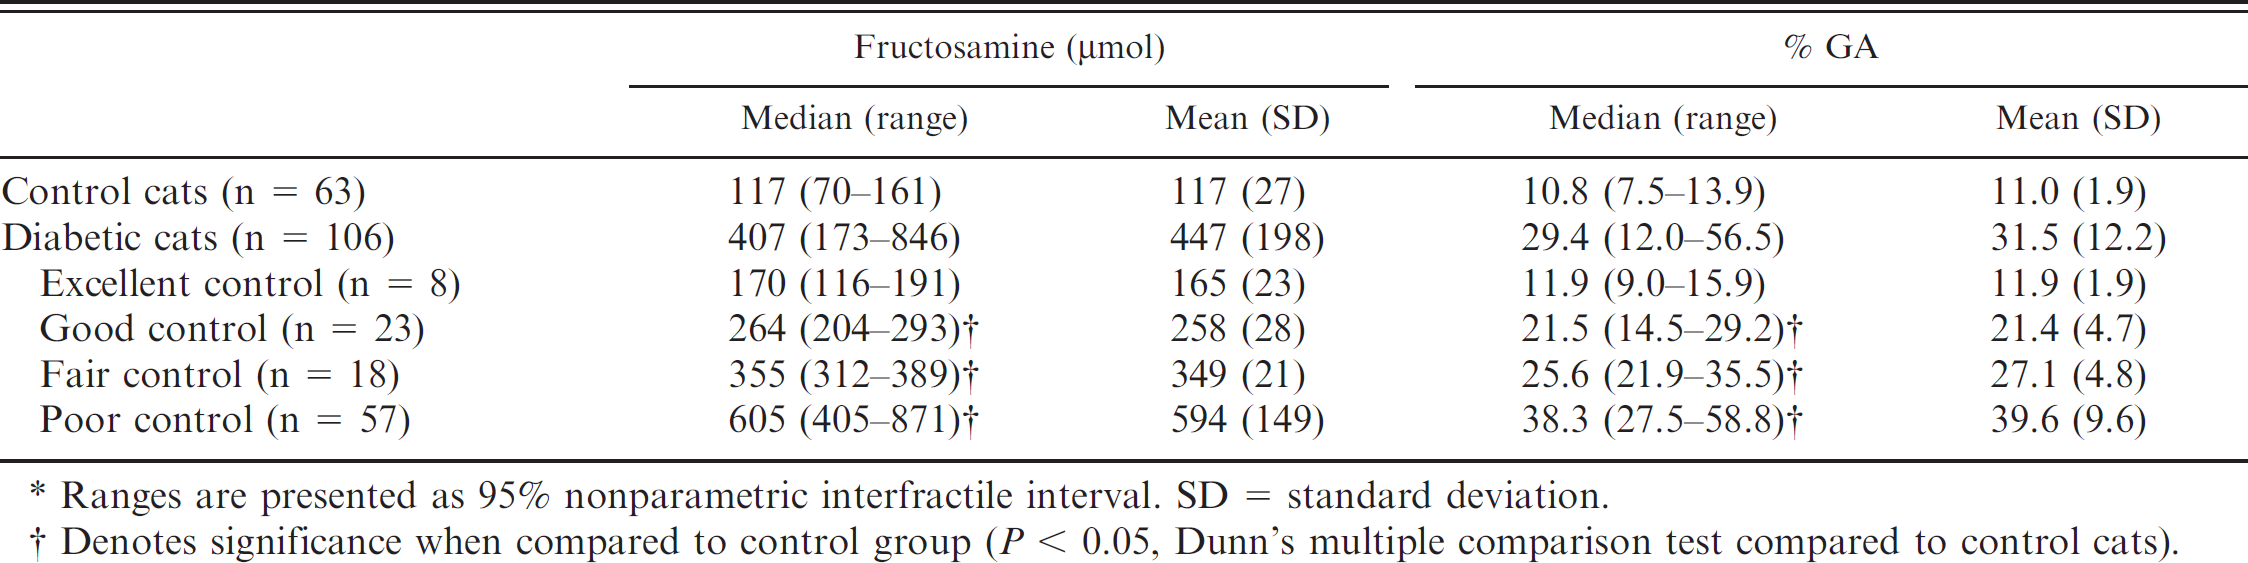
Ranges are presented as 95% nonparametric interfractile interval. SD = standard deviation.
Denotes significance when compared to control group (P < 0.05, Dunn's multiple comparison test compared to control cats).
In order to use GA percentage as a gauge, diabetic cats were categorized based on glycemic control level (Table 2) to create a link between glycemic control level and GA percentage (Table 5). Interestingly, no significant difference (Dunn's multiple comparison test) in serum GA percentage and fructosamine was observed between diabetic cats categorized as excellent and control cats. However, good, fair, and poor control diabetic cats resulted in significant increases in serum GA percentage and fructosamine compared to control cats (Fig. 3). In fact, excellent control–categorized cats had their GA percentage range overlap with that of control cats. Furthermore, GA percentage ranges overlapped between adjacent glycemic control levels (especially good and fair; fair and poor) as compared to fructosamine ranges (Fig. 3). As such, determination of cutoff points between adjacent glycemic control levels in GA percentage was very important. The cutoff points were calculated by ROC analysis and were as follows: 13.4% (good vs. excellent), 23.5% (good vs. fair), and 29.2% (fair vs. poor; Table 6). Interpretation of serum fructosamine in a diabetic cat must consider that diabetic cats with excellent control may be at high risk for hypoglycemia, 1 which is the most serious condition seen with insulin-treated diabetic cats. Therefore, the ideal level of glycemic control for diabetic cats may correspond to a GA percentage of 13.4–23.5%. This interval is between the cutoff points for good glycemic control in diabetic cats.
Interpretation of the glycemic control level in glycated albumin (GA) calculated by receiver operating characteristics (ROC) curves.
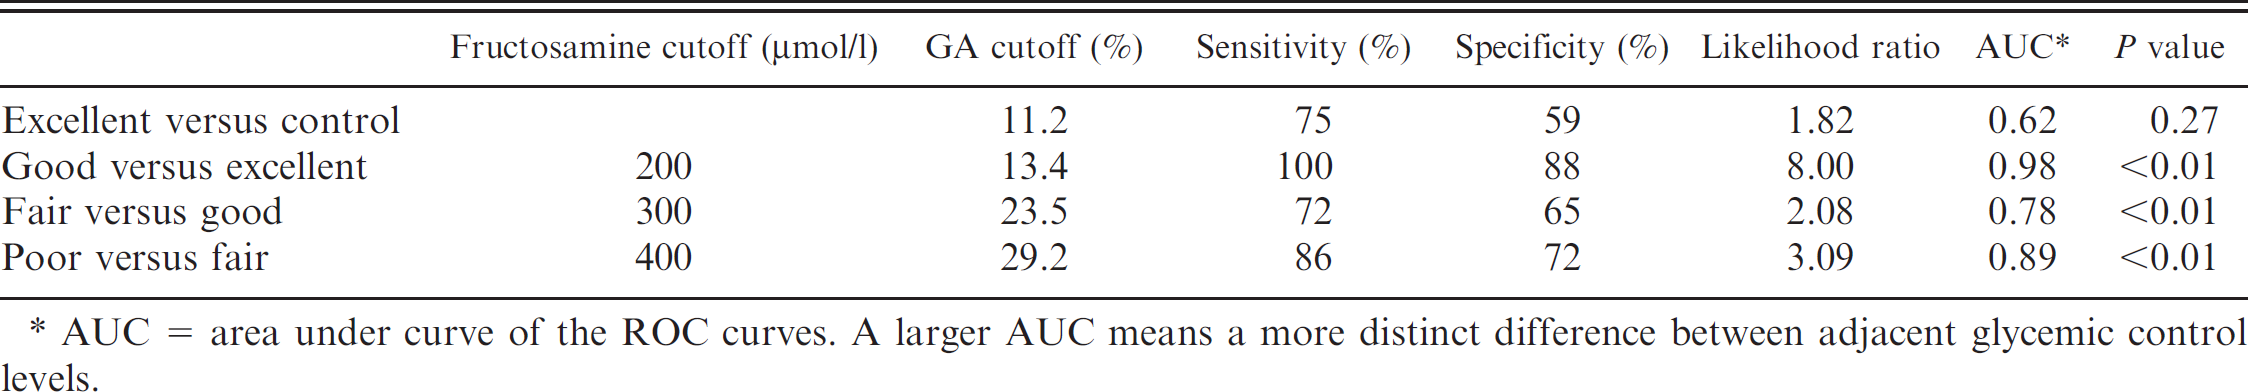
AUC = area under curve of the ROC curves. A larger AUC means a more distinct difference between adjacent glycemic control levels.
In conclusion, serum fructosamine concentration can reflect long-term changes in blood glucose concentration and the effect of injected insulin in diabetic cats. 2 Fructosamine and GA levels in humans and canines have been reported to show strong correlation. 6,8 The current study suggests that this correlation also holds true for cats and that GA can be used as a substitute for fructosamine in cats. Moreover, serum GA appears to be a useful diagnostic indicator to monitor glycemic control in diabetic cats as an alternative to fructosamine.
Acknowledgements. The authors wish to thank Nyanda Park for their help in collecting blood samples. This work was supported in part by the Academic Frontier Project Grant awarded to private universities from the Ministry of Education, Culture, Sports, Science and Technology of Japan (MEXT), 2005–2009.
Footnotes
a.
BD Vacutainer® SST II ADVANCE™ Blood Collection Tubes, Becton Dickinson, Tokyo, Japan.
b.
Lucica™ GA-L, Asahi Kasei Pharma Corp., Tokyo, Japan.
c.
JCA-BM8, JEOL Ltd., Tokyo, Japan.
d.
Auto Wako Albumin, Wako Pure Chemical Industries Ltd., Osaka, Japan.
e.
Auto Wako Fructosamine, Wako Pure Chemical Industries Ltd., Osaka, Japan.
f.
GraphPad Prism 5, GraphPad Software Inc., San Diego, CA.