
Abstract
The objective of the current study was to evaluate whether blood plasma progesterone (P4) measurements with a time-resolved fluorescent antibody test (TR-FAT) kit designed for humans was applicable for goats. The first experiment was designed to verify whether the concentrations of P4 measured by TR-FAT can be used to monitor the estrous and ovarian activity in goats (n = 14). Blood samples (322) were collected, and the ovaries were scanned using ultrasonography. The second experiment was carried out on 4 goats (60 samples) and designed to compare the TR-FAT with radioimmunoassay (RIA). The time interval between the lowest concentrations of P4 assayed by TR-FAT was 21 ± 0.3 days and did not differ significantly from the length of the interestrous interval. The highest concentrations of P4 were confirmed by detection of corpus luteum. During estrus, the mean concentration did not differ significantly between both methods. Significant differences were present during the luteal phases; however, the profiles of P4 assayed by both methods followed a similar pattern. Regression analysis showed a correlation between the 2 methods (r = 0.98; r 2 = 0.96; P < 0.0001). The Bland-Altman plot showed that all averages were within the 95% limits of agreement; however, the differences between both methods tend to be greater as the average increases. The results demonstrated that the TR-FAT method can be applied to monitor estrous cycles in goats through measurements of plasma P4 concentrations. Moreover, not only does the TR-FAT meet the requirements for safety, but it is also a method of high throughput, rapidity, and simplicity.
Keywords
Introduction
In goats, the plasma progesterone (P4) concentration, measured during various physiologic stages, is one of the most important parameters of the reproductive status of a doe. Progesterone concentrations are used to monitor the luteal function, estrous cycle, and seasonality of reproduction, given that they reflect the development and regression of the corpus luteum. 4 Moreover, P4 concentrations can be used to predict ovulation and detect estrus, 3,9,14 as well as to diagnose follicular cysts. 11 The parameter can also be helpful in a diagnosis of gestation status 9,14 and parturition date estimations. 15 Because the information on plasma P4 concentration in goats is so valuable, a commercially available measuring kit and a simple procedure are highly desirable. According to the majority of reports published to date, P4 analysis in goats has been carried out mainly by radioimmunoassay (RIA). 3,10 For obvious reasons, this procedure must be carried out with special safety procedures in laboratories authorized to work with radioactive materials. Hence, research has been undertaken to seek new nonisotopic methods of P4 concentration measurement in animals, such as enzyme immunosorbent assay (EIA) 15 or fluorescent antibody test (FAT). 18,19 The time-resolved fluorescent antibody test (TR-FAT) is a method that combines highly purified antigens and monoclonal antibodies in a sandwich-type assay, with the long fluorescence decay time of lanthanide chelates, such as europium, samarium, and terbium, used as labels, and a special time-resolving fluorometer for nanosecond measurements. This system has advantages over RIA, such as being free from radiologic decay and meeting relevant safety requirements. 16,18 A direct TR-FAT system was evaluated for measuring P4 concentrations in Sika deer, 18 Iberian red deer, 13 and cattle. 7 The results of these studies indicated that commercially available TR-FAT kits designed for the human hospital market could be used for the determination of P4 concentration in females of these ruminants. So far, however, there have been no reports of practical applications of this assay for plasma P4 analysis in goats.
The objective of the current study was to verify that the P4 assayed by FAT kits designed for humans can be used to monitor the estrous and ovarian activity in goats. In this context, TR-FAT profiles of P4 were carried out during goat estrous cycles and tested to determine whether high P4 concentrations measured by this method are associated with the development of the corpus luteum. In addition, the P4 concentrations obtained by the TR-FAT were compared with those measured by conventional RIA.
Materials and methods
Animals
Two experiments were conducted in the present study. These experiments were carried out on mature (2.5 years of age, weighing 50 ± 6.2 kg), nonpregnant, and nonlactating goats of German Improved White breed, managed on the experimental farm of the Department of Animal Reproduction (Szczecin, Poland; latitude 53°23′N). The study was conducted during the breeding season (beginning in October). The animals were fed a diet of oats, wheat bran, and sugar beet pulp, supplemented by vitamins and good-quality hay. Water and mineral licks were offered ad libitum. The goats were kept indoors at night and outside for most of the day. All does used in the study had no previous records of reproductive disorders and were in good body condition. The experiments were approved by the Local Ethical Committee for Experiments on Animal of the University of Agriculture (Szczecin, Poland; protocol 12/2003).
Experiment 1
Experiment 1 was designed to verify whether the concentrations of P4 measured by TR-FAT could be used to monitor the estrous and ovarian activity in goats. This part of the study was carried out on 14 goats and included 3 consecutive and spontaneous estrous cycles for each goat. Blood plasma samples (322) were collected at intervals of 3 days beginning on day 0 of the first estrous cycle. The blood was taken from the external jugular vein into heparinized vacutainer tubes during the same time of the day (morning). After centrifugation at 2,000 × g for 15 min, the plasma was collected and stored frozen at −20°C until analyzed for P4.
Estrus was checked daily by visual observation (changes in behavior, restlessness, vulva redness and swelling, tail wagging, bleating, and clear mucous discharge from the vulva). 3 Furthermore, ovarian activity was evaluated by ultrasound. The ovaries were observed using transrectal real-time ultrasonography 6,11,12 at the time blood samples were collected. Ultrasonographic images were obtained with a B-mode ultrasound scanner, a coupled with a transrectal 7.5-MHz linear probe. During the experiment, 1 of 14 goats exhibited estrous behavior for a longer period. The ovaries of that particular goat were observed from day 12 to day 24 post estrus.
Experiment 2
Experiment 2 was designed to compare the TR-FAT with the RIA for the assay of plasma P4. In this part of the study, changes in P4 concentration during 2 consecutive estrous cycles in 4 goats were simultaneously assayed using RIA and TR-FAT. Blood samples were collected as described above (experiment 1). Plasma was separated and divided into 2 vials (60 plasma samples for each method).
. Analytical parameters of progesterone assay using time-resolved fluorescent antibody test (TR-FAT) and radio-immunoassay (RIA).
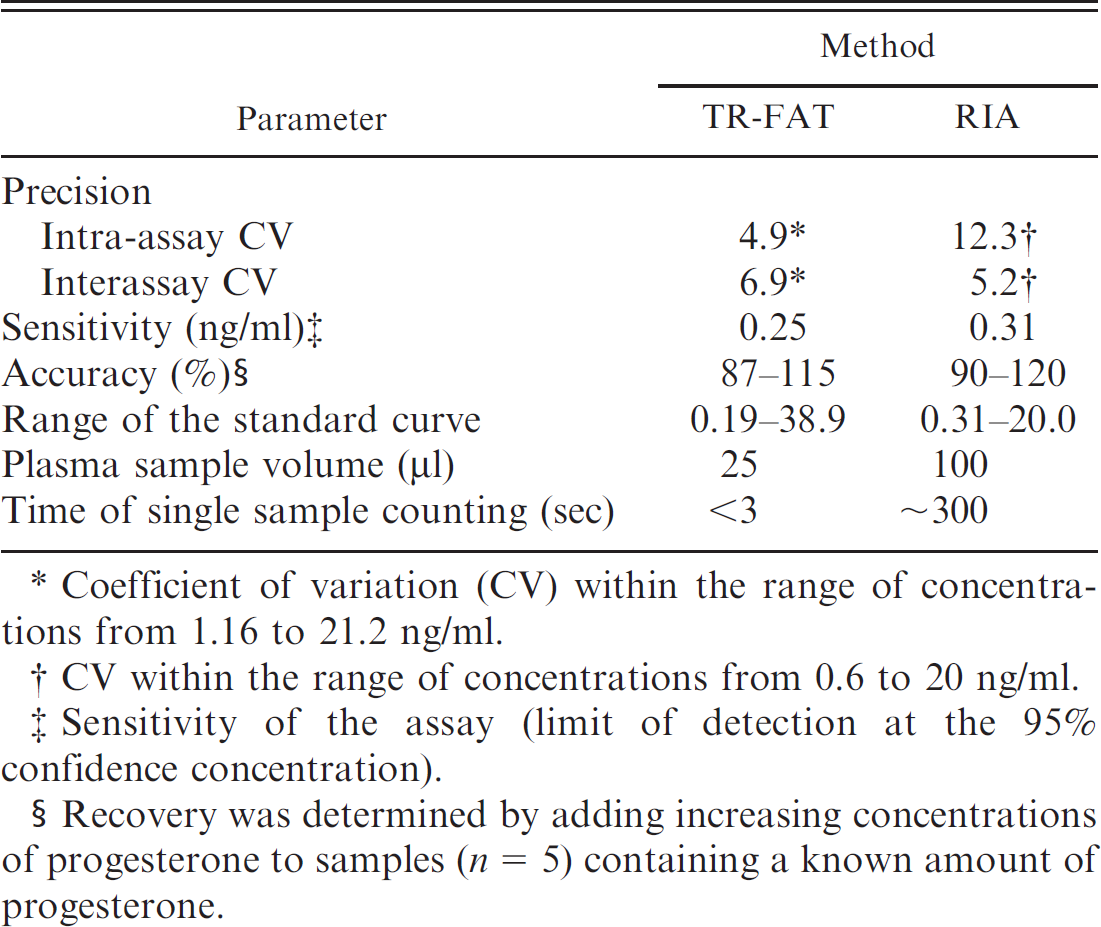
Coefficient of variation (CV) within the range of concentrations from 1.16 to 21.2 ng/ml.
CV within the range of concentrations from 0.6 to 20 ng/ml.
Sensitivity of the assay (limit of detection at the 95% confidence concentration).
Recovery was determined by adding increasing concentrations of progesterone to samples (n = 5) containing a known amount of progesterone.
Progesterone assay
Concentrations of P4 were determined in blood plasma because plasma separation is faster and more convenient compared with serum separation in goats. Progesterone concentration was assayed by TR-FAT and by direct RIA. All samples and standards were carried out in duplicate. Data for the TR-FAT and RIA techniques are presented in Table 1.
Procedure and reagents for the time-resolved fluorescent antibody test
Plasma P4 was measured by TR-FAT with the commercially available kit designed for humans. b This kit is a solidphase fluorescent antibody test based on competition between europium-labeled P4 and sample P4 for anti-P4 antibodies. The kit contains standards, europium-labeled tracer, goat anti-rabbit immunoglobulin G, assay buffer (pH 7.8), washing solution, and enhancement solution. The plasma sample or standard (25 μl), an antibody, and europium-labeled tracer were added to assay plates (96 well, precoated with secondary antibody) according to the manufacturer's protocol. The plates were incubated for 2 hr at room temperature with slow shaking. The assay was stopped by washing the wells 4 times. After washing, enhancement solution was added to dissociate europium from the antibody–antigen complex, and the plates were shaken for 5 min at room temperature. Time-resolved fluorescence was measured. c
Procedure and reagents for the radioimmunoassay
A direct RIA method was performed as previously described. 17 In this assay, the following reagents were used: anti-P4 serum derived from the immunization of rabbits (a-P/R41), d [1,2,6,7- 3 H] P4 e serving as a tracer, solution of P4 with ovine serum at a concentration of 20 ng/ml (for standards), phosphate buffer (pH 7.3), and charcoal suspension. f The plasma sample (100 μl) was diluted in 400 μl of assay buffer according to the manufacturer's procedure, and the standards were prepared by making a dilution of P4. 3 H-progesterone and anti-P4 serum were added to each tube with standard or plasma dilution, which were then mixed and incubated at 4°C for 1.5 hr. Separation of free from bound P4 was accomplished by treatment with refrigerated charcoal in an ice bath for 10–15 min and then by centrifugation at 4°C for 20 min. The radioactivity of supernatants was measured with a gamma counter. g
Statistical analysis
Daily concentrations of P4 in plasma were normalized to the day of the first estrus (day 0) and were determined for the entire studied period. The resulting data are presented as the mean ± SD and are marked on the graph. The pattern of each curve for each goat allowed determination of the mean interestrous interval and the time between the lowest P4 concentrations, as well as the mean of maximum and minimum concentrations. The midluteal phase was defined as the period encompassing all the days on which daily mean concentrations of P4 did not differ significantly from the maximal mean concentrations. 1 Moreover, the results obtained by the 2 methods were evaluated by a comparison of daily mean concentrations for 4 goats during 2 cycles of estrus. The differences between the days and both methods (experiment 2) were analyzed by analysis of variance and a posthoc test. Duncan's multiple range test was used verify the significance of differences at P < 0.05 and P < 0.01. The linear regression and the Bland-Altman plot 2 were used for comparison between the RIA as the standard and the TR-FAT as the test method. In this graphical test, the difference between the measurements for each sample (RIA minus TR-FAT) was plotted against the average of the 2 measurements (RIA and TR-FAT) for this sample. Statistical analyses were conducted using the STATISTICA version 5.0 h and Analyse-it software. i
Results
Although all the examined animals had no previous records of reproductive disorders, 1 of 14 goats constantly exhibited estrous signs during the last interestrous interval (data presented separately). The remaining 13 goats had their estrous cycles in regular periodicity. The length of the interestrous intervals ranged from 19 to 24 days with a mean of 21 ± 0.2 days. The time interval between the lowest concentrations of P4 assayed by TR-FAT was 21 ± 0.3 days (range: 18–24 days) and did not differ significantly from the length of the interestrous interval.
The mean daily concentrations of plasma P4 assayed by TR-FAT during 3 consecutive estrous cycles are shown in Figure 1. In the first period, on days 0 and 3 of the estrous cycle, the concentrations of P4 were 0.59 ± 0.22 and 1.69 ± 1.30 ng/ml, respectively. The differences between those days in the concentrations of P4 were statistically nonsignificant. During the following days, the concentration of P4 increased (P < 0.01), reaching the highest values on day 12 post onset of estrus. No differences were recorded in the concentrations of this hormone from days 12–15 of the estrous cycle. On day 18, the concentration of P4 significantly decreased (P < 0.01) to the initial concentration on day 21 of the estrous cycle. During subsequent estrous cycles, the profiles of P4 were similar. Analysis of individual profiles showed that the mean maximum concentrations throughout the first, second, and third estrous cycles were 10.88 ± 1.54, 9.59 ± 1.65, and 9.68 ± 1.69 ng/ml, respectively. The midluteal phase lasted from day 12 until day 15 of each estrous cycle. The high concentrations of P4 during these periods were confirmed by detection of at least 1 corpus luteum in each goat by real-time ultrasonography. The corpora lutea were identified as gray echogenic structures with a well-defined contour and, in most cases, a round anechoic central cavity. Selected images of the corpora lutea are shown in Figure 2.
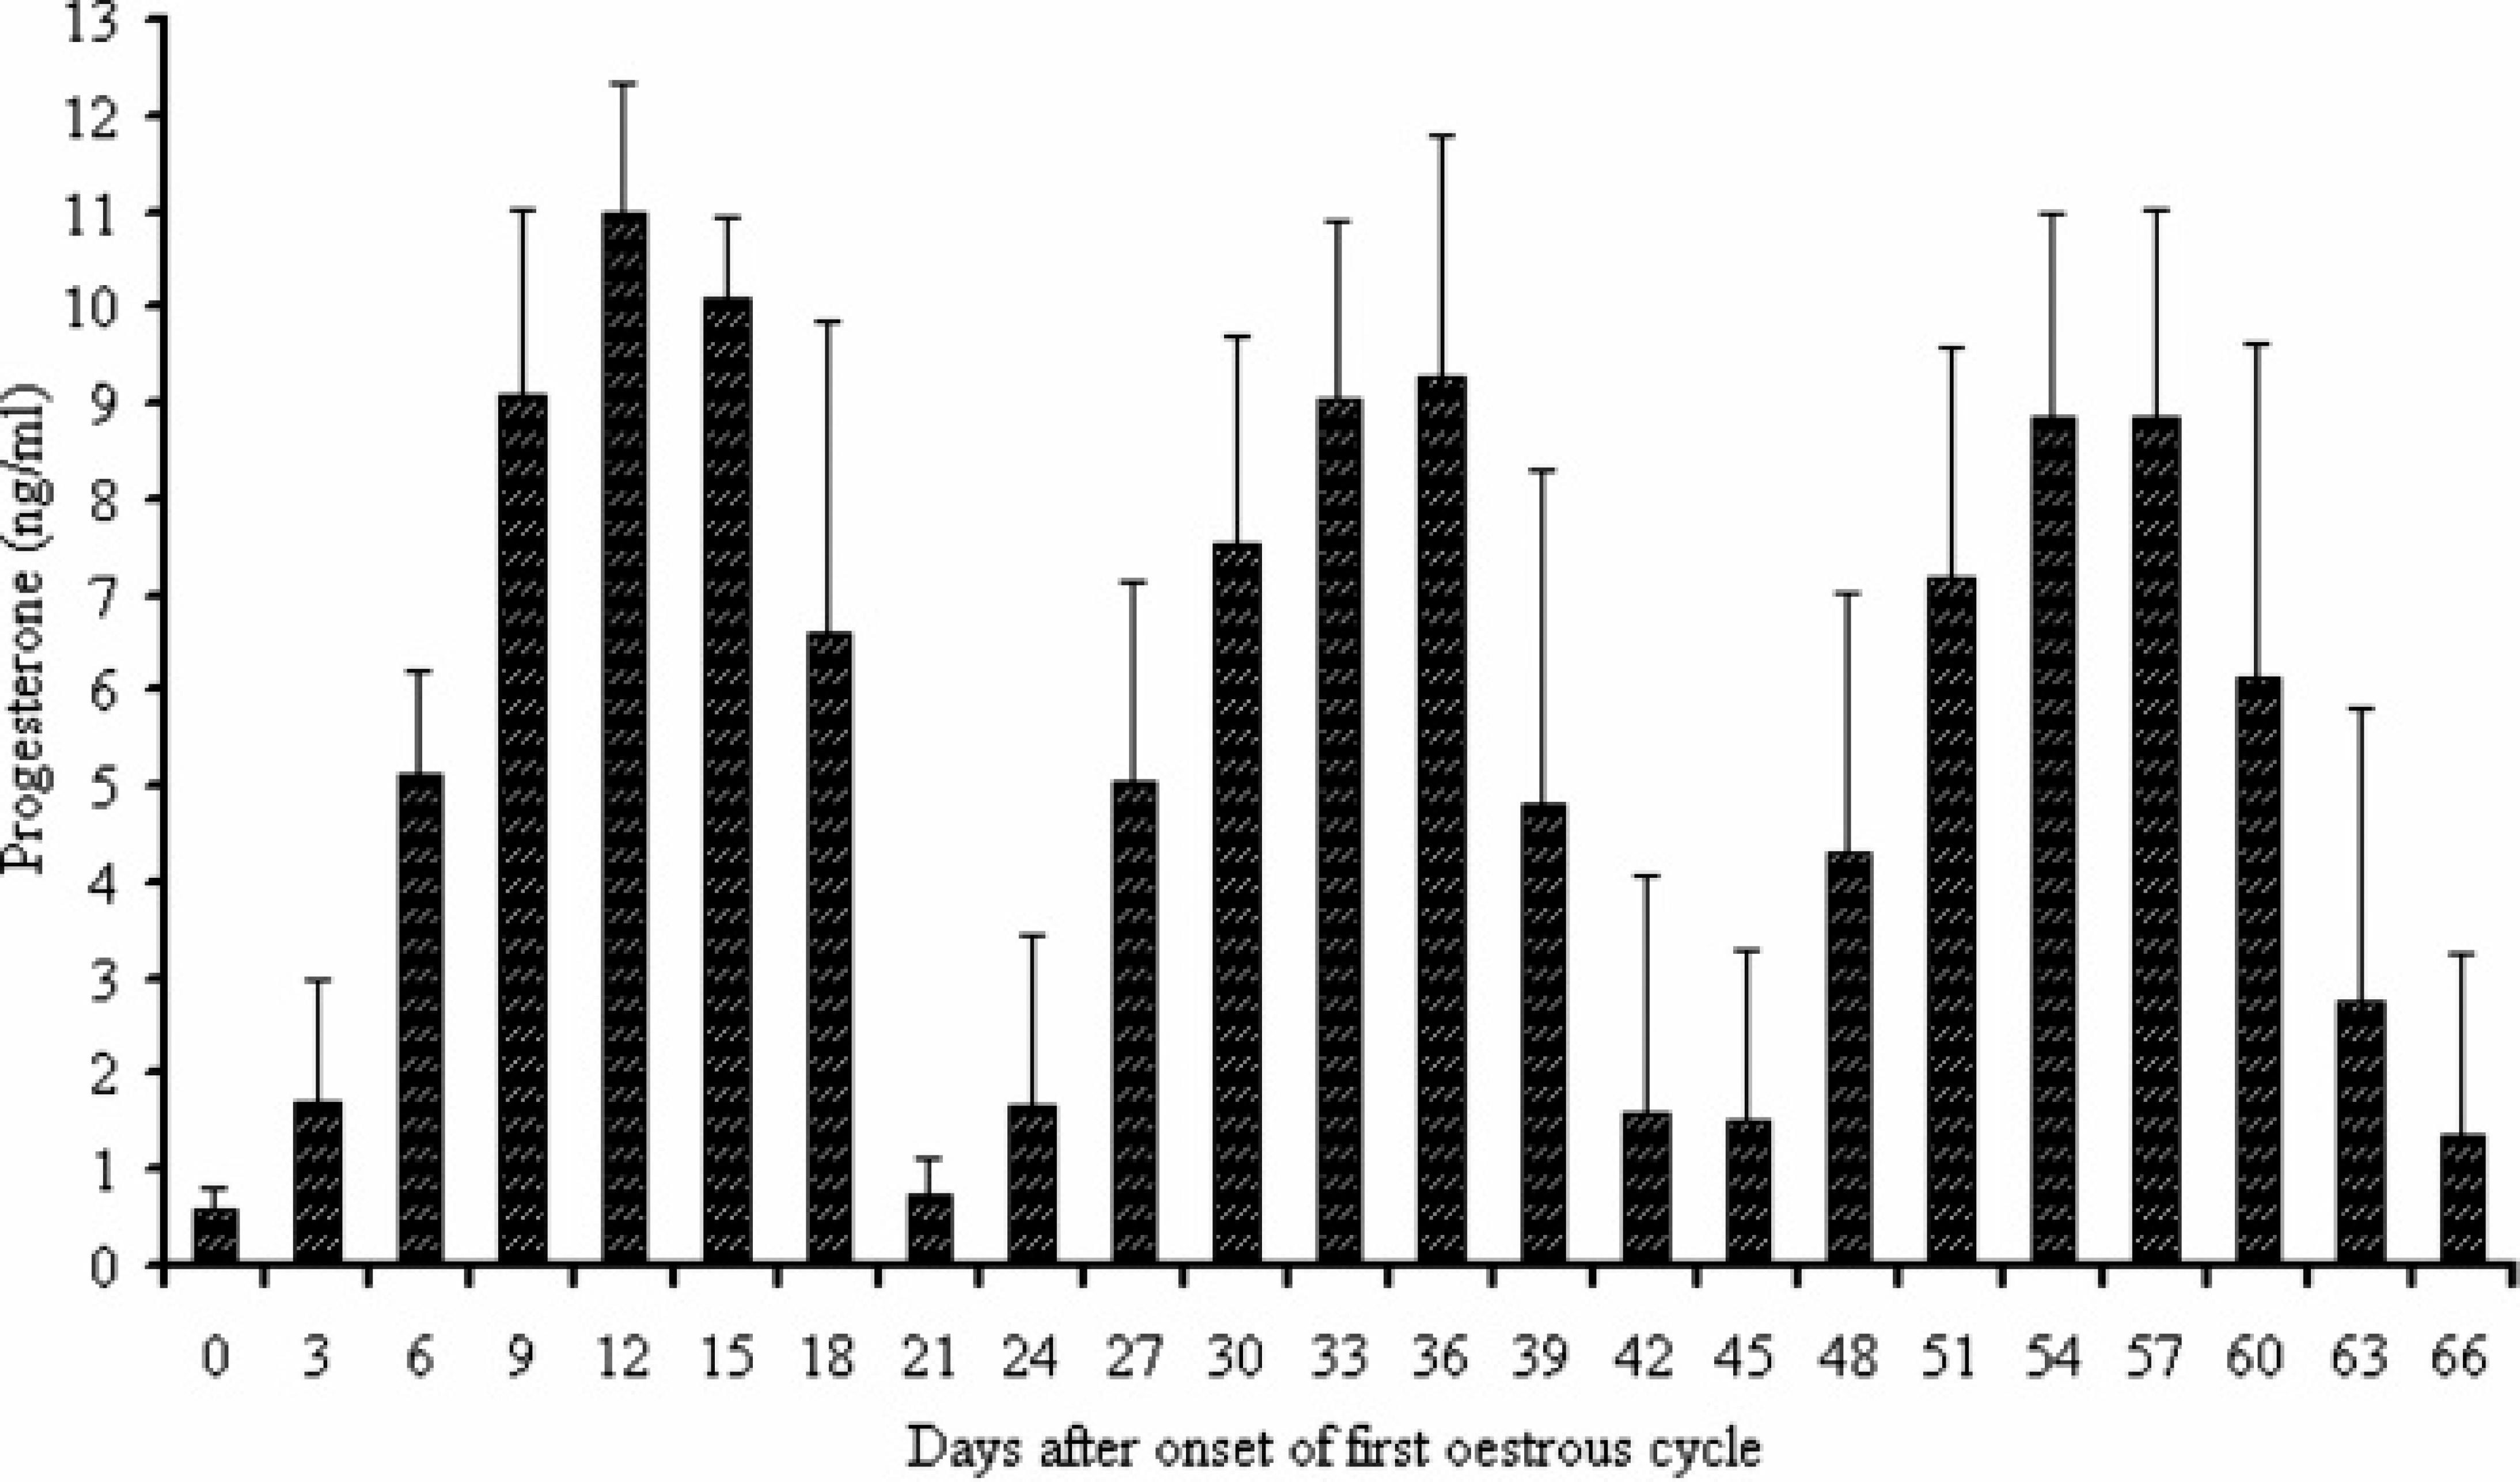
Plasma concentrations of progesterone measured by the time-resolved fluorescent antibody test during 3 consecutive estrous cycles in goats (n = 13). Values are mean ± SD.
Figure 3 presents the changes in P4 concentrations in 1 goat that showed a longer occurrence of estrous signs throughout the last analyzed period. During the first and second estrous cycles, the profile of P4 followed a similar pattern to those in the remainder of goats. However, a decrease in the plasma concentration of P4 (range: 0.27–0.64 ng/ml) post onset of the third estrous cycle was observed until the end of the examined period. Ultrasound observation between days 12 and 24 post estrus found the presence of follicular cysts and the absence of corpus luteum in this goat. Images of the follicular cysts are shown in Figure 4.
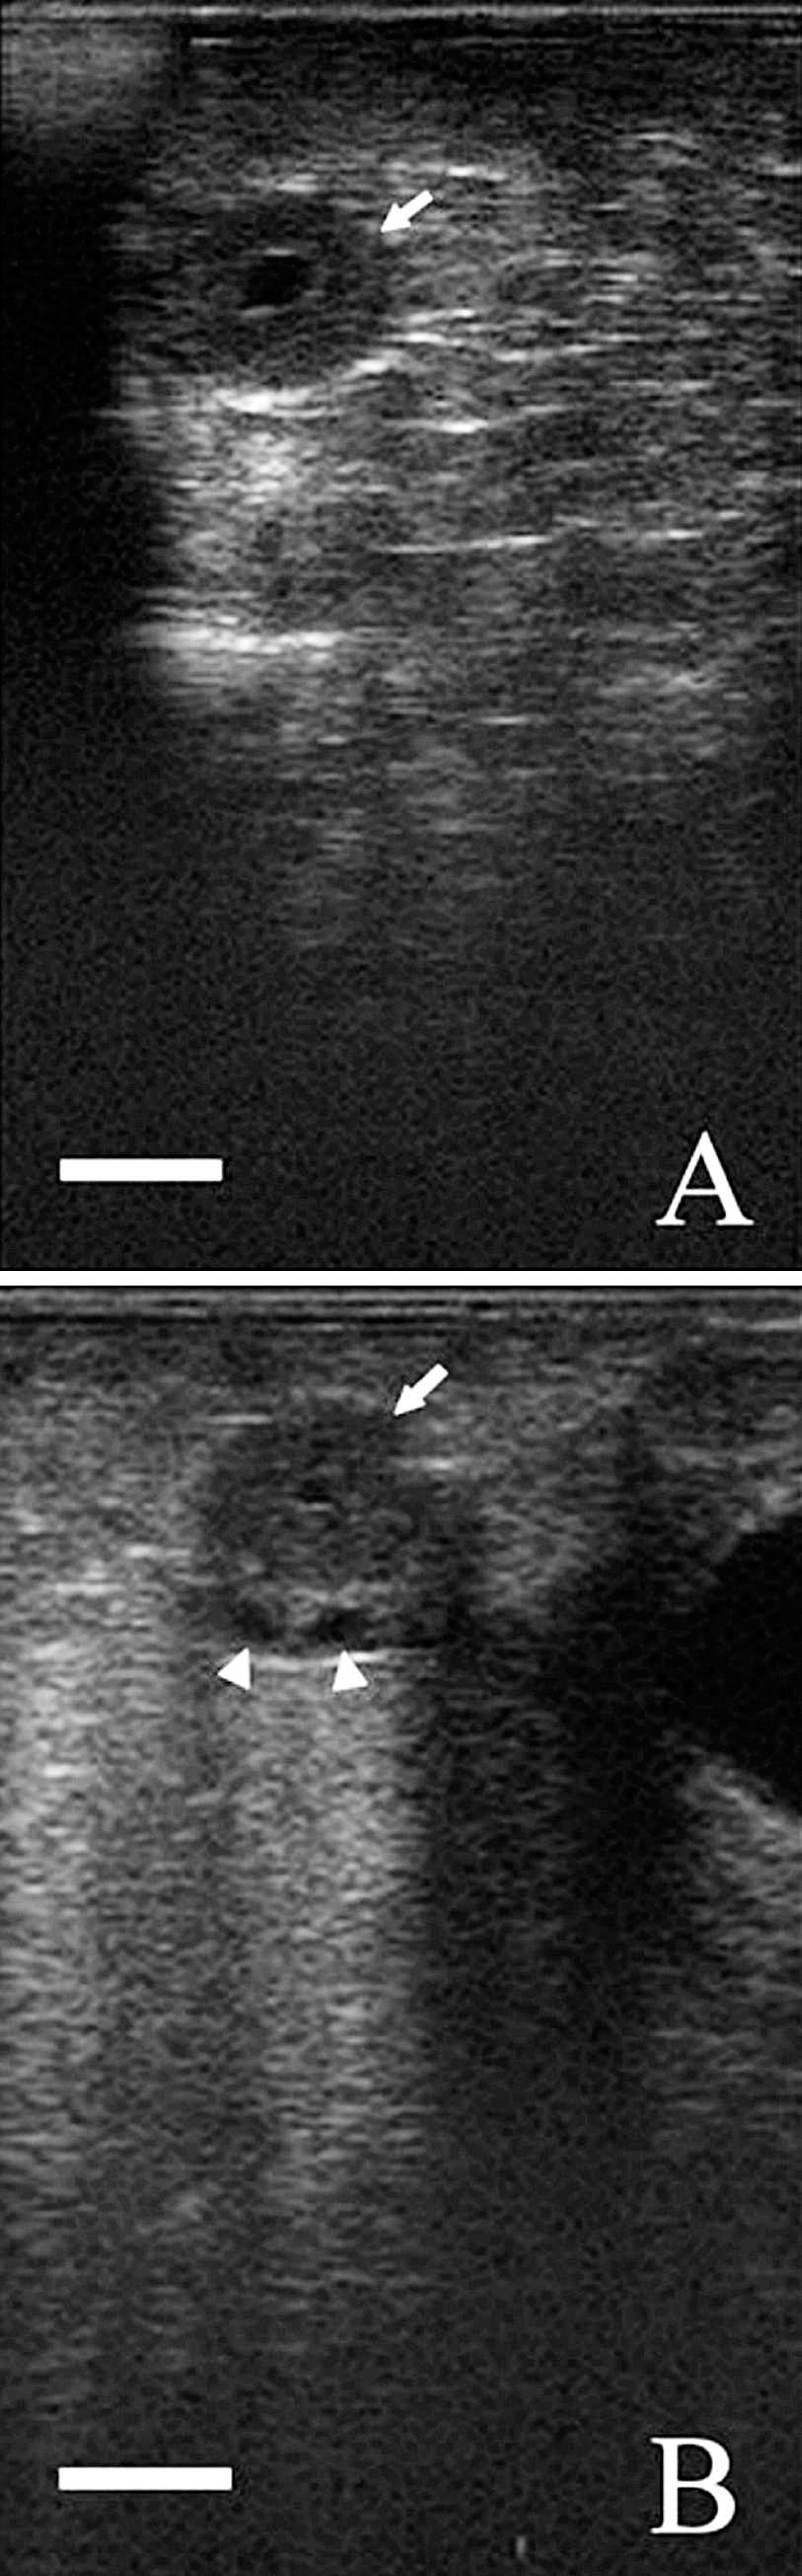
An ultrasound image of a goat ovary 12 days (
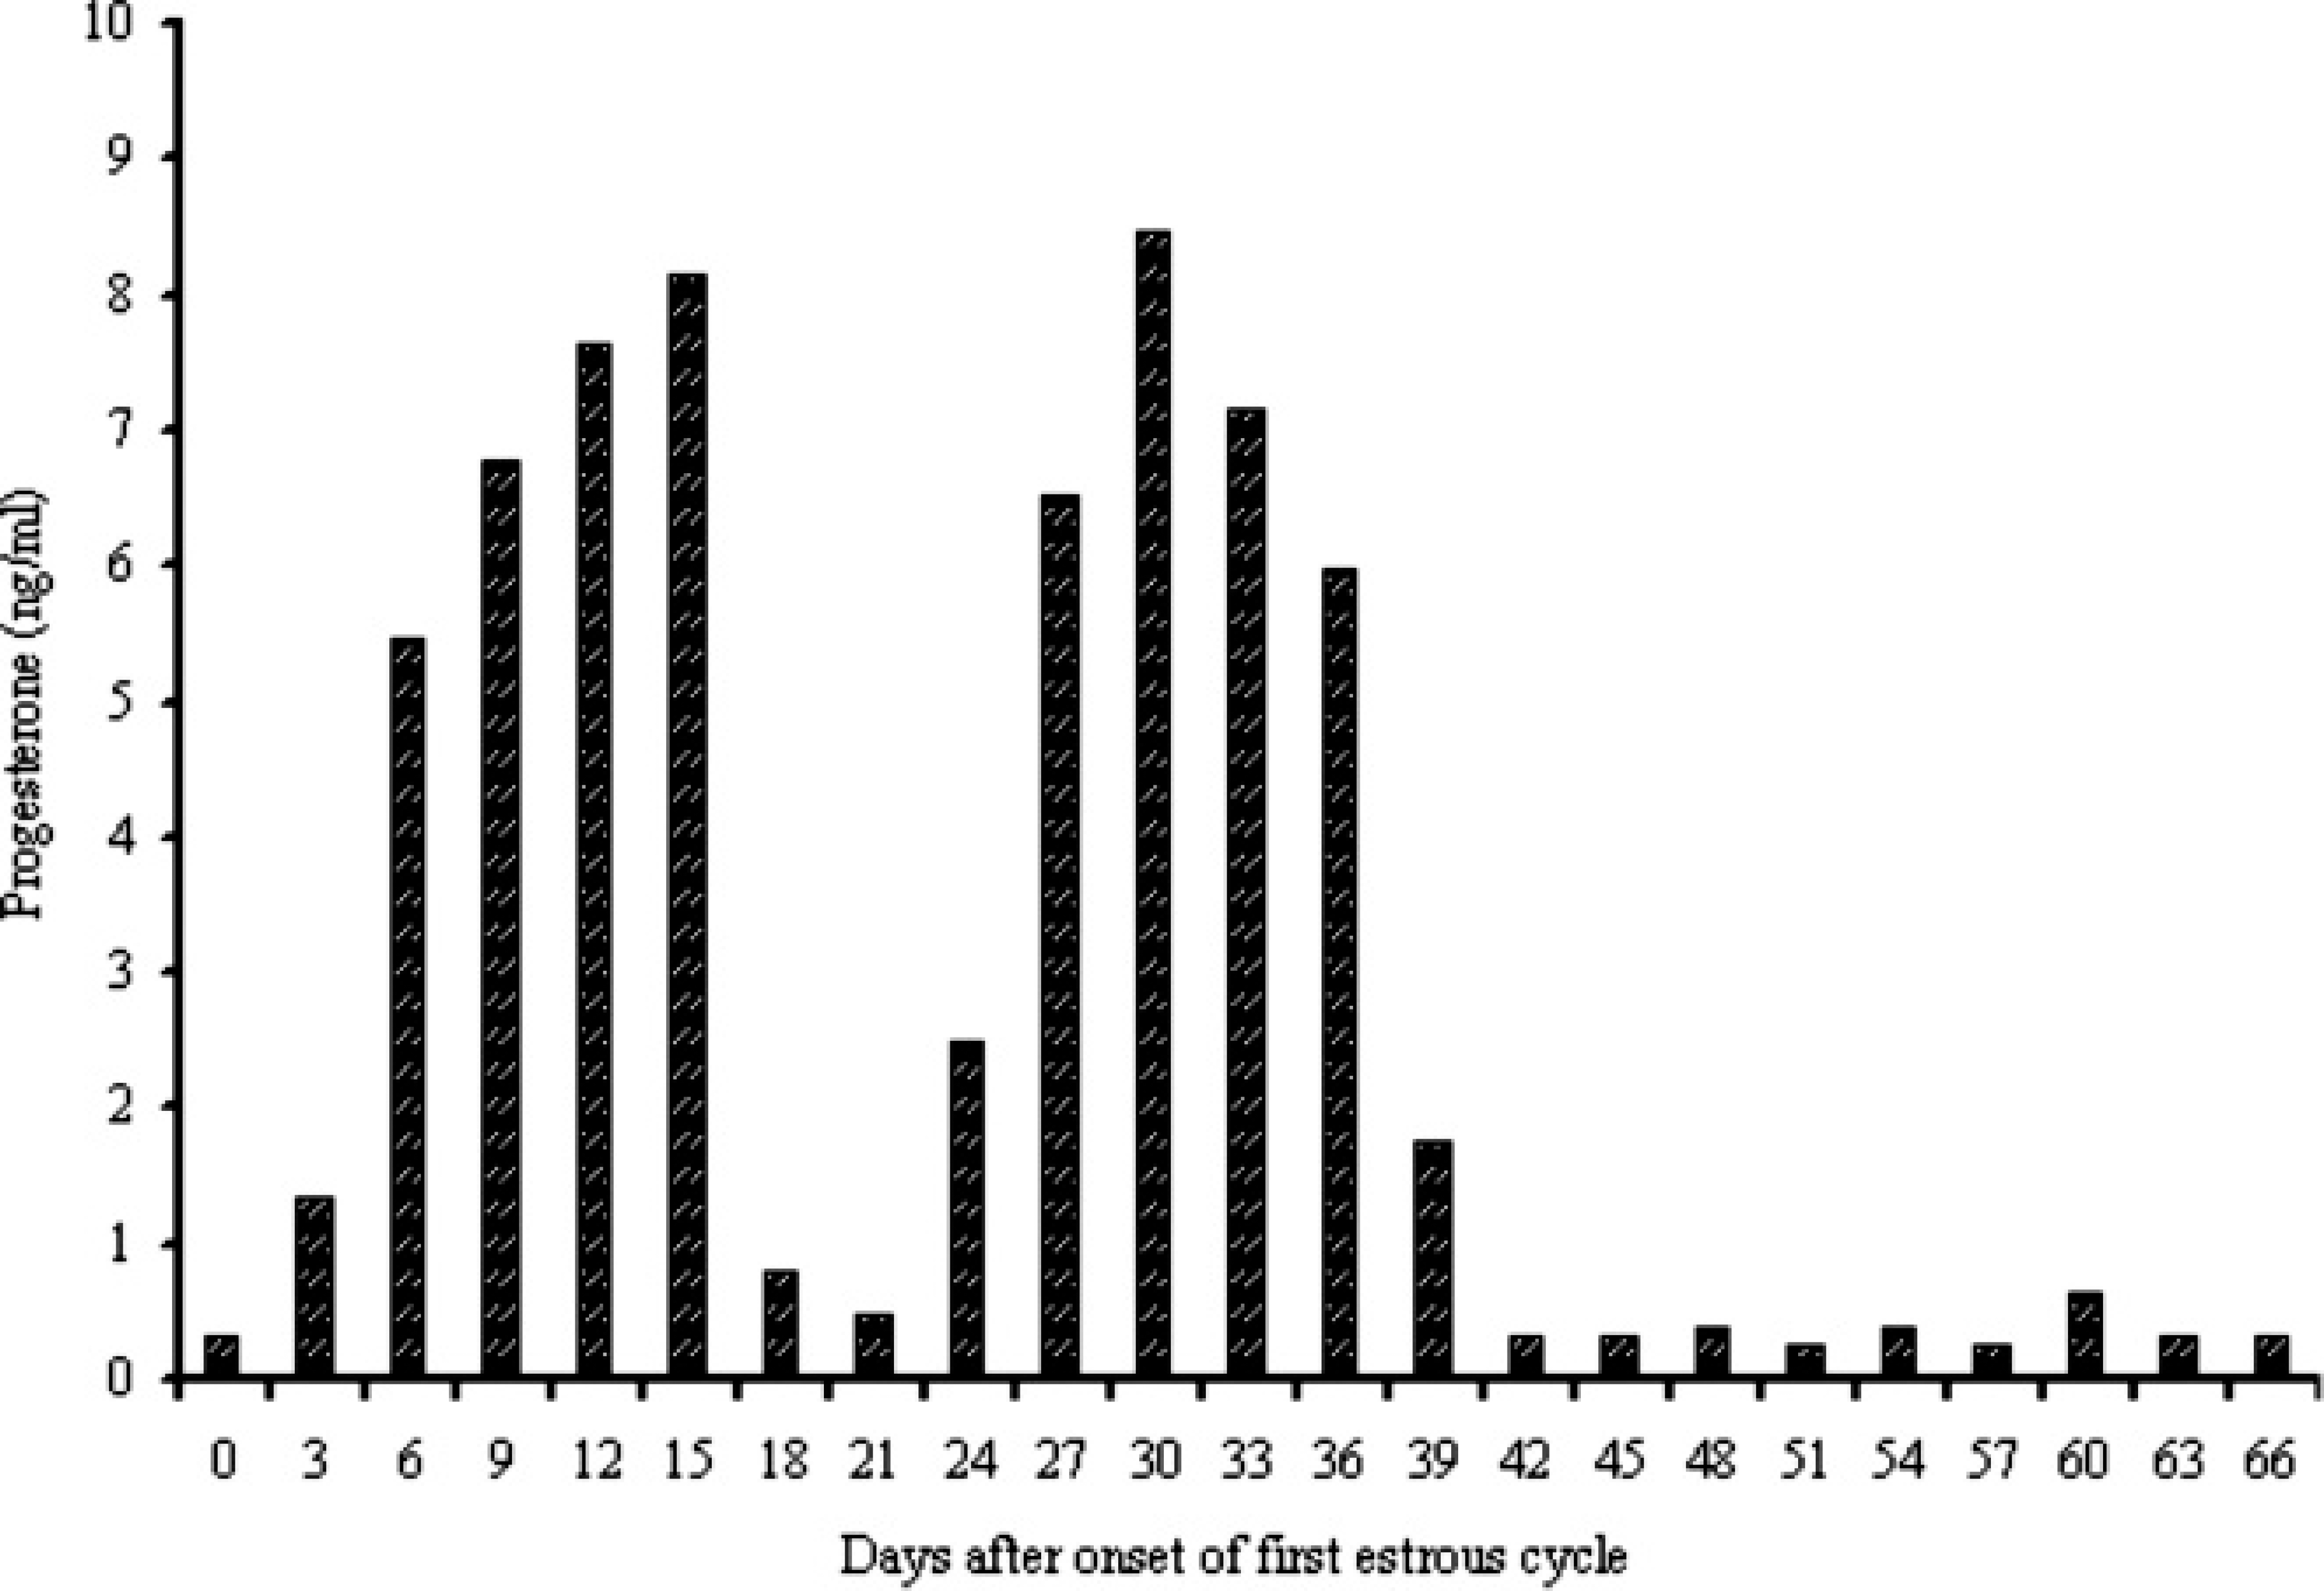
Plasma concentrations of progesterone measured by the time-resolved fluorescent antibody test in a goat with extended estrous behavior.
Figure 5 presents the changes in P4 concentrations measured by the TR-FAT and RIA in 4 goats during 2 consecutive estrous cycles. During estrus, the mean concentration did not differ significantly between both methods. Significant differences with respect to the methods were present during the luteal phases, when the concentrations measured by the TR-FAT were higher. However, the profiles of P4 assayed by both methods followed a similar pattern, and the interval between the days when P4 concentrations reached a nadir were similar (range: 18–21 days).
Figure 6 shows a comparison of P4 concentrations measured by both methods. Calculations showed that the measurements obtained using the TR-FAT kit and those obtained with the conventional RIA were highly correlated, with high coefficients of correlation and regression (Fig. 6A). The Bland-Altman difference plot for paired means of both methods is shown in Figure 6B. The mean difference for 60 sets of measurements was −1.493 ng/ml. The SD of those differences was 1.338 ng/ml. Thus, the limits of agreement (mean ± 1.96 SD) were between −4.115 and +1.129 ng/ml. The SE for the limits of agreement was 0.1727 ng/ml. All points (an average for 2 measurements) were within the 95% limits of agreement; however, Figure 6 shows that the differences tended to be greater when the mean values were higher.
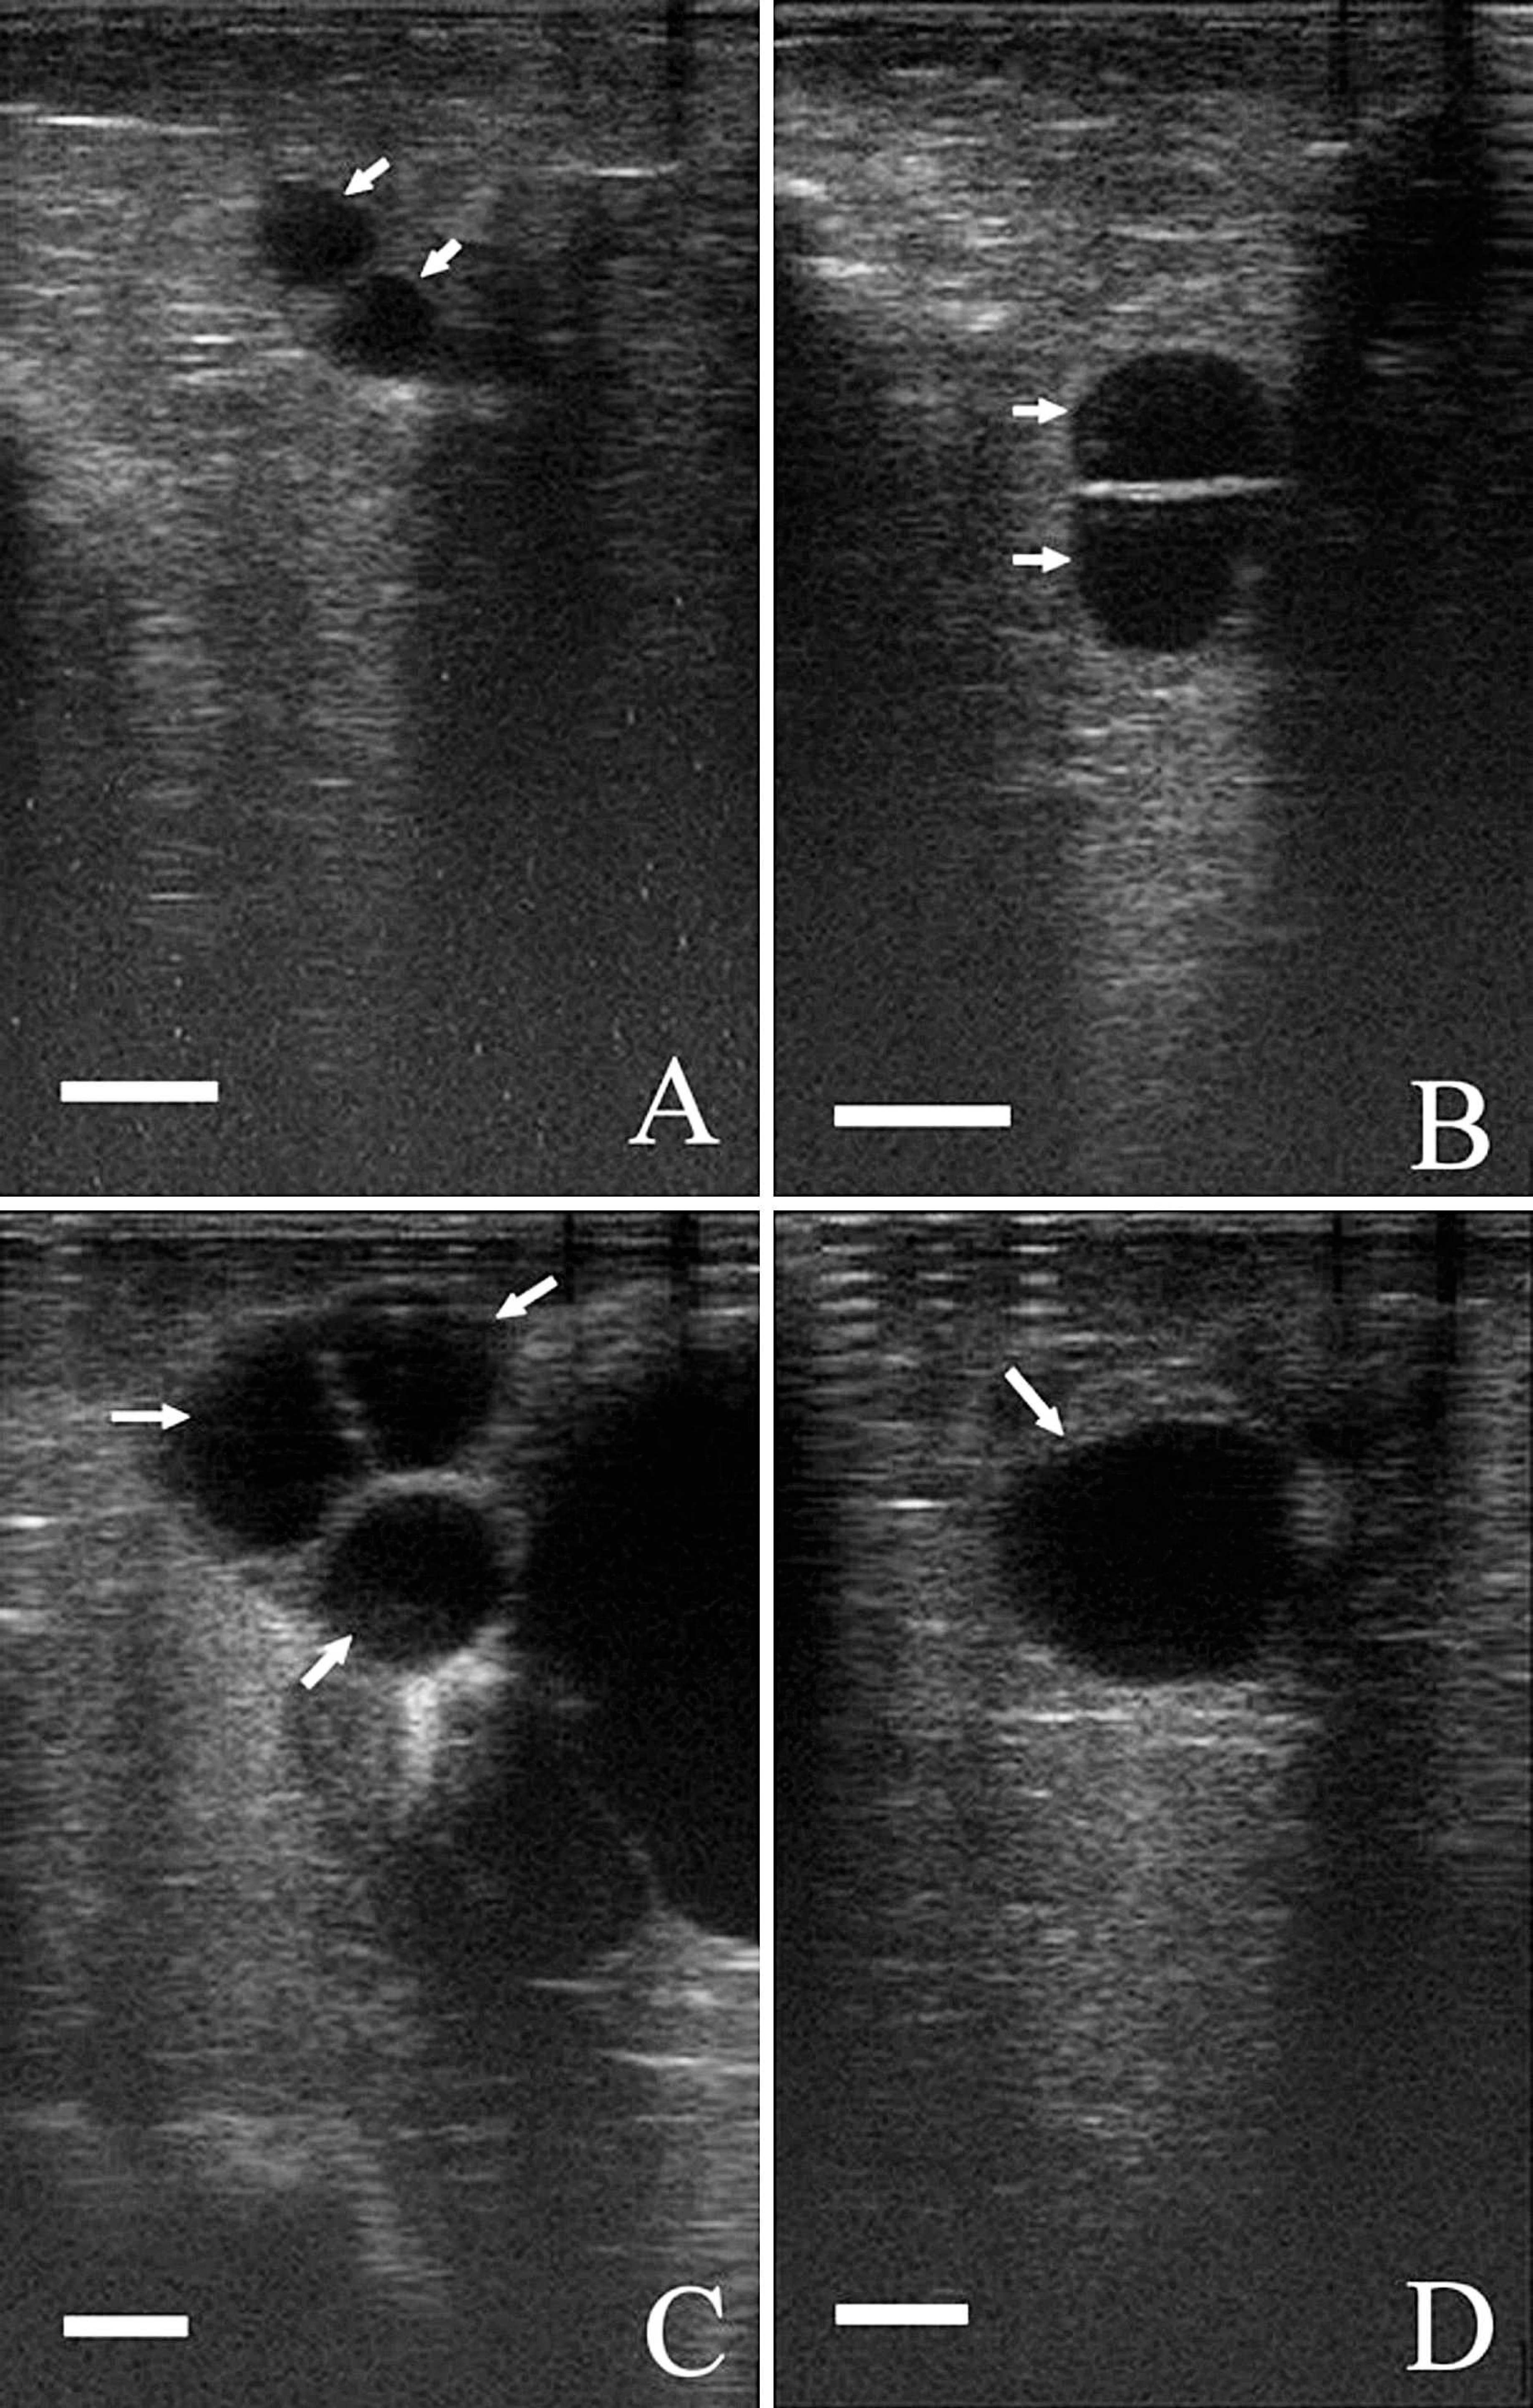
An ultrasound image of a goat ovary on days 12 (
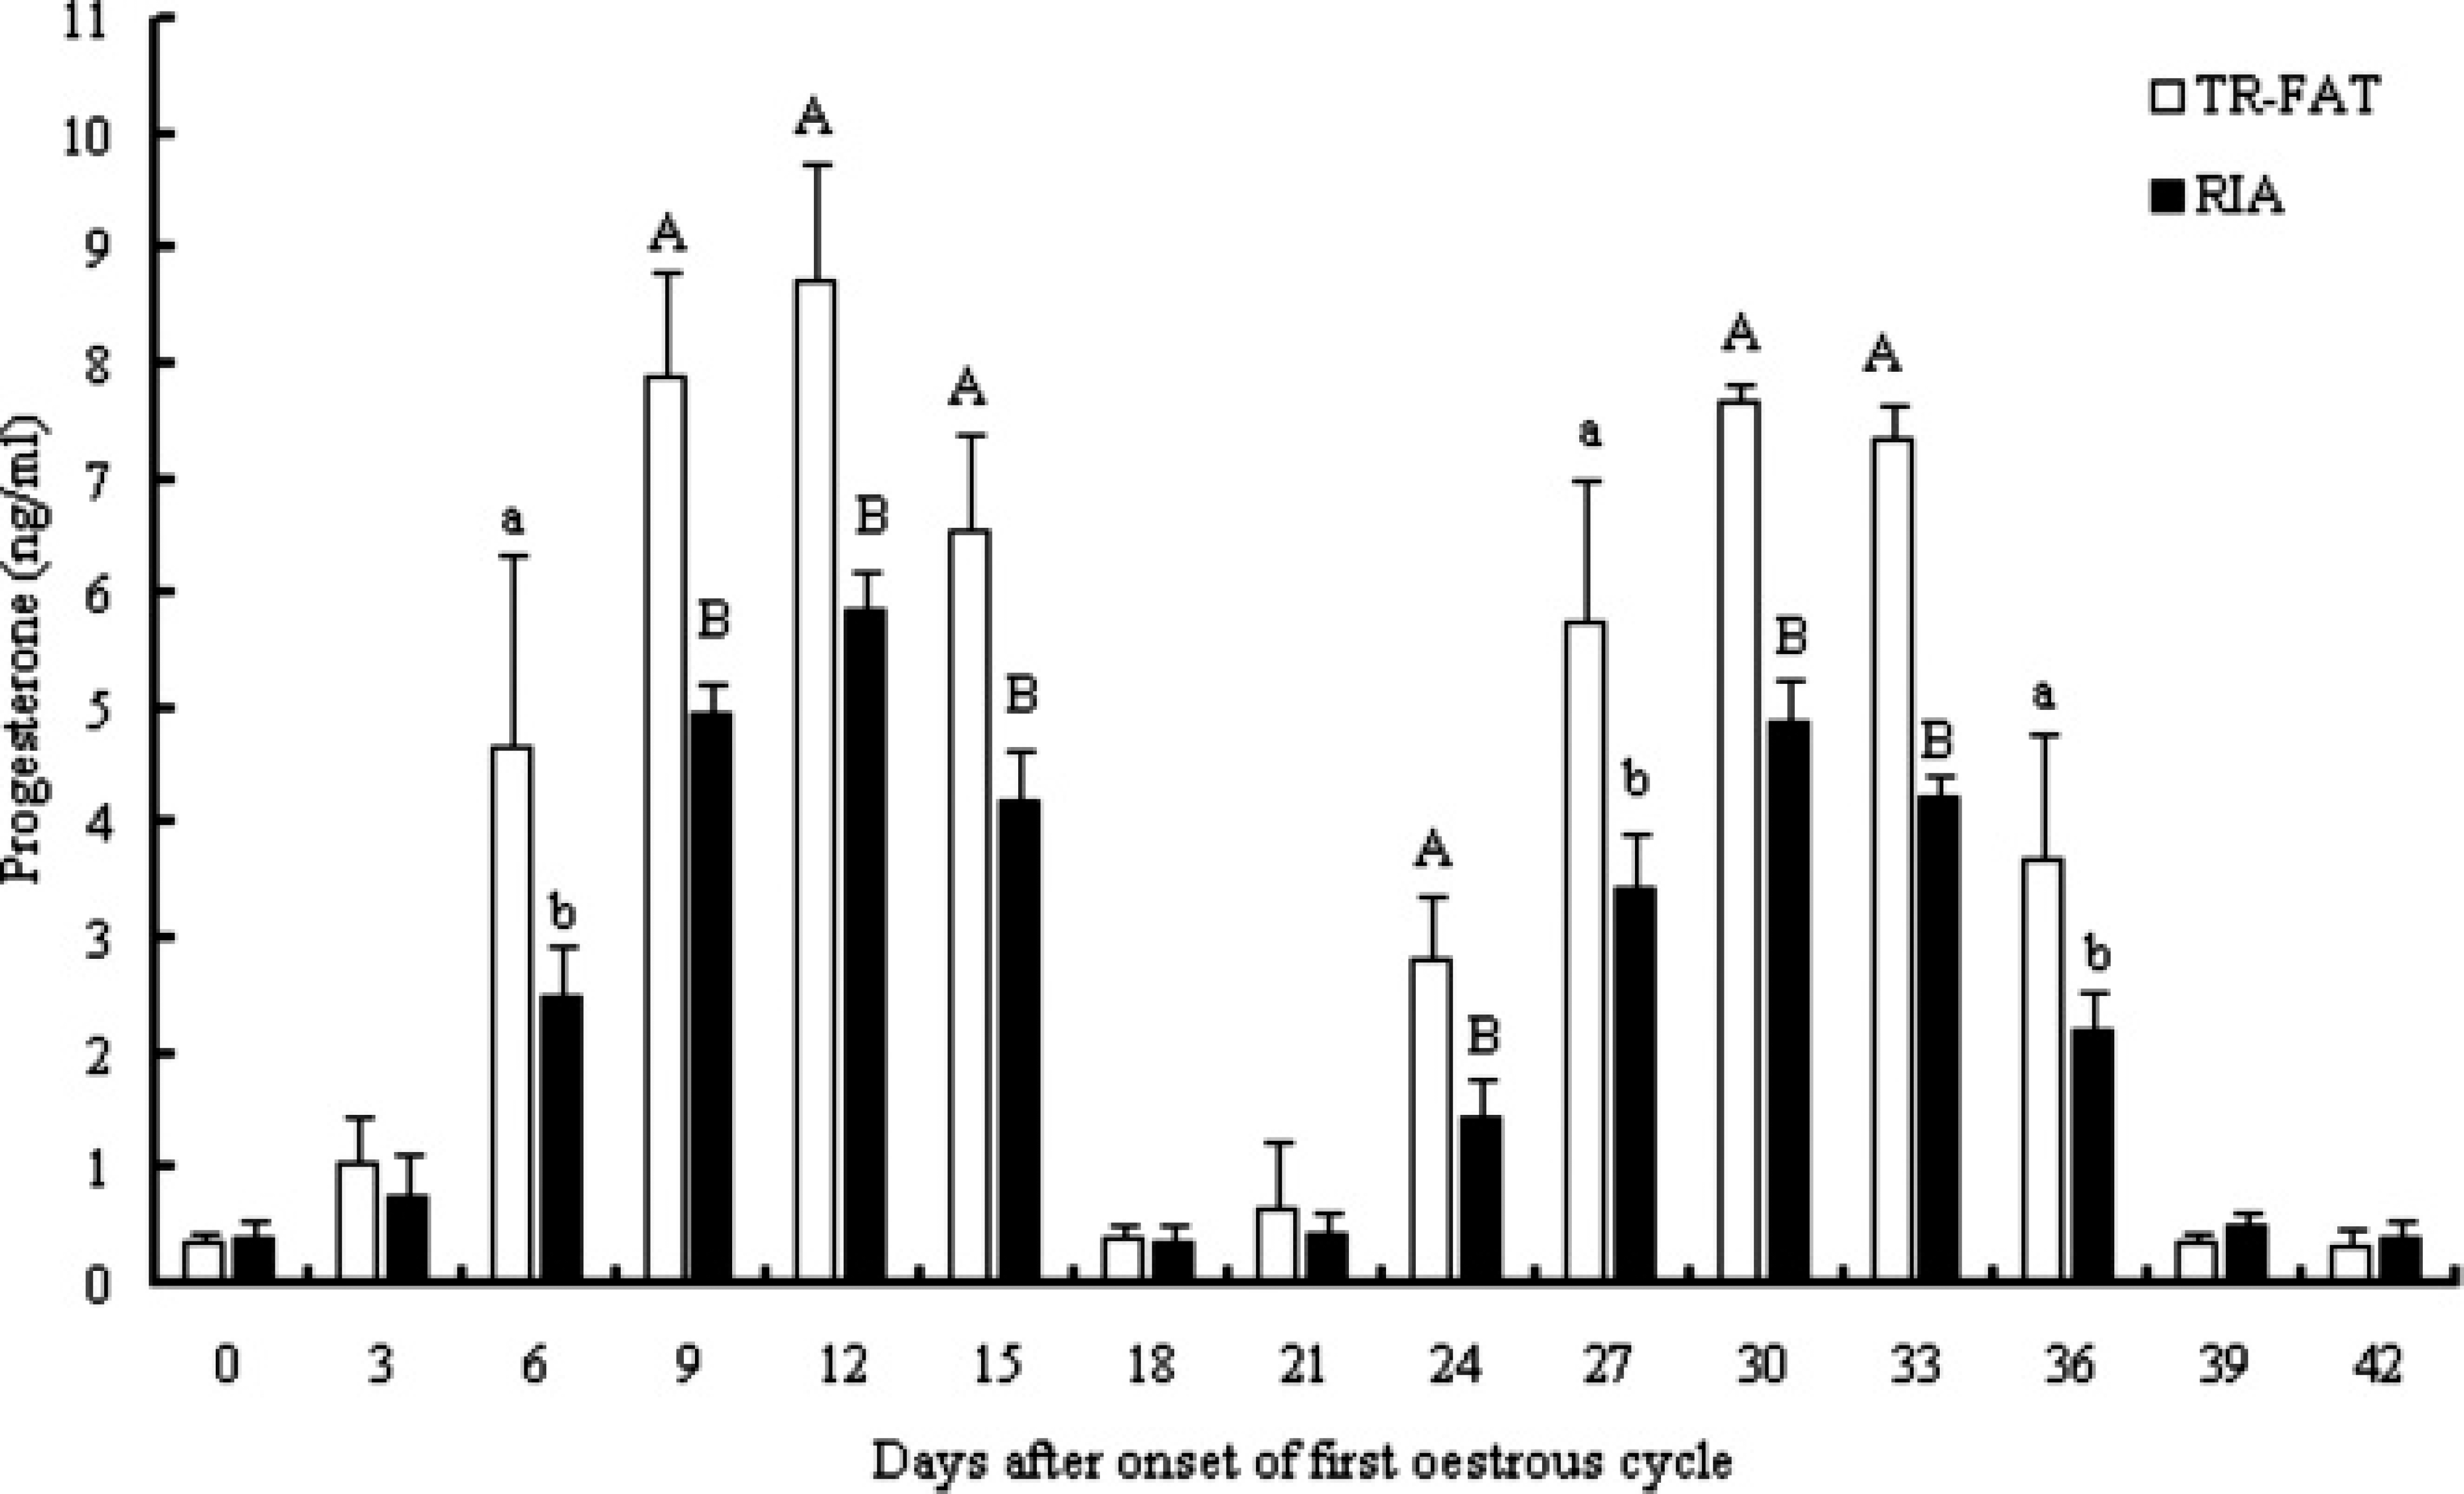
Plasma concentrations of progesterone measured by time-resolved fluorescent antibody test (TR-FAT) and radio-immunoassay (RIA) during 2 consecutive estrous cycles in goats (n = 4). Values are mean ± SD. Different letters by day indicate significant differences between TR-FAT and RIA (uppercase letters: P < 0.01; lowercase letters: P < 0.05).
Discussion
In goats, as in other ruminants, the concentration of P4 in peripheral circulation periodically changes across the various stages of the estrous cycle. The P4 concentrations in cyclic goats decline and reach minimal concentrations during estrus, after which they gradually increase and reach maximal concentrations in the luteal phase. 6,10,20 In the current study, there was a close temporal relationship between the significant decrease in plasma P4 concentrations measured by the TR-FAT and the manifestations of behavioral estrus. Mean plasma P4 concentrations in this period were typical for the periestrous period. The periestrous period in goats is characterized by low concentrations of P4 (<1 ng/ml), and the results obtained in the current study correspond with concentrations of other studies, in which plasma or serum P4 were determined by RIA. 3,6,9,10
The mean interestrous interval reported in the present study is close to the estrous cycle observed in goats in previous studies. 10,12 Moreover, the mean interestrous interval and mean interval between consecutive nadirs of P4 concentrations did not differ significantly. In this regard, measurements of P4 by TR-FAT can be applied in the determination of the estrous cycle duration and can be a useful aid in the confirmation of estrus in goats.
As described in previous studies, 10,20 the highest P4 concentration occurs during the midluteal phase (days 9 and 14 of the estrous cycle), with maximum concentrations ranging from 6.0 to 8.0 ng/ml. In comparison, the maximal P4 concentrations observed in the present study were higher. In spite of the differences in the maximum concentrations of P4 throughout the luteal phase, the general profile of P4 in the current study was very similar to those reported previously. 20 In addition, the P4 concentrations in a 1999 study 6 observed during the early luteal phase agree with the data reported in the current study. Moreover, the highest concentrations of P4 were associated with the presence of corpora lutea. Therefore, the results obtained with the TR-FAT kit could be useful for monitoring luteal function in goats.
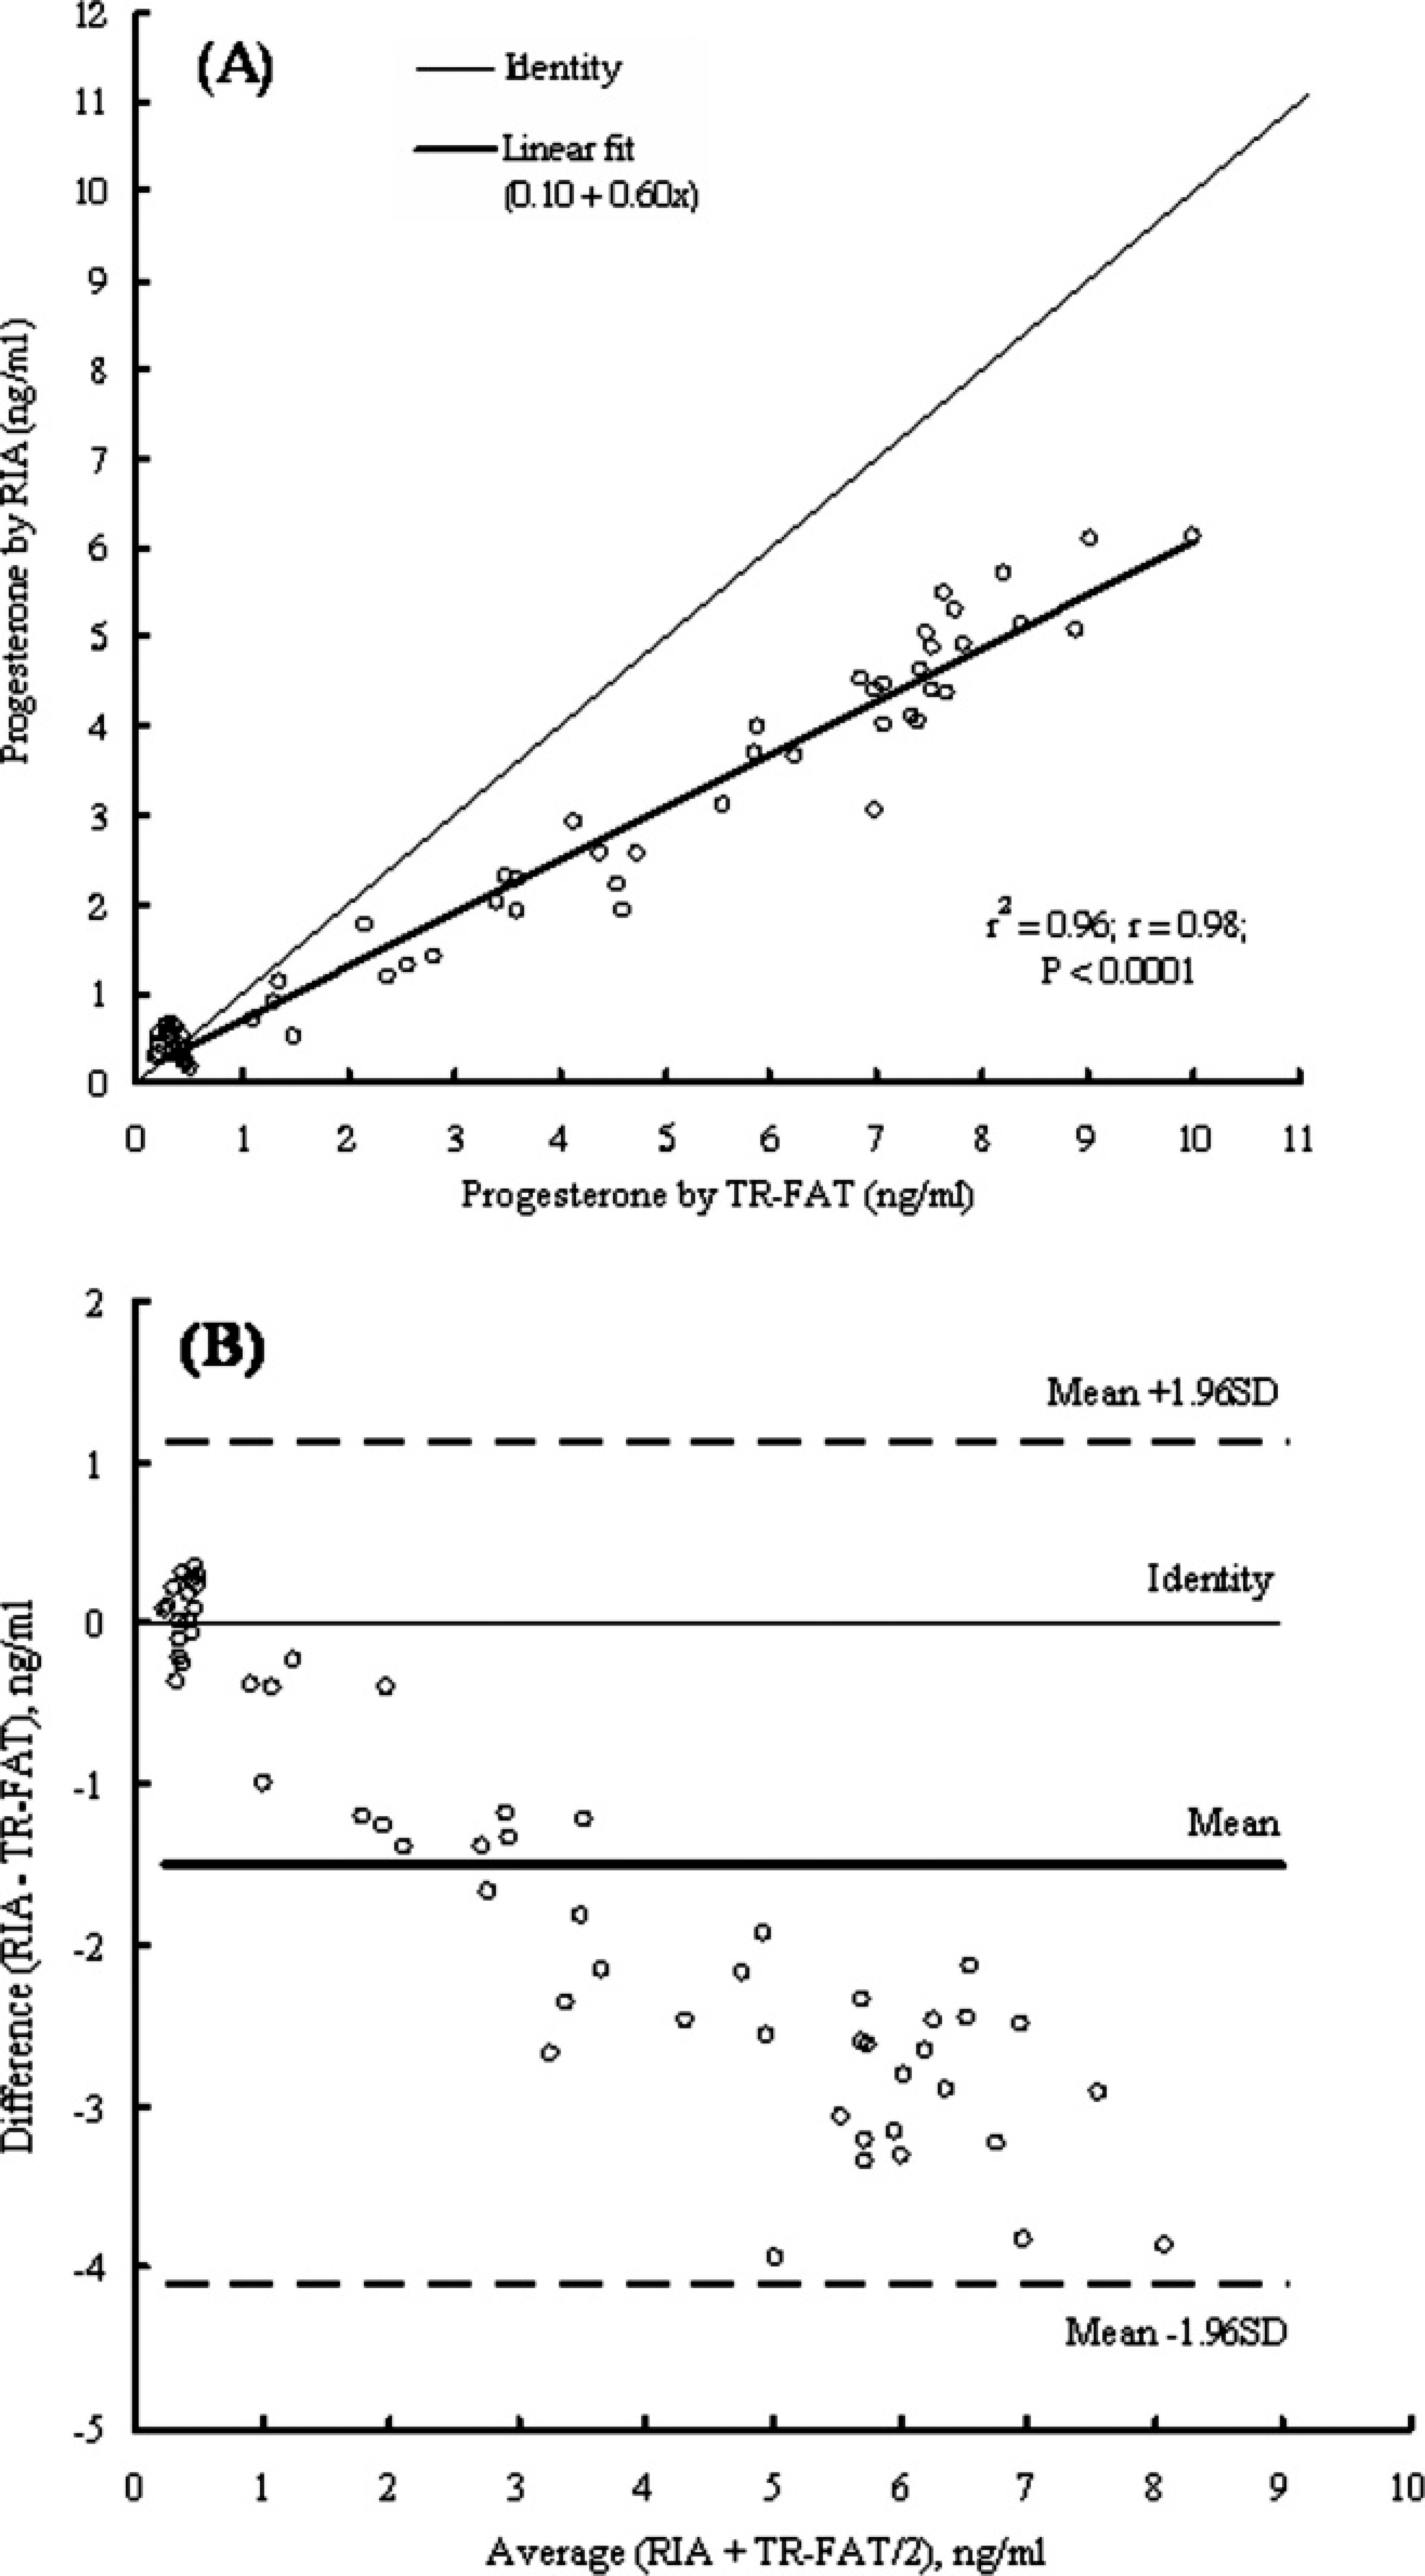
Linear regression plot (
It is known that estrous signs are due to the action of estradiol and do not occur during the luteal phase of the cycle. 1,5 However, in the current study, 1 goat remained in a longer interestrous interval associated with continuous low concentrations of P4. Throughout this period, it exhibited intermittent estrous behavior but failed to show typical estrous symptoms within the expected time. Because a high correlation between ultrasonic assessment of the corpus luteum and peripheral P4 levels has been found previously, 6,10 the ovaries of the aforementioned goat were examined ultrasonically in the current study for the presence or absence of corpus luteum. It has also been reported that continuous low concentrations of P4 in the peripheral circulation are often associated with ovarian follicular cysts. 6,11 In the present study, the corpus luteum was not detected in this goat because the scanning of both ovaries by ultrasonography did not indicate gray and uniform echogenic structures (with or without the nonechogenic central luteal cavities), as described previously in goats. 6 These examinations showed the presence a follicular cysts, which as reported in previous studies in goats are defined as anovulatory, follicular structures >10 mm in diameter that persist in the absence of a corpus luteum. 11
In the current study, cysts with very thin walls were observed, which in dairy cows are more common than luteal cysts and secrete little P4. 8 Luteal cysts generally have thicker walls and secrete varying amounts of P4; therefore, follicular and luteal cysts can be classified based on serum P4 concentrations. 8 Results seem to explain the low concentrations of P4 in this goat and confirm previous findings, 11 thus demonstrating that the determination of P4 concentrations may be helpful in the diagnosis of ovarian disorders, such as ovarian cysts. Results also provide further evidence that plasma P4 analysis by TR-FAT may be a reliable method for monitoring regular and abnormal estrous cycles in goats, because the changes in P4 levels measured by this method were related to ovarian activity during the estrous cycle. The consistency of the P4 profile with reproductive status has also been reported in the Sika deer, 18 in which plasma P4 was measured by TR-FAT similar to the present study.
In the current study, the comparison of TR-FAT with RIA indicated that the difference between the methods tended to be greater as the average increased. This relationship, however, seems not to have a negative effect on estrous cycle monitoring in goats. The differences may be due to a lower stability of the radioactive tracers, which require a new labeling every 1 to 2 months. Nevertheless, the concentrations of P4 measured by one method can be used to compute the results of the other method. Furthermore, not only did each average remain within the 95% limits of agreement, but the profiles of P4 assayed by both methods followed a similar pattern and a high positive correlation between the P4 concentrations measured by TR-FAT and RIA was found. This supports the hypotheses that the TR-FAT can be used for estrous cycle monitoring in goats. A 2004 study 13 using a similar experimental approach on Iberian red deer found a high correlation between results yielded by TR-FAT and those obtained with a validated RIA. In the 2004 study, the regression coefficient was 0.93, which indicated that the TR-FAT method was suitable for determination of P4 in female deer. In conclusion, the presented results suggest that the TR-FAT can be applied to monitor estrous cycles in goats through measurements of plasma P4 concentrations. In addition, the TR-FAT provides high throughput screening, is rapid and simple, and meets laboratory safety requirements through the absence of radioactive materials.
Footnotes
a.
Scanner 480, Pie Medical, Maastricht, The Netherlands.
b.
DELFIA® Progesterone, PerkinElmer, Wallac Oy, Turku, Finland.
c.
Wallac 14![]() 0 VICTOR
2
, Wallac Oy, Turku, Finland.
0 VICTOR
2
, Wallac Oy, Turku, Finland.
d.
Institute Animal Physiology and Nutrition, Polish Academy of Sciences, Jablonna, Poland.
e.
Amersham plc, Little Chalfont, Buckinghamshire, UK.
f.
Norit® A, Serva Electrophoresis GmbH, Heidelberg, Germany.
g.
Auto-Gamma Cobra II, Canberra Packard, Warsaw, Poland.
h.
StatSoft Inc., Tulsa, OK.
i.
Analyse-it Software Ltd., Leeds, UK.