
Abstract
Monensin and vitamin E concentrations, as well as histopathology of skeletal muscles and myocardium, were evaluated in broad-breasted white turkeys kept in commercial facilities. Turkeys with knockdown syndrome had myopathy of skeletal muscles, but no lesions in the myocardium. Generally, concentration of monensin in serum was highest in turkeys diagnosed with knockdown syndrome given more than 90 mg/kg of monensin in the diet, followed by turkeys diagnosed with knockdown syndrome given <90 mg/kg of monensin in the diet, healthy turkeys fed a diet that contained <90 mg/kg of monensin, and finally healthy turkeys fed a diet free of monensin (not detectable). However, the concentration of monensin was highly variable within each group, and the median was lower than the average. Vitamin E concentrations in the livers varied from low–normal to below normal and were statistically higher in healthy turkeys fed a diet free of monensin than in the livers of birds from the 3 groups exposed to monensin. This suggests that the concentration of monensin in serum positively correlates to the severity of clinical signs and pathology and to the amount of monensin in the feed. Although the methodology developed to detect serum monensin concentrations is beneficial and accurate for case investigations, it is recommended that several samples from each flock be evaluated because of variation within a flock. The current study also suggests that monensin in the feed could induce lower concentrations of vitamin E in the liver of turkeys and can predispose the turkeys to knockdown syndrome.
Introduction
Knockdown syndrome (KD) has been used to describe a condition in turkeys with depression, weakness, and reluctance to move to complete paralysis. Signs of KD are linked to skeletal myopathy and cardiomyopathy in turkeys. 3 Ionophore drugs have been associated commonly with this condition. 5,8,19 Monensin is a carboxylic ionophore commonly used as an anticoccidial drug in commercial poultry feed. Most of the KD cases reported have occurred in turkeys receiving doses of monensin in excess of the approved usage level or in combination with potentiating antibiotics. 8,9,21 However, skeletal myopathy compatible with ionophore toxicosis also has been described in turkey flocks in which monensin concentration in feed was within therapeutic levels. 5,12,19 Recently it has been suggested that antioxidants, particularly vitamin E, could play a role in the development of the disease. 12
Confirmation of KD from monensin intoxication has significant challenges. The primary diagnostic specimen to assess monensin concentrations is feed. However, because of the uneven mixing of monensin in the feed, several feed samples from different sites have to be analyzed to give an accurate measure of its concentration. Another problem exists when the submitter does not provide feed samples. Diagnosis on the basis of clinical signs and histology is not definitive, in that these changes are not exclusive to this syndrome. The purposes of this study were to evaluate whether serum monensin concentrations can be determined in turkeys, whether the measured concentrations correlate with the clinical development of KD, and whether varying oral dosages of monensin can alter liver vitamin E concentrations.
Materials and methods
Turkeys
A total of 116 broad-breasted white turkeys kept in commercial facilities were tested. The birds were allotted into 4 groups as shown in Table 1. There were 2 groups of healthy turkeys: The negative control (CN) birds were fed a diet free of monensin, and the positive controls (CP) were fed a diet that contained monensin at a concentration of <99 mg/kg (90 ppm when expressed in mg/U.S. ton) total diet. In addition, 2 groups of turkeys were diagnosed clinically with KD: In 1 of these groups (KP), the monensin concentration in the feed was within the recommended pharmaceutical concentration (54–99 mg/kg); the monensin concentration in the feed from the last group (KT) was above the allowed pharmaceutical concentration. The birds were euthanatized with carbon dioxide, 1 blood samples were taken, and postmortem examinations were performed. All birds were exposed to monensin in the feed from 3–9 days of age.
Group distribution of samples received and age range of birds.*
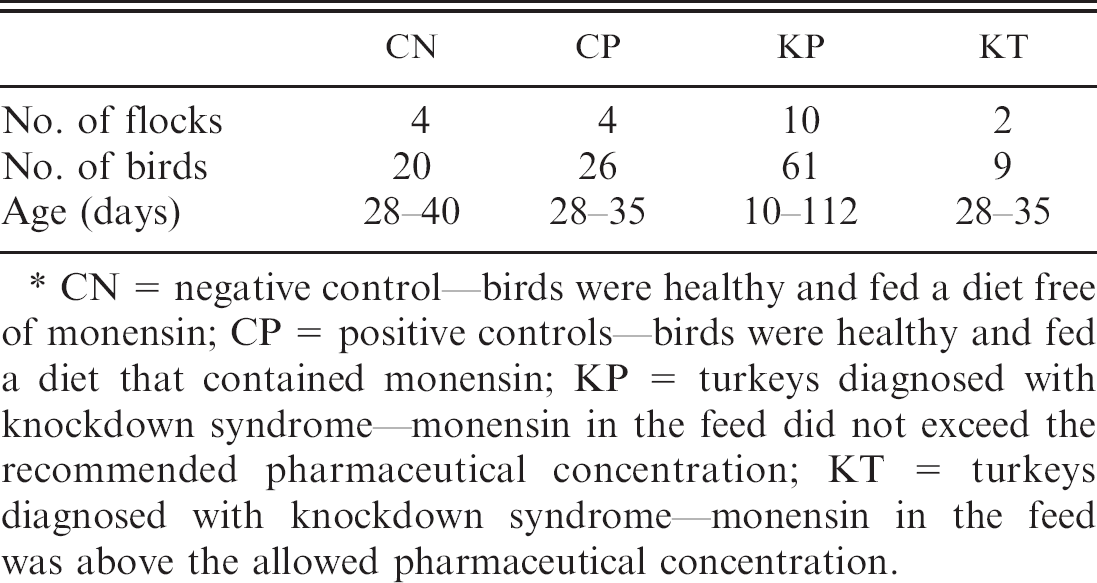
CN = negative control—birds were healthy and fed a diet free of monensin; CP = positive controls—birds were healthy and fed a diet that contained monensin; KP = turkeys diagnosed with knockdown syndrome—monensin in the feed did not exceed the recommended pharmaceutical concentration; KT = turkeys diagnosed with knockdown syndrome—monensin in the feed was above the allowed pharmaceutical concentration.
Histology
Intercostal muscles, medial thigh muscles along with the sciatic nerve, and heart were collected. In addition, sections throughout the respiratory and digestive tracts and brain were collected. Tissues were fixed in 10% buffered neutral formalin, embedded in paraffin, sectioned at 4 μm, stained with hematoxylin and eosin, and examined by light microscopy.
Ionophore analysis
Feed samples were analyzed for ionophores by liquid chromatography/mass spectrometry. 7 Briefly, feed samples were extracted with methanol in water (9:1, v/v) and filtered through a Whatman No. 4 filter paper. An aliquot of the extract was diluted with control feed extract, filtered through a 0.45-μm filter, and injected into an high-performance liquid chromatography (HPLC) system a coupled with a linear ion trap mass spectrometer. b The analytical column was a Luna C18(2), c 4.6 mm X 150 mm X 5 μm, with a mobile phase consisting of a mixture of methanol:water (95:5, v/v) each containing 0.1% formic acid. Mass spectral data of the [M + Na]+ ions were acquired with the use of 4 alternating tandem mass spectrometry (MS/MS) scan events in the positive electro-spray ionization mode. The instrument was tuned by optimizing the response of the mass-to-charge ratio (m/z) 613 while infusing 10 μg/ml lasalocid into a mobile phase. Quantitation was based on a 4-point calibration curve with the use of peak areas of external standards in matrix. The method quantization limit was 1 mg/kg each for monensin, salinomycin, narasin, and lasalocid.
Serum samples were analyzed by a modified method of liquid chromatography/MS for fluids. 6 Briefly, serum samples were extracted with ethyl acetate. An aliquot of each extract was removed, evaporated to dryness, and reconstituted in methanol:water (1:1, v/v). The extract was then filtered through a 0.45-μm filter and injected into an HPLC system d coupled with a triple quadruple linear ion trap mass spectrometer. e The analytical column was a 100 − 4.6 mm Chromolith Performance RP-18e with 10 − 4.6 mm RP-18e guard column. f The mobile phase consisted of 0.1% formic acid in water and 0.1% formic acid in methanol at a flow rate of 1,500 μl/min under a gradient of 0.1% formic acid in water from 10% to 30% over 11 min. Mass spectral data was acquired in the positive ion electrospray ionization mode with the multiple reaction monitoring scan function. The precursor ion for monensin was the [M + Na]+ ion of m/z 693. Product ions of m/z 443, 461, 479, and 581 were obtained with the use of collision energy = 65, declustering potential = 90, collision exit potential = 9, and entrance potential = 10, respectively. Each set of samples contained a control and fortified samples. Quantification was by comparison with a 4–5-point calibration curve with the use of external standards and linear regression. Six replicate fortifications of a negative control matrix at 0.5 ng/g monensin gave an average recovery of 86%, with 7% coefficient of variation (CV; relative standard deviation).
Vitamin E analysis
Vitamin E analysis of feed and liver samples was performed with the use of a modification of a previously described method. 11 Briefly, vitamin E (α-tocopherol) was extracted from liver and feed with petroleum ether. The concentrations of vitamin E were determined by HPLC g using fluorescence detection. h Four- to 5-point calibration curves for quantification were prepared in methanol. Bovine liver was used as the control matrix, and the background level was determined and accounted for in the determination of spike recoveries. Fortified control samples were spiked to a level of 30 μg/g of α-tocopherol for liver by adding an appropriate amount of standard solution in methanol to the control matrix. Each batch of samples analyzed included a standard curve, a control sample, and a fortified sample of the matching matrix. Sample data were accepted if the coefficient of determination (r 2) of the standard curve was greater than 0.99 and the recovery of the fortified sample was between 70% and 120%.
Statistical analysis
Data collected from monensin and vitamin E analyses were subjected to 1-way analysis of variance (ANOVA). 16 Group means were compared by the Tukey test. Statistical significance was accepted at P < 0.05.
Results
Turkeys from CN and CP groups were clinically normal, whereas turkeys from KP and KT groups showed clinical signs similar to birds with KD described elsewhere. 3,5 Between 1% and 5% of the birds in the flock showed clinical signs. In the affected flocks, mortality varied between 0.1% and 0.5% per day, whereas normal mortality is expected to be <0.1% per day. Clinical signs appeared 2–3 days after the change of feed, and affected birds were depressed and weak and refused to move, and their legs were extended to the back. Gross necropsy revealed no significant lesions in the musculoskeletal system.
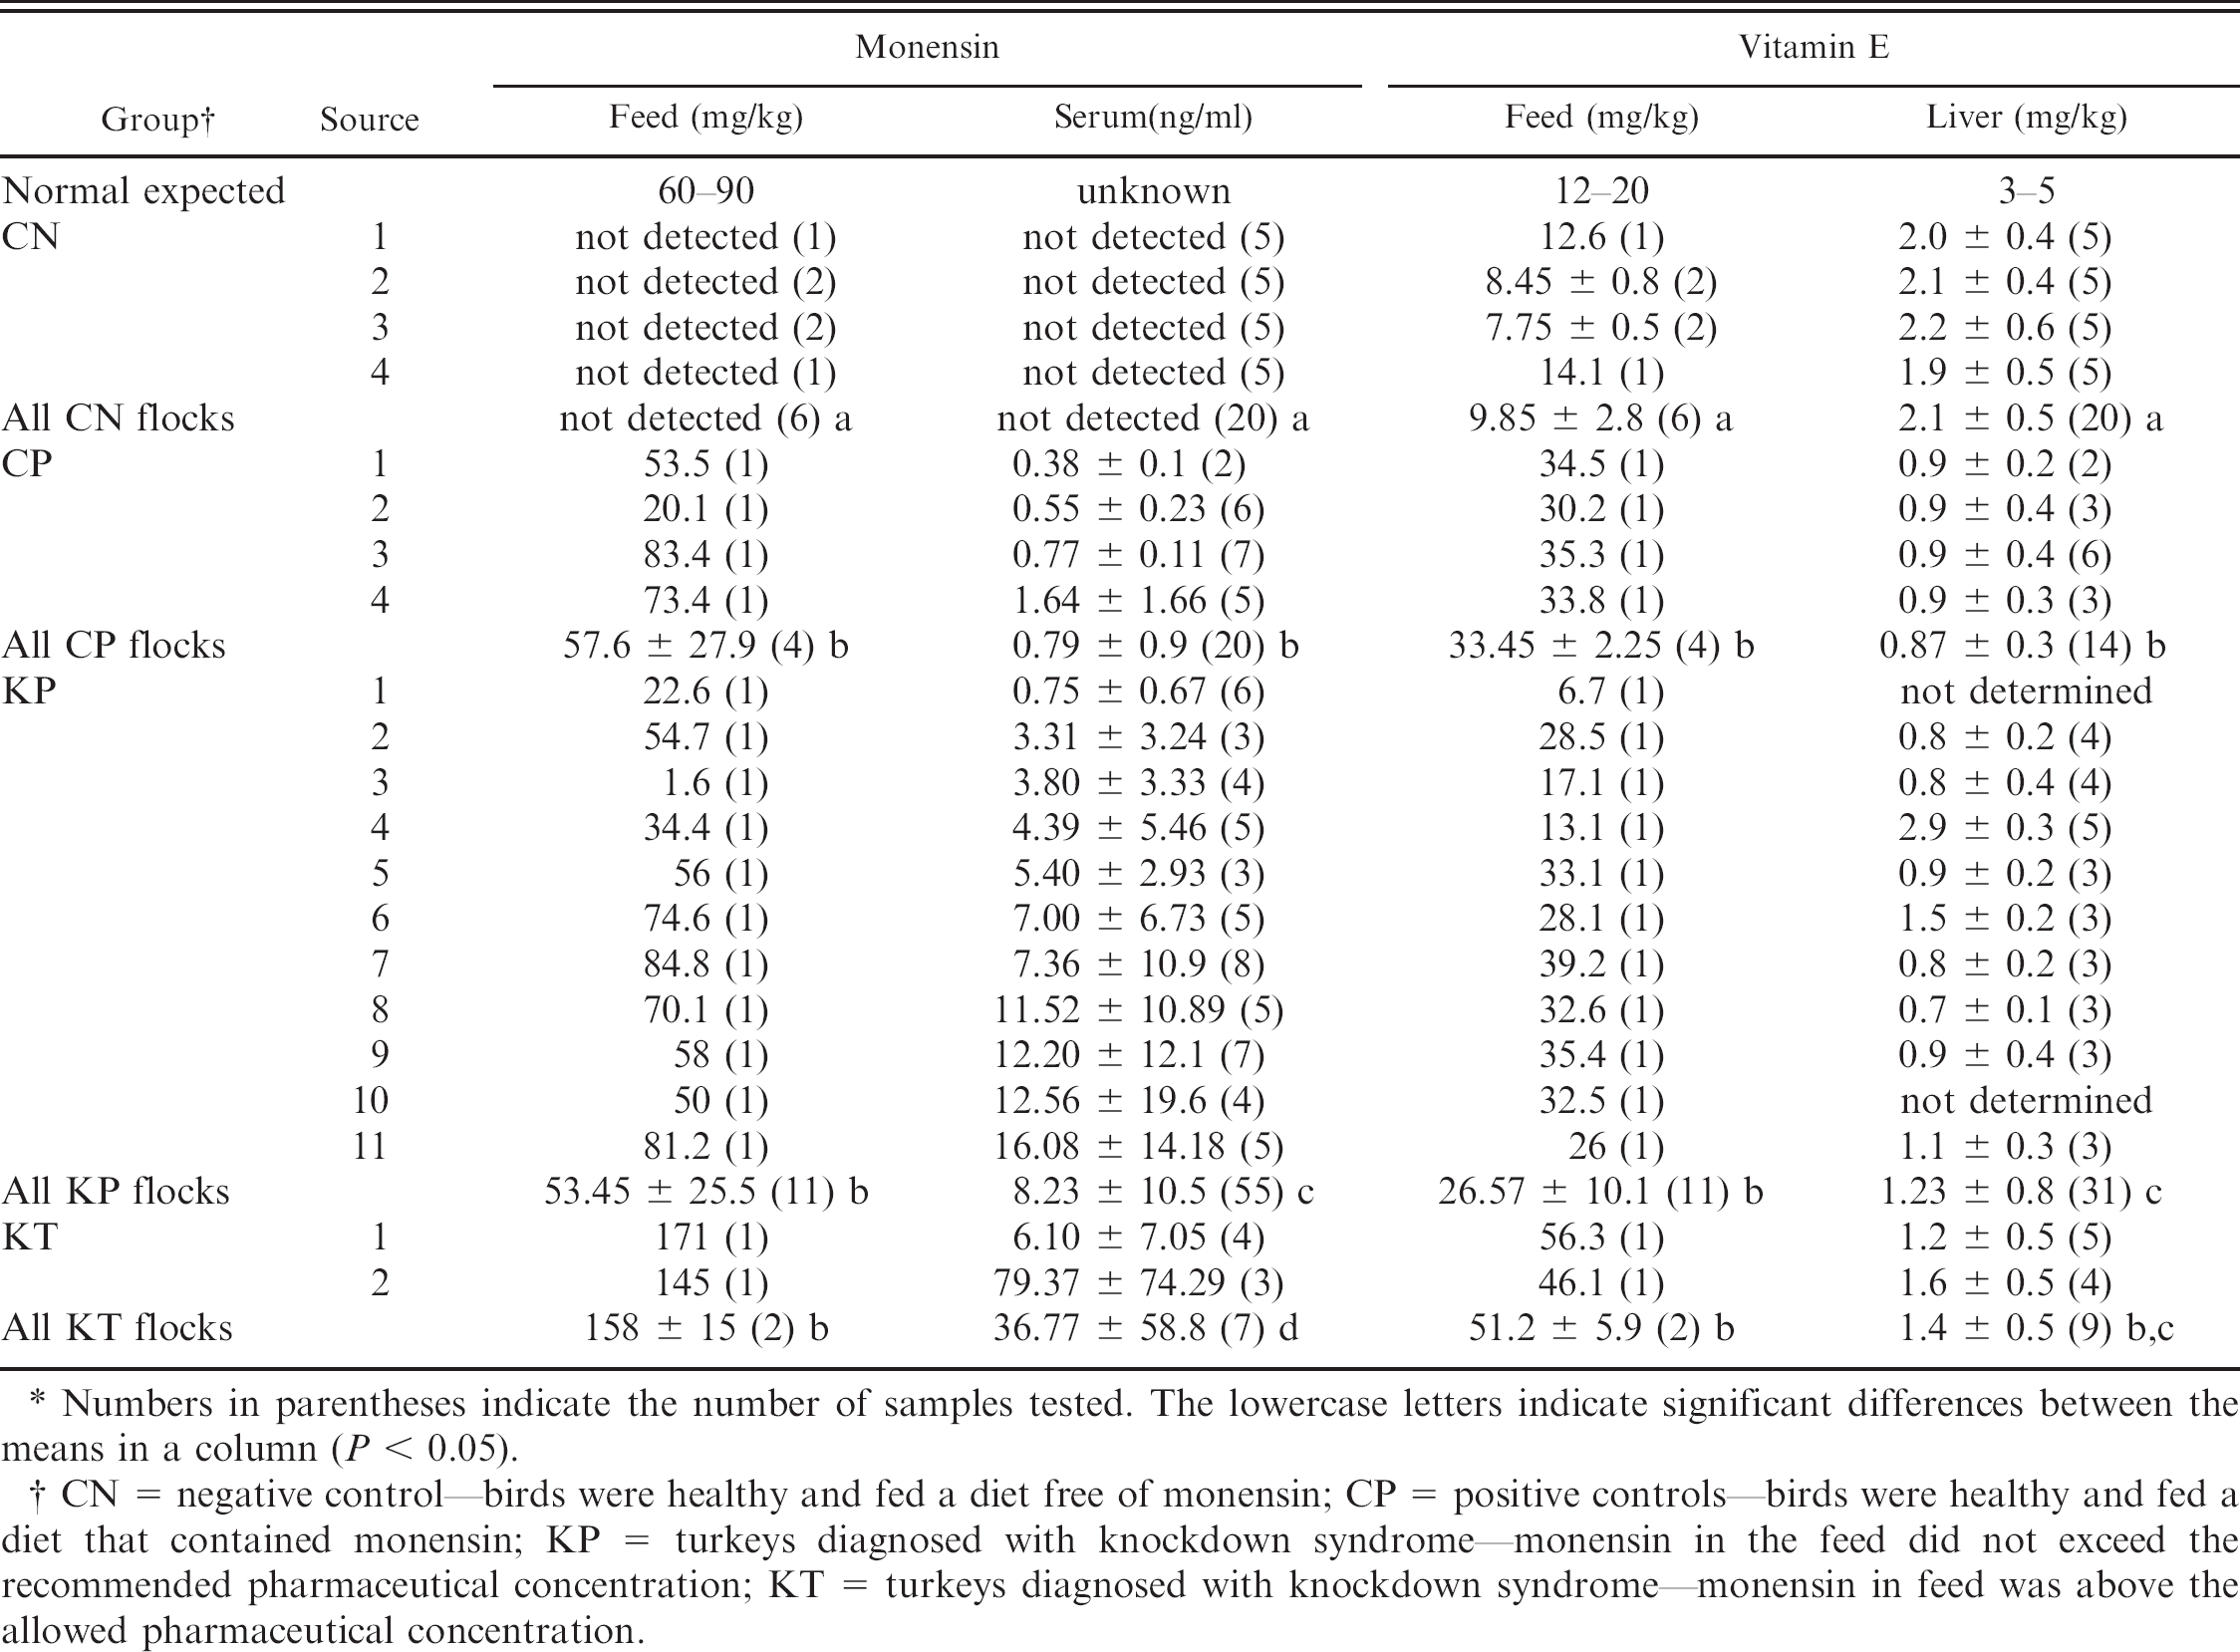
Numbers in parentheses indicate the number of samples tested. The lowercase letters indicate significant differences between the means in a column (P < 0.05).
CN = negative control—birds were healthy and fed a diet free of monensin; CP = positive controls—birds were healthy and fed a diet that contained monensin; KP = turkeys diagnosed with knockdown syndrome—monensin in the feed did not exceed the recommended pharmaceutical concentration; KT = turkeys diagnosed with knockdown syndrome—monensin in feed was above the allowed pharmaceutical concentration.
Histology of the skeletal and heart muscles and of the nerves was normal in tissues from CN and CP birds. Turkeys from groups KP and KT had skeletal myopathy characterized by areas of loss of striations, variation in fiber size, increased eosinophilia, and necrosis. Affected areas had increased cellularity because of the proliferation of satellite and sarcolemmal nuclei. Heterophils and macrophages occasionally infiltrated. In the less severe cases (birds from the KP group) only 1 or 2 birds from each submission (typically 8 birds per submission) had myopathy. The most affected muscles were intercostal muscles, abductor muscles of the thigh, and occasionally muscles around the trachea. Myocardium was histologically normal in all birds from all groups.
Feed and serum concentrations of monensin and vitamin E, as well as their statistical analysis results, are shown in Table 2. Birds with KD had higher concentrations of monensin in the serum than birds free of clinical signs. Monensin was not detectable (<0.5 ng/ml) in any of the serum samples from the CN birds, in 24% of the CP birds, and in 7% of the KP birds (detected in all serum samples from the KT birds). Serum concentration of monensin varied greatly within each group that was given monensin in feed, even when the birds were from the same flock; for instance, monensin concentration varied in individual birds, ranging from <0.5 to 4.5 ng/ml in the CP birds, from <0.5 to 41.6 ng/ml in the KP birds, and from 1 to 150 ng/ml in the KT birds. Also, the median concentration of monensin (CP = 0.5 ng/ml, KP = 4.1 ng/ml, KT = 1.9 ng/ml) in the serum was lower than the average (CP = 0.79 ng/ml, KP = 8.23 ng/ml, KT = 36.77 ng/ml) in all groups given monensin in the feed.
The average concentration of vitamin E in the liver from birds that were fed monensin was lower (CP = 0.9 mg/kg wet weight, KP = 1.1 mg/kg wet weight, KT = 1.4 mg/kg wet weight) than in liver from birds that did not receive monensin in the diet (CN = 2.1 mg/kg wet weight). On the other hand, the concentration of this vitamin in feed that contained monensin was higher (CP = 33.5 mg/kg, KP = 26.6 mg/kg, KT = 51.2 mg/kg) than in feed without monensin (CN = 9.9 mg/kg).
Discussion
A diagnosis of KD was made on the basis of compatible clinical signs and histologic findings regardless of the concentration of monensin in feed. Only in 2 submissions diagnosed with KD was the concentration of monensin in the feed above the recommended 99 mg/kg.
Although myocardial pathology because of ionophore toxicity has been described in the literature, 3 none of the hearts examined had pathologic changes. A retrospective study of the California Animal Health and Food Safety (CAHFS) Laboratory System database of the last 10 years (1997–2007) revealed that cardiomyopathy is rarely observed in cases of turkeys diagnosed with KD compatible with ionophore toxicosis. Out of 70 cases (>500 turkeys total) investigated by CAHFS, myocardial degeneration of atria was described in only 1 turkey. Most reports describing cardiomyopathy associated with ionophore toxicity involve chickens, 4,10,20 and it is possible that turkeys are less susceptible to myocardial damage. Also, lesions in the myocardium are described in subchronic cases 20 and not in acute cases. All cases included in this study were submitted to the diagnostic laboratory as soon as the clinical signs appeared.
The serum assay demonstrated to be useful in quantifying monensin in serum. The results of this study demonstrate that a toxic concentration of monensin in feed is associated with serum monensin concentration greater than that determined in birds offered a nontoxic monensin concentration in their diet. An average serum monensin concentration of 3 ng/ml or higher was normally associated with at least 1 bird in the group showing KD and myopathy. Only 1 group had turkeys with clinical signs of KD and histology of myopathy, but the concentration of monensin in serum was 0.75 ng/ml. It is important to note that the concentration of monensin in serum was highly variable between birds. The amount was high in only a few birds of a group showing signs compatible with KD or myopathy. Because of a wide variation between birds, multiple samples should be analyzed to obtain meaningful results. Little information is known about the absorption, distribution, metabolism, and excretion of monensin in turkeys. Therefore, possible individual variability that could ultimately contribute to the varying serum monensin concentrations cannot be assessed. Until the pharmacokinetics of monensin are known in this species, serum testing should not be used as the only diagnostic tool; high concentrations might suggest myopathy as a direct result of monensin, but lower concentrations do not exclude monensin toxicosis. In addition, the variability of serum monensin concentrations could be partly influenced by the time between serum sample collection and most recent monensin exposure. Research has shown that residue concentration of monensin can decrease overtime. 18 However, toxicokinetics data on monensin in the serum does not exist; thus, the effect of timing of blood collection on serum monensin concentrations is difficult to assess. Another possibility would be that KD birds metabolize monensin more slowly than non-KD birds for other reasons unrelated to the disease.
Even though the feed from the CN group had the least amount of vitamin E, the concentration of vitamin E in the liver of these birds was higher than hepatic vitamin E in the other 3 groups. Birds from CP, KP, and KT groups contained similar vitamin E concentrations in the liver. It is unknown to the authors why feed with monensin had more vitamin E; it is possible that there was an error in feed sampling or lack of a homogeneous testing of feed samples. It is also feasible that when monensin was included in the diet, extra vitamin E was added to minimize vitamin E reduction in the body of the animals, as described in previous research. 12 Lower vitamin E concentration in the presence of monensin has been suggested to predispose animals to KD. 4,12 Vitamin E is an antioxidant that is active in the cytosol and the cell membrane. 17 Low levels of vitamin E have been associated with reduced membrane viscosity. 2 Reduced viscosity could result in cell fragility and could be a component of increased susceptibility to monensin toxicosis. On the basis of the results from this study, turkeys exposed to dietary monensin might have lower measured liver vitamin E concentrations because of increased utilization. This could be a result of higher antioxidant demand because of higher oxidative stress in monensin-exposed animals, an interaction of monensin and vitamin E in the gastrointestinal tract reducing vitamin E absorption, or another not yet identified mechanism. Monensin has been shown to inhibit different enzymes of the oxidative defense system in vitro, 15 which in turn could induce increased turnover of vitamin E and other antioxidants. Additional studies to evaluate the interaction of vitamin E and monensin could include a study measuring vitamin E concentrations in the serum of clinically affected KD turkeys before death and comparing the results to turkeys receiving much higher concentrations of vitamin E supplementation before monensin exposure.
The described assay can be used to measure the concentration of monensin in serum of turkeys, although multiple samples should be analyzed to account for variation in the results. This study suggests that monensin might be involved in the etiology of KD. An average serum monensin concentration of >3 ng/ml from a group of 5 or more turkeys from the same flock is associated with KD. Finally, lower concentration of vitamin E in the bird could be a direct result of monensin exposure. However, the current study does not demonstrate whether lower concentration of vitamin E predisposes birds to KD. Other contributing factors and interactions should be further investigated to elucidate the pathogenesis of KD when the concentration of monensin is within the recommended pharmaceutical concentration.
Footnotes
a.
Model 1050 HPLC system, Agilent Technologies Inc., Santa Clara, CA.
b.
Model LTQ linear ion trap mass spectrometer, Thermo Fisher Scientific Inc., Waltham, MA.
c.
Phenomenex, Torrance, CA.
d.
Model 1100 HPLC system, Agilent Technologies Inc., Santa Clara, CA.
e.
4000 Q TRAP® LC/MS/MS System, Applied Biosystems/MDS Sciex, Concord, Ontario, Canada.
f.
Merck KGaA, Darmstadt, Germany.
g.
2690 HPLC, Waters Corporation, Milford, MA.
h.
2475 Multi Wavelength Fluorescence Detector, Waters Corporation, Milford, MA.