
Abstract
In most validation studies of tissue microarrays (TMAs), a fixed number of cores with a given diameter are analyzed to determine the degree of accuracy by which the TMA represents the whole section. The statistical model described in the present study predicts this property for various combinations of 2 core sizes (0.6 mm and 1.2 mm) and different core numbers. The model was based on artificial TMA core biopsies generated from Ki-67 and active caspase-3 immunostains of 40 canine lymphoma samples. Positivity was scored on a continuous scale, and a large number of cells were analyzed with the help of semiautomated cell counting. Despite considerable differences in range and distribution of Ki-67 and active caspase-3 positivity values, the model predictions showed a high degree of agreement for both markers. Comparison of 0.6 mm and 1.2 mm cores indicated that the use of small cores necessitates inclusion of a larger number of samples but requires counting a markedly smaller number of cells. Suitability of TMAs to determine the immunophenotype of the whole section was assessed using 2 different combinations of core sizes and numbers. Both displayed a high degree of concordance with the whole section (κ0.6 = 0.79; κ1.2 = 0.91). The present study provides a basis for the use of TMAs in future high-throughput immunohistochemical investigations of selected markers in canine lymphomas. The statistical model presented can be used to determine an optimal TMA design depending on a desired accuracy.
Introduction
Immunohistochemistry represents a simple and time-effective method to evaluate protein expression in tissues and is a valuable tool for use in cancer research. In general, a large number of tumors require investigation by this methodology if representative data are to be obtained. High-throughput immunohistochemical evaluation of tumor specimens has been made possible by development of the tissue microarray (TMA) technique. 11 This technique facilitates simultaneous evaluation of a large number of tumor samples labeled under identical conditions and saves reagents, tissue samples, and time, which dramatically improves efficiency and lowers costs. 15 A major downside of TMAs, however, is that the limited amount of tissue analyzed may not be representative of the whole specimen. Validation experiments with human tumor samples have demonstrated varying degrees of agreement between TMAs and whole-tissue sections. This variation is due to such factors as evaluation of different tumor types and markers, nonuniform distribution of a given marker in a certain tumor type (tumor heterogeneity), the scoring method applied, and differences in the statistical approach and the number of core biopsies taken for each tumor. 17
Although TMAs have been widely used for a number of years in human medicine, a lack of consensus still exists on how many core biopsies should be collected to determine a reliable value of percentage positivity. 5 Suggested numbers of core biopsies range from 2 1,7,13 to 3 3,4,8,9 to 4. 5,6 Positivity of a given marker can be assessed using a binary (e.g., positive or negative) or ordinary scoring system (division into categories, e.g., 0–25%, 25–50%, 50–75%, 50–100%) or can be expressed on a continuous scale (percentage values between 0% and 100%). Most studies rely on binary 1,4,7–9,13 or ordinary 6,17 scoring systems that presumably require a smaller number of core biopsies but are also less accurate than if a continuous scale 3–5,7,16 is applied. Furthermore, little attention has been paid to the optimal size of core biopsies. Most TMA studies use a standard diameter of 0.6 mm, and few data are available on whether the use of larger cores would result in better agreement between whole sections and TMAs. A detailed quantitative assessment on the accuracy of TMAs depending on different core sizes, as well as core numbers, has to the authors' knowledge not been done in the veterinary medicine field, where the use of TMAs is still limited.
The first objective of the present study was to determine the degree of accuracy by which various combinations of core sizes and numbers of TMAs represent whole sections in immunohistochemical analyses of canine lymphoma. Furthermore, the suitability of TMAs to accurately determine the immunophenotype was assessed for 2 specific combinations.
Material and methods
Various aspects of the TMA technique were investigated by 2 different approaches using canine lymphoma samples. In the first part of the study, a statistical model was computed to determine the degree of accuracy by which various combinations of core sizes and numbers represent whole sections for 2 markers (Ki-67 and active caspase-3) evaluated on a continuous scale. The data for the model computations were derived from artificial TMA core biopsies, which consisted of digital images originating from immunolabeled whole sections. Artificial cores allow for incorporation of a large number of cores as needed to address this question, circumventing waste of precious material. In the second part, suitability of TMAs to accurately determine the immunophenotype was assessed using physical arrays. For this purpose, 2 TMAs, each with a different combination of core sizes and numbers, were assembled by transferring tissue cores from donor blocks to 2 recipient blocks.
Artificial TMA core biopsies
First, whole sections of archival biopsies from 40 canine lymphomas were immunolabeled for Ki-67 and active caspase-3 as described below. Tumor regions were manually delineated on each whole section, and 12 artificial 0.6-mm and 2 artificial 1.2-mm core biopsies were randomly collected. This was achieved by generating digital images a of the maximum number of adjacent, nonoverlapping fields of vision (FOVs) fitting in a 0.6-mm or 1.2-mm core biopsy (1 and 4 images, respectively), as depicted in Figure 1. The images were acquired at 20 × magnification, and each FOV measured 83,200 μm2. The area evaluated using artificial core biopsies was smaller than that of a corresponding physical core biopsy; however, the ratio of the analyzed area between artificial 0.6 mm and 1.2 mm core biopsies was identical to the ratio of the area of physical core biopsies (i.e., 1:4).
Assembly of physical TMAs
The array design was based primarily on practical considerations (i.e., tissue availability and effort for assembly and evaluation of the arrays). In addition, the model predicts a high degree of accuracy for the selected combinations if used for evaluation of markers scored on a continuous scale. Two TMAs with either 1.2-mm or 0.6-mm cores were assembled with the assistance of a manual tissue arrayer b from the same 40 archival canine lymphoma samples used for the model computations. Punches of 0.6-mm diameter were obtained from the manufacturer, b while 1.2-mm punches were self-manufactured. Four cylinders of 0.6-mm diameter and 2 cylinders of 1.2 mm were randomly collected from previously identified representative areas of each specimen and transferred to paraffin wax recipient blocks. c All specimens contained abundant tumor tissue and had previously been fixed in 4% buffered formaldehyde and paraffin wax embedded using routine methods.
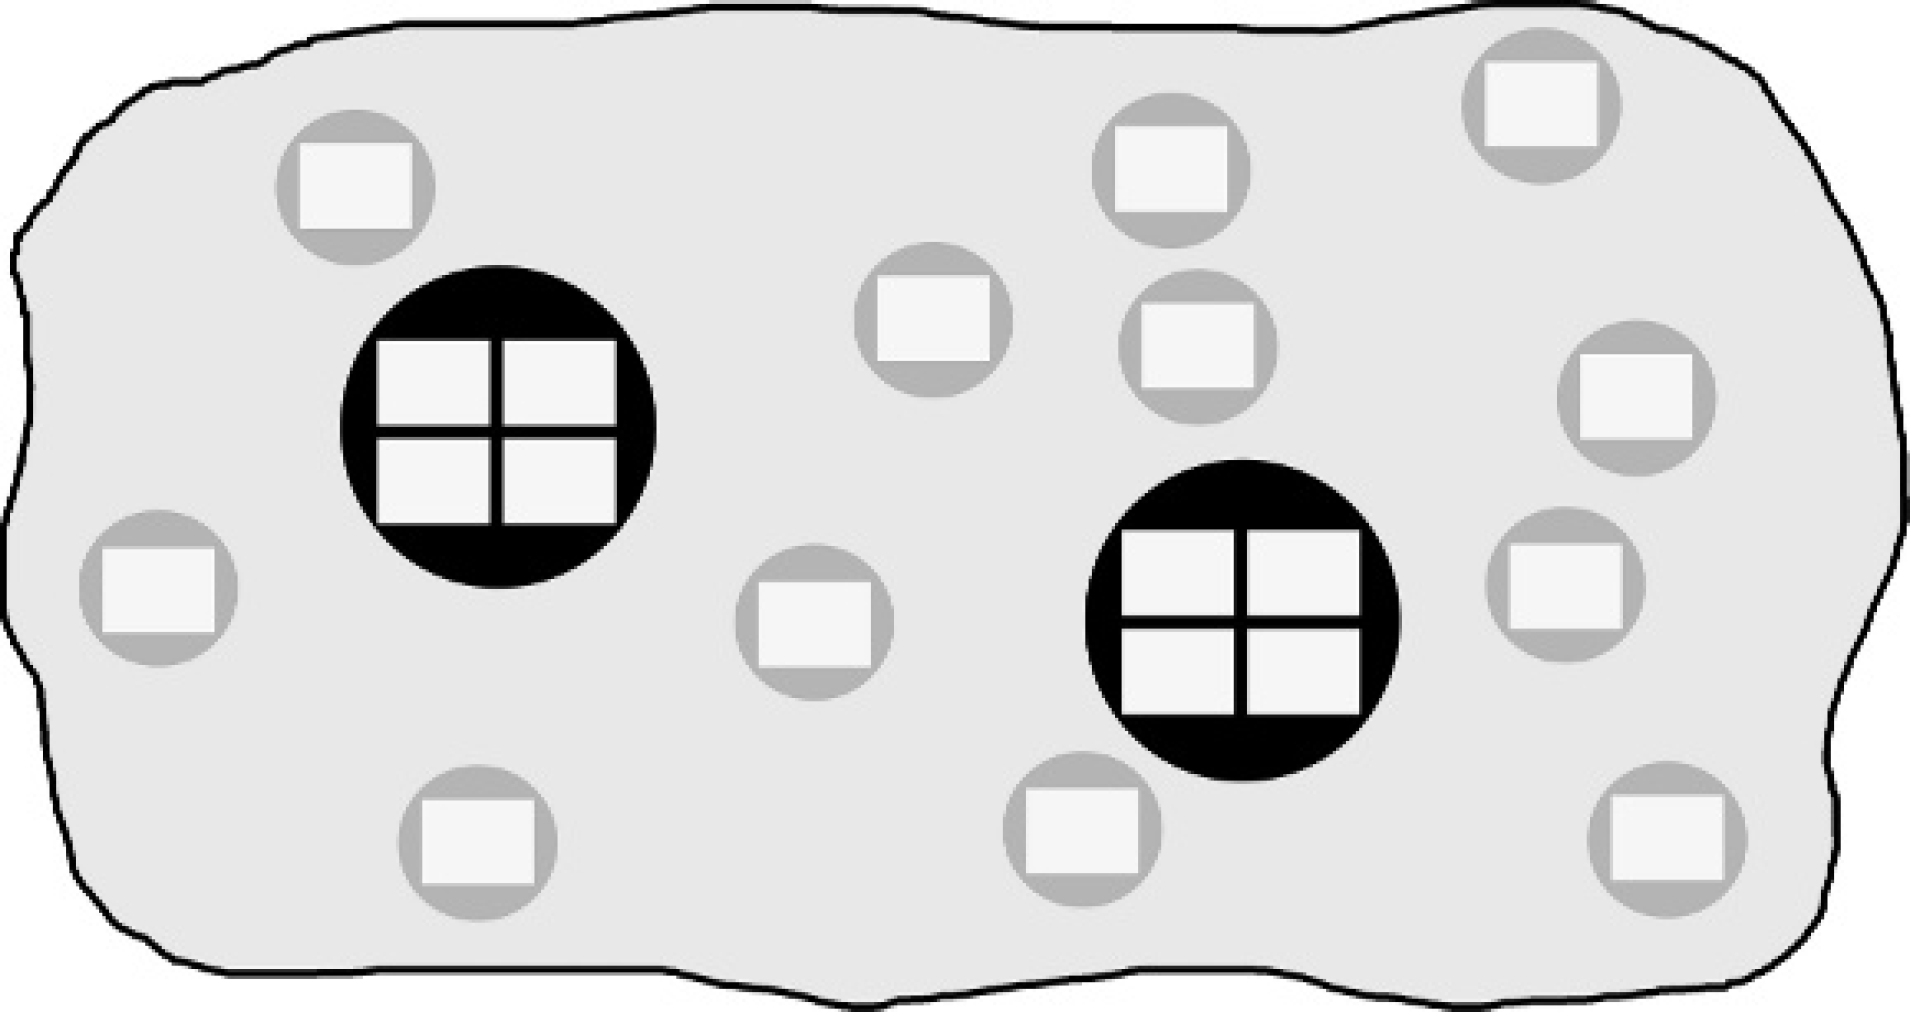
Schematic depiction of artificial tissue microarray core biopsies. Digital images were taken randomly from immunolabeled whole sections. Twelve 0.6-mm core biopsies (gray circles) are represented by 1 isolated field of vision (white rectangles) each, while 2 1.2-mm core biopsies (black circles) are represented by each 4 adjacent, nonoverlapping fields of vision.
Immunohistochemistry
Prior to cutting, the TMA blocks were immersed in water and kept at −20°C for 15 min while the original tissue blocks were cooled without the use of water. Sections of 2.5-μm (whole sections) or 1.5-μm (TMAs) thickness were cut, transferred to positively charged glass slides, d dried overnight at 37°C, dewaxed, and rehydrated by routine methods. The following primary antibodies and dilutions were used: polyclonal anti-human pan T-cell (CD3), e 1:250; monoclonal anti-human pan B-cell (CD79α), e 1:300; monoclonal anti-human Ki-67, e 1:100; polyclonal anti-human/ mouse active caspase-3, f 1:150. The last antibody detects the cleaved form of caspase-3. Whole sections were labeled with all 4 antibodies, TMA sections with CD3, and CD79α antibodies. Antigen retrieval was carried out by boiling the slides in Tris/EDTA buffer e (CD3, CD79a) or citrate buffer e (Ki-67, active caspase-3) in a conventional microwave oven at 750W for 20 min. The sections were allowed to cool for 10 min and were then incubated with the primary antibody for 1 hr at room temperature. Endogenous peroxidase was inactivated after antigen retrieval by immersing the slides in peroxidase blocking solution e for 10 min at room temperature. For detection of the primary antibody, the Detection Kit e was applied according to the manufacturer's instructions. Finally, the reaction was visualized by an AEC chromogen. e The slides were counterstained with hemalum. A canine lymph node showing reactive hyperplasia was used as positive controls for CD3, CD79α, and Ki-67. Normal canine-haired skin was used as a positive and negative control for Ki-67. Formalin-fixed and paraffin wax-embedded ultraviolet-irradiated and nonirradiated canine keratinocytes were used as positive and negative controls for active caspase-3 as previously described. 10 Additional negative controls involved omission of the primary antibody.
Cell counting
The total number of cells for each FOV was assessed for Ki-67 and active caspase-3 immunostains. This was done counting positive and negative cells separately. The results were expressed as the percentage of positive cells within each FOV. Semiautomated cell counting was performed using morphometric software. g Each image was modified to enhance nuclear (Ki-67) or cellular (caspase-3) outlines, to allow automatic counting. Color thresholds for hue, saturation, and intensity were set to select positive cells, and the original color image was converted into a black and white image (binarized). Then edges were enhanced twice and particles were separated using the corresponding functions of the software. The same routine was performed to count negative cells after adjusting color thresholds. For detection of active caspase-3-positive cells, adjacent apoptotic bodies likely derived from a single cell were additionally merged by dilation (8 times) followed by a fusion of particles. The detection threshold was set at 100 pixels to avoid counting of too small particles. Each resulting image was compared visually to the original image and checked for plausibility before commencing automatic counting of particles.
Immunophenotypic classification
In whole-tissue sections, tumors were classified as T- or B-cell lymphoma if at least 50% of the neoplastic cells showed cytoplasmic labeling for either CD3 or CD79α, respectively. Tumors were classified as double negative (DN) if neoplastic cells reacted with neither of the antibodies. In TMAs, a cutoff of 10% was chosen to avoid misclassification of tumors due to the presence of non-neoplastic T or B cells, which in some cases are difficult to differentiate from neoplastic cells in core biopsies. This cutoff was determined empirically in preliminary trials on tissues included in the present study. Tumors were classified as T- or B-cell lymphoma if more than 10% of neoplastic cells were labeled for either CD3 or CD79α in at least half of the core biopsies of one case (i.e., 1 and 2 core biopsies for 1.2-mm and 0.6-mm core biopsies, respectively). Tumors were classified as DN if less than 10% of the neoplastic cells were labeled. Tumors were defined as nonclassifiable if the minimum number of core biopsies could not be evaluated because cores were missing or originated from non-neoplastic or necrotic tissue or if labeled cells approximated 10% with both antibodies. Immunostains of the whole sections and both TMAs were evaluated blindly.
Statistical analysis
Accuracy of various combinations of core sizes and numbers. Each of the 40 tumors was represented by 2 artificial 1.2-mm core biopsies and 12 artificial 0.6-mm core biopsies. In total, 20 FOVs were analyzed per tumor. For both types of core biopsies, the number of cells positive for Ki-67 and active caspase-3 and the total number of cells counted was recorded. The data from the different core biopsy sizes were analyzed separately, and it was assumed that the number of positive cells pos
ij
in tumor i and core biopsy j follows the binomial distribution: pos
ij
≈ bin (nij, π
i
). Here, nij is the total number of investigated cells of tumor i and core biopsy j and π
i
is the probability that a cell in tumor i is positive. A generalized linear model
14
with the binomial distribution and a logit-link (η
ij
= log(π
i
/1 - π
j
)) was fitted to the data of each core biopsy size. The linear predictor η
ij
is given by η
ij
= ti + bij, where ti is the fixed effect of tumor i and bij is a random error for each core biopsy j in tumor i, which allows for overdispersion. The random effects bij were assumed to be independent and normally distributed with mean 0 and variance σ2
b
. The main interest of the study lies in the variance estimate of core biopsies within a tumor,  , which is a key to the accuracy of the estimate for positivity. Because the variance of the random effect bij was estimated on a linear scale, data were simulated according to the linear predictor and each single observation was transformed into a percentage scale. The variance per tumor was determined on this scale. The data were simulated as follows: 100 virtual tumors were generated with different levels of positivity ti and a random effect for each core biopsy that was normally distributed with 0 mean and variance . Each tumor was represented by 106 virtual samples. Based on the variance estimates on the percentage scale, mean percentage positivity of core biopsies within a tumor was calculated for different numbers of core biopsies in 1 tumor. This procedure was done separately for the 0.6-mm and 1.2-mm cores for Ki-67 and active caspase-3. A reading example provided in the footnote of table 1 and comments on Figure 1 in the results section illustrate how to interpret the results.
Suitability of TMAs for immunophenotyping. Each tumor was classified into 1 of 3 categories: B, T, and DN. The level of agreement between the ratings based on 0.6-mm and 1.2-mm core biopsies and ratings based on whole sections was determined with Cohen's kappa (κ). 2 The data analysis was generated using SAS/STAT software, Version 9 of the SAS System. h
Results
Range and distribution of Ki-67 and active caspase-3 values
Whole-tissue sections of 40 canine lymphoma biopsy specimens were immunolabeled for Ki-67 and active caspase-3, and digital images representing artificial 0.6-mm and 1.2-mm core biopsies were generated (Fig. 1). The number of positive and negative cells was counted for every FOV. A total of 1,561,947 cells were counted in 1,600 FOVs with an average number of 976 cells/FOV (range 281–1,608). The mean percentage of positive cells was calculated for each individual tumor using the combined data of all core biopsies. This resulted in a mean of 19,524 cells counted for each tumor and marker. The distribution of these values differed considerably between the 2 antigens as depicted in Figure 2. The mean percentage values for Ki-67 were spread over the whole range between 0% and 100%. In contrast, the mean percentage values for caspase-3 were substantially lower, with 38 of 40 tumors yielding values below 6% and no tumor showing values above 25%.
Predicted maximum width of the 95% confidence interval and corresponding number of fields of vision (FOVs) analyzed depending on the number of cores examined.
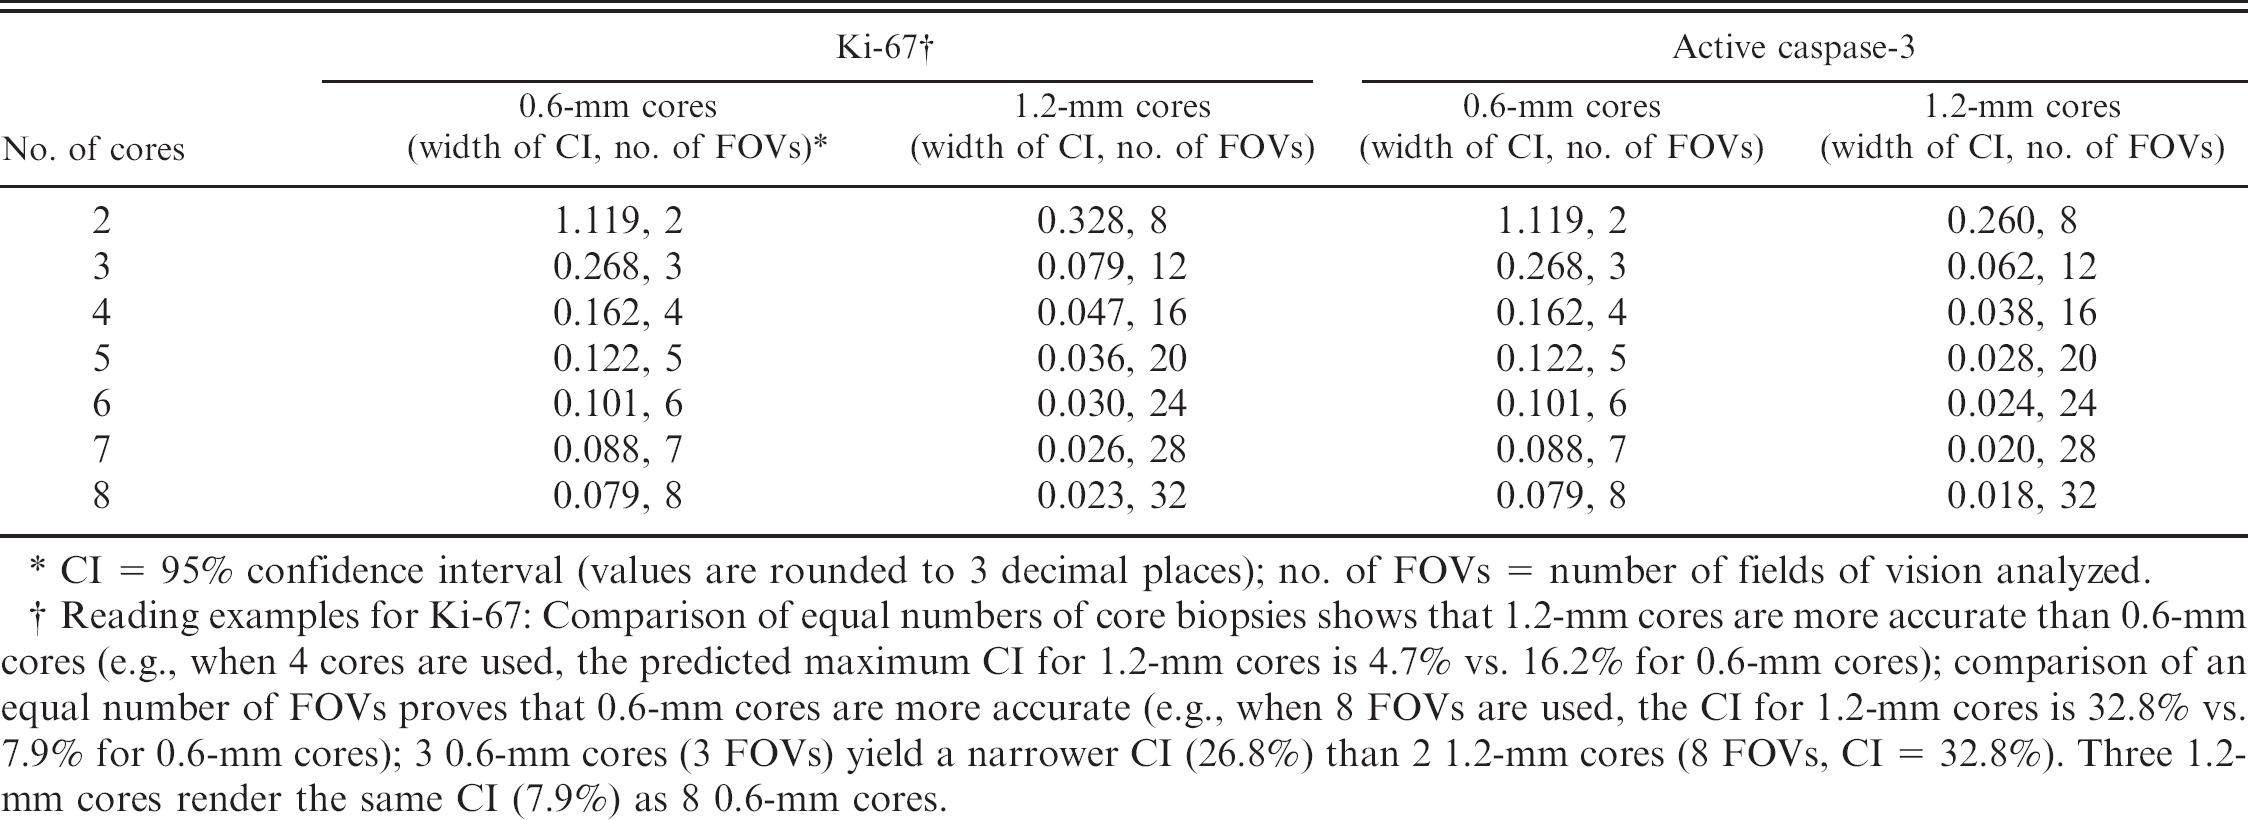
CI = 95% confidence interval (values are rounded to 3 decimal places); no. of FOVs = number of fields of vision analyzed.
Reading examples for Ki-67: Comparison of equal numbers of core biopsies shows that 1.2-mm cores are more accurate than 0.6-mm cores (e.g., when 4 cores are used, the predicted maximum CI for 1.2-mm cores is 4.7% vs. 16.2% for 0.6-mm cores); comparison of an equal number of FOVs proves that 0.6-mm cores are more accurate (e.g., when 8 FOVs are used, the CI for 1.2-mm cores is 32.8% vs. 7.9% for 0.6-mm cores); 3 0.6-mm cores (3 FOVs) yield a narrower CI (26.8%) than 2 1.2-mm cores (8 FOVs, CI = 32.8%). Three 1.2-mm cores render the same CI (7.9%) as 8 0.6-mm cores.
Accuracy of various combinations of core sizes and numbers
Applying data from the artificial TMA core biopsies, a statistical model was computed to determine the accuracy of using various combinations of core sizes and numbers compared with the whole section. As a criterion, the width of the 95% confidence interval (CI) of the mean of a tumor was chosen (Fig. 3, Table 1). The interval covers the true percentage positivity with a probability of 95%. This means that in 95 of 100 tumors, the true mean (of the whole section) will differ not more than half of the predicted CI width from the mean determined by the cores (e.g., if evaluation of 4 0.6-mm Ki-67 cores of a tumor [maximal CI width: 16.2%] renders a mean of 50%, the real mean of the whole section will lie within 41.9% to 58.1% with a probability of 95%). Figure 3 shows the width of the 95% CI depending on the mean positivity of a tumor and for different core sizes. As the mean positivity approaches 50%, the predicted mean may differ more strongly from the true mean, which is consistent with the binomial distribution of the mean values and the variation of values between cores within a tumor (Fig. 2). Table 1 shows the predicted maximum widths of the 95% CI and the number of FOVs analyzed depending on the number of cores. Based on these data, the most convenient (e.g., in terms of time or resources and of availability of tissues) combination of core number and size can be chosen to attain a predefined degree of precision expressed as a 95% CI that should not be exceeded. As a result, decisions can be made on whether it is more efficient to collect 1.2-mm cores or a higher number of 0.6-mm cores. Thus, the interval enables comparison of different combinations of sizes and numbers of core biopsies. The striking similarity of the values computed for both antigens investigated should be noted (Table 1).
Suitability of TMAs for immunophenotyping
Because immunophenotyping is indispensable for classification of lymphomas, suitability of TMAs to determine the immunophenotype was evaluated. This was done by comparing data from physical TMAs with data from the whole sections. The latter were considered the gold standard. The results are depicted in table 2. Investigation of the whole sections revealed that 24 tumors (60%) were of B-cell immunophenotype and 12 (30.0%) of T-cell phenotype. Four tumors (10.0%) did not express either marker and were therefore classified as DN. In most tumors classified either as B- or T-cell phenotype, the majority of tumor cells were labeled with the corresponding antibody. In a few cases, the overall intensity of the stain was low.
In general, results from the evaluation of 1.2-mm core biopsies revealed a higher degree of agreement with results from the evaluation of the whole section (κ = 0.91, 95% CI: 0.79–1.00) than with the 0.6-mm core biopsies (κ = 0.79, 95% CI: 0.62–0.96). All T-cell lymphomas and DN lymphomas were classified correctly with both core sizes. A number of classification errors, however, affected B-cell lymphomas. Three B-cell tumors were incorrectly classified as T-cell lymphomas, 1 with both core sizes, 1 with 0.6 mm, and 1 with 1.2 mm. In all cases, these misclassifications were due to a high content of non-neoplastic T lymphocytes. Other 3 B-cell lymphomas were erroneously classified as DN with 0.6-mm cores. In the whole sections of these cases, the overall staining intensity of neoplastic cells was weak, while in the small core biopsies, no staining was observed. An additional B-cell lymphoma could not be classified with the 0.6-mm core biopsies because the cores contained a similar number of T and B cells (≈ 10%). The same tumor was incorrectly classified as a T-cell lymphoma with the 1.2-mm cores because, in this sample, T cells predominated over B cells.
Discussion
The work described in this paper illustrates the use of an artificial approach to predict the effect of array design on accuracy in canine lymphoma TMAs. In contrast to physical arrays, as used in most validation studies, 1,3,4,6,9,12,13,16,17 artificial core biopsies allow for simple and efficient incorporation of large numbers of core biopsies. 5 The resulting data enabled the development of a statistical model to calculate the degree of accuracy by which various combinations of core sizes and numbers represent whole sections of canine lymphoma biopsies. Positivity of Ki-67 and active caspase-3 immunostains was evaluated on a continuous scale with the help of semiautomated cell counting on digital images. The FOV of the images was defined as the basic area unit to allow comparison between 0.6-mm and 1.2-mm core biopsies. The model calculations were based on the assumption that 1 FOV is analyzed for each 0.6-mm core and 4 FOVs are evaluated for each 1.2-mm core.
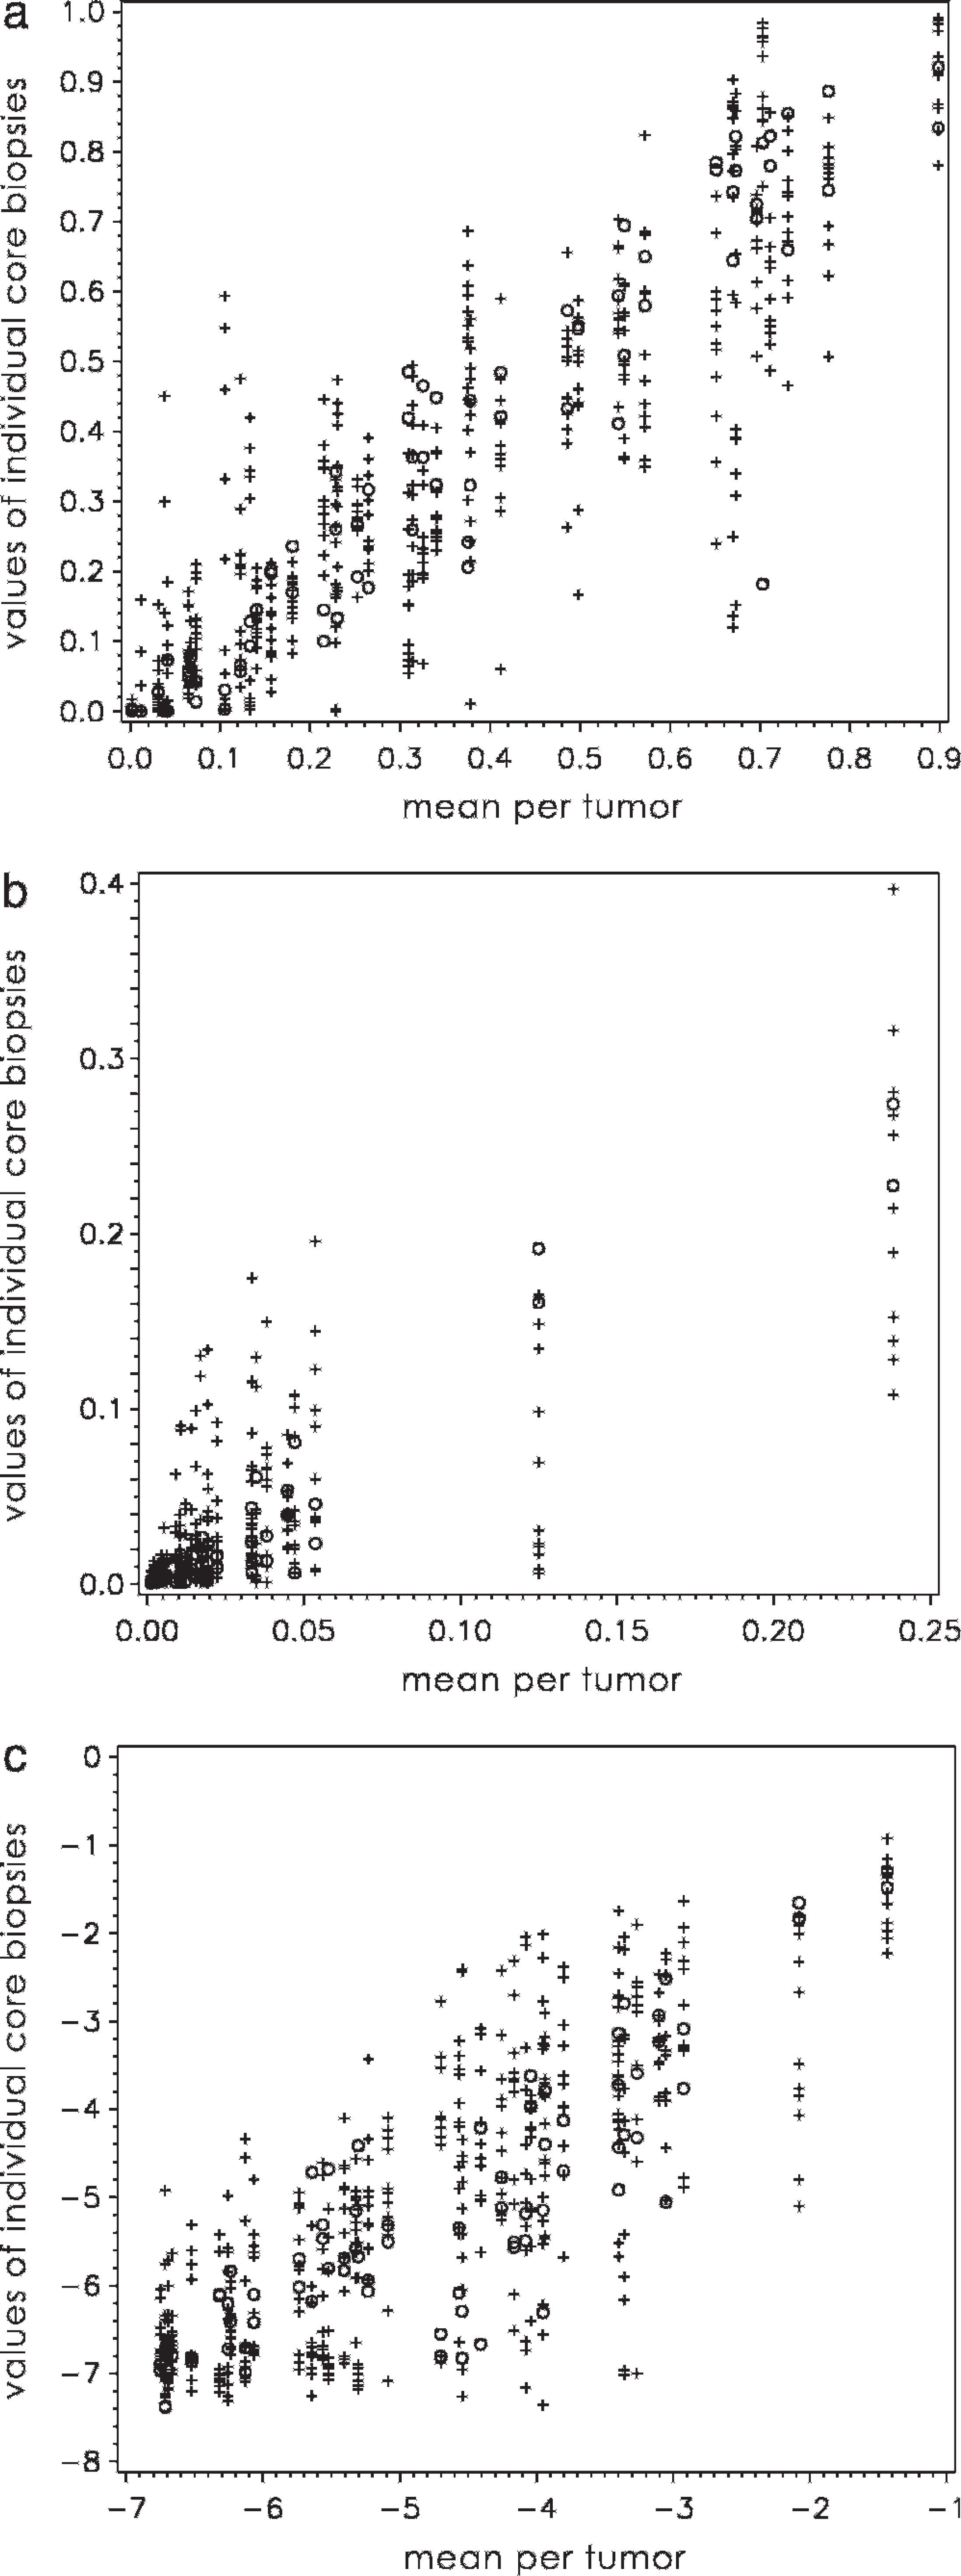
Distribution of Ki-67 and active caspase-3 positivity in 40 canine lymphomas. The values of all artificial core biopsies are plotted against the mean percentage of positive cells for each individual tumor; +, 0.6-mm core biopsies; o, 1.2-mm core biopsies; all axis values expressed as %/100.
The model indicates that a given number of 1.2-mm cores provide a clearly higher degree of accuracy (as indicated by a smaller 95% CI) than an equal number of 0.6-mm cores. This accuracy is a result of the larger total area available from the larger cores, which increases the number of FOVs for analysis. In contrast, when an equal number of FOVs is analyzed, 0.6-mm cores are superior to 1.2-mm cores. This is because the FOVs of the 0.6-mm cores are spread over a larger area of the specimen than those of 1.2-mm cores. As a general rule based on the results of this study, the number of 1.2-mm cores needed to attain a given degree of accuracy will always be lower than that of 0.6-mm cores. However, the total number of FOVs analyzed using 1.2-mm cores will be higher. Therefore, selection of 1.2-mm cores requires more effort for evaluation (i.e., counting a larger number of cells), whereas the use of 0.6-mm cores necessitates more work to assemble the array. However, cell counting is likely to be the more labor-intensive step, especially if multiple markers are evaluated. Based on these considerations, it can be concluded that in most situations in which scoring is performed on a continuous scale, it is more convenient to use 0.6-mm than 1.2-mm core biopsies.
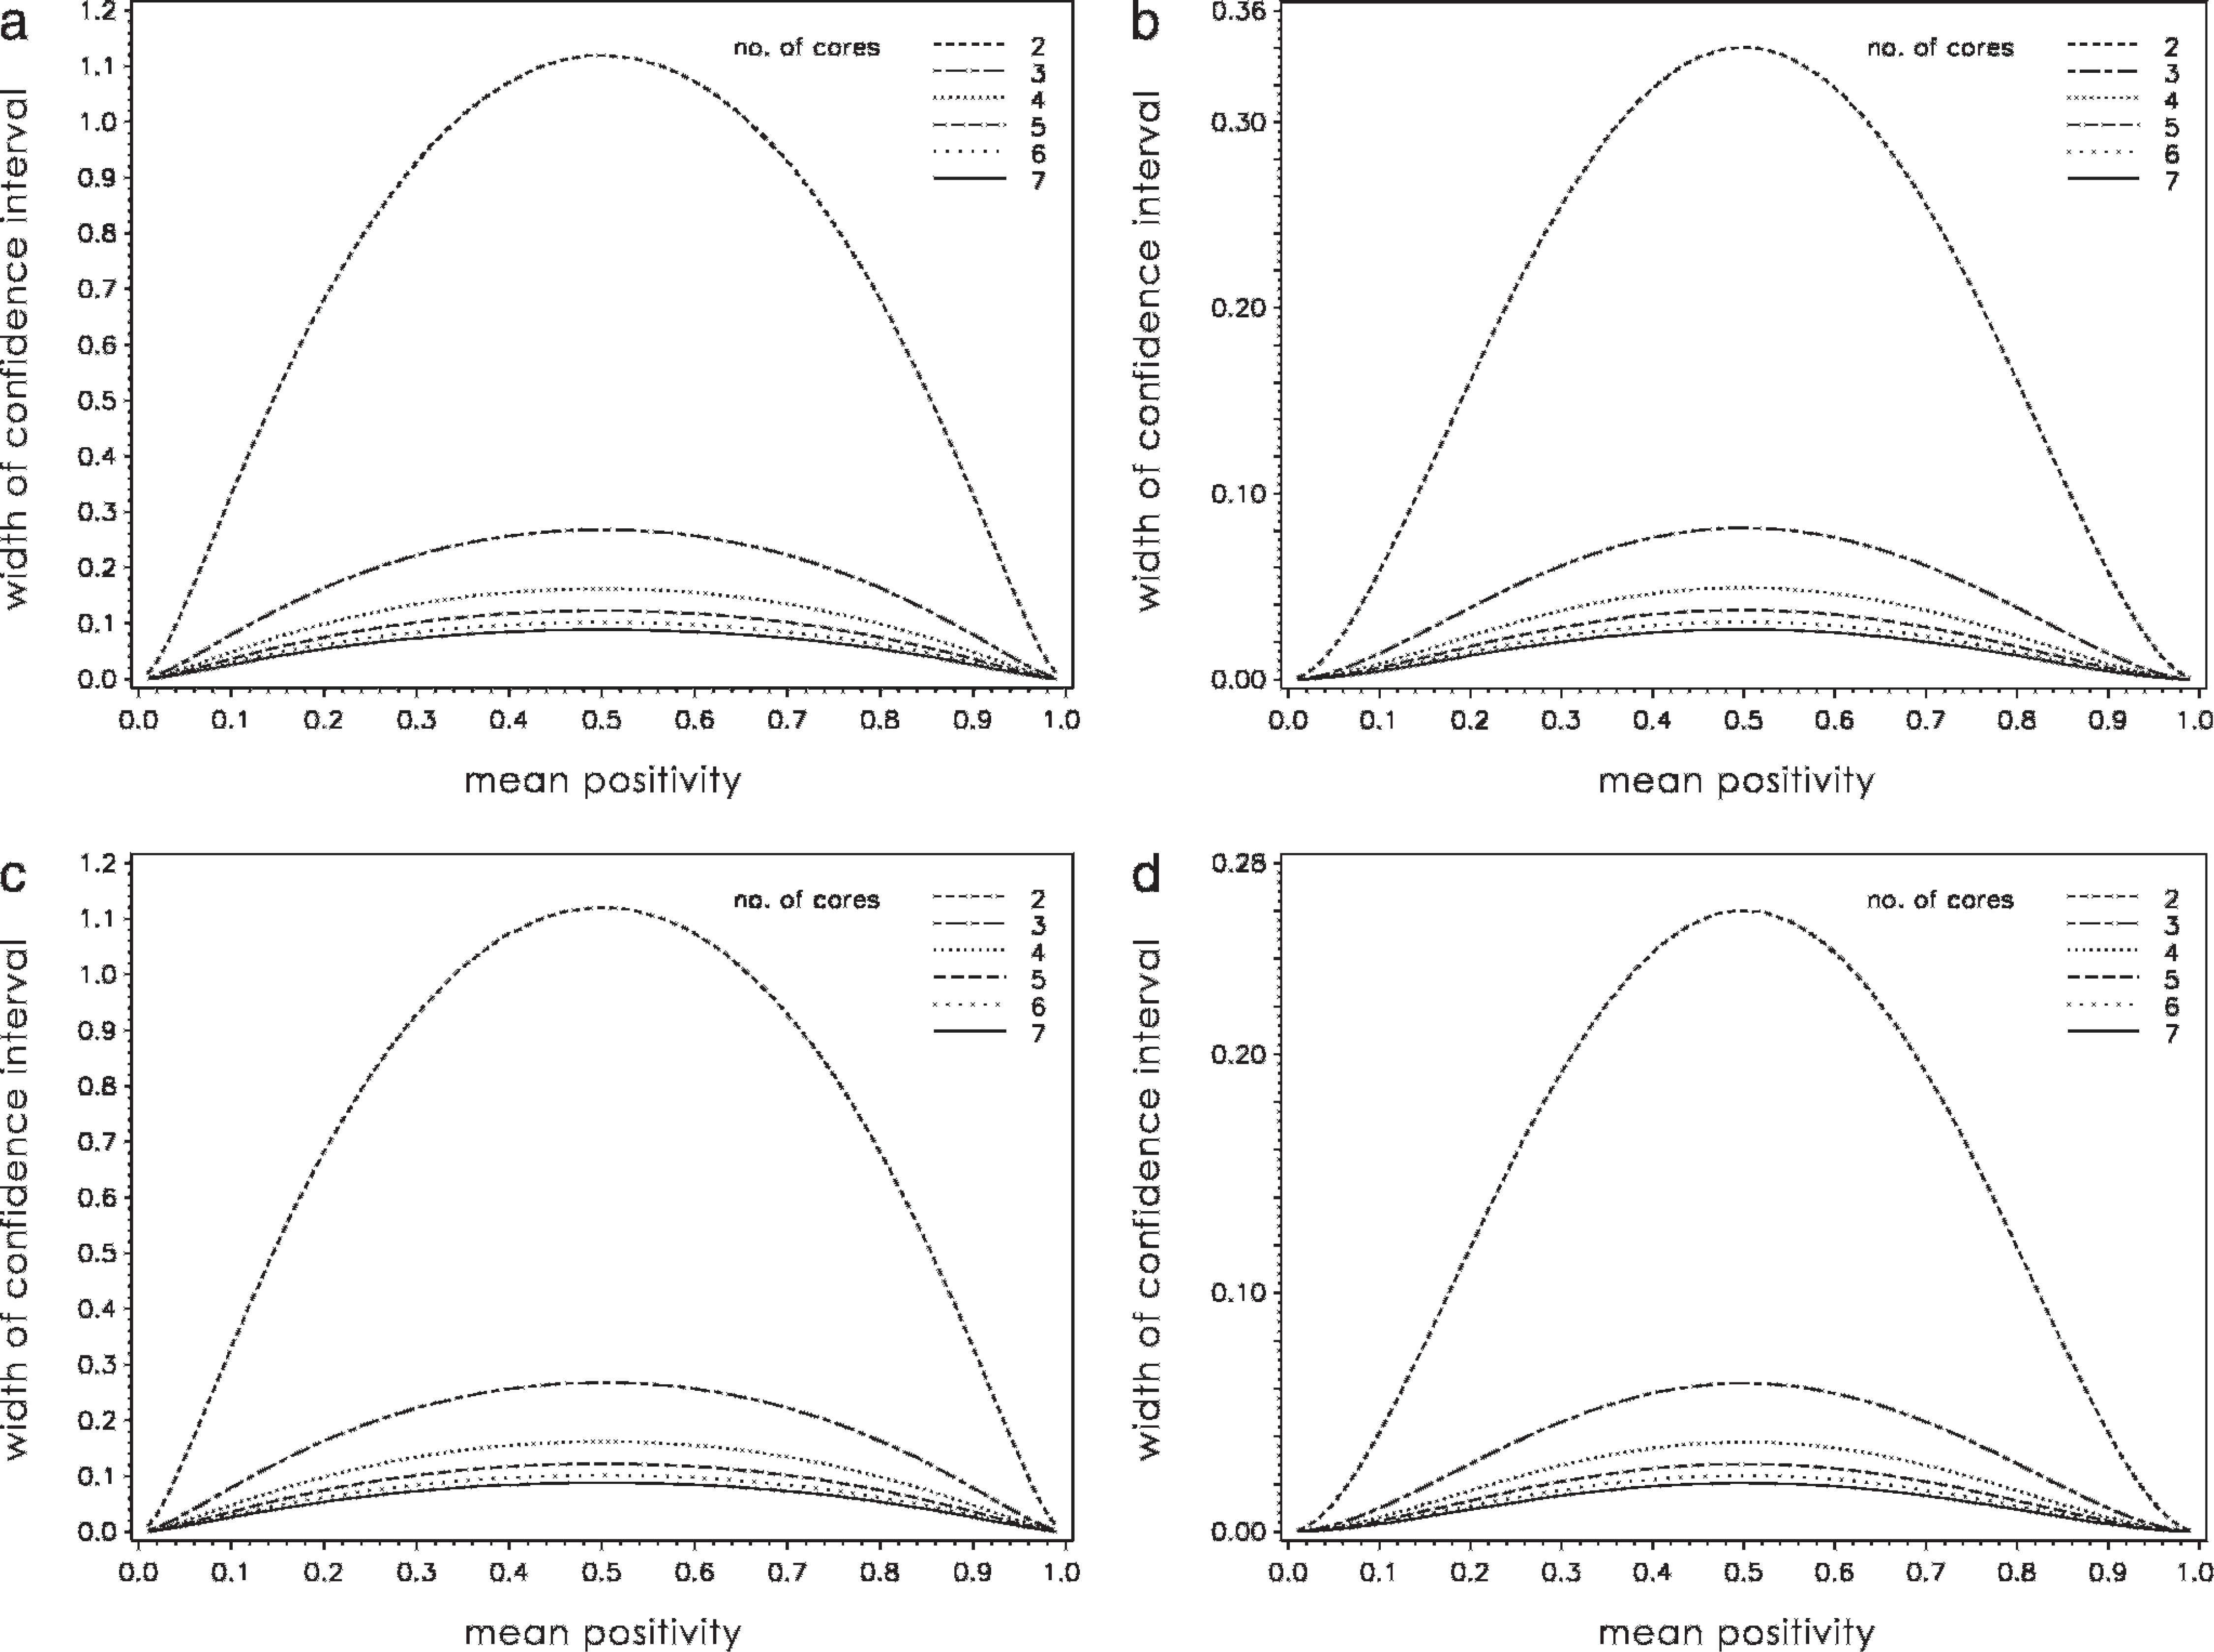
Variation of predicted width of the 95% confidence interval in dependence of the mean positivity of a tumor and the number of tissue cores analyzed; all axis values expressed as %/100.
Results of CD3/CD79α immunohistochemistry and comparison of whole sections versus core biopsies.∗
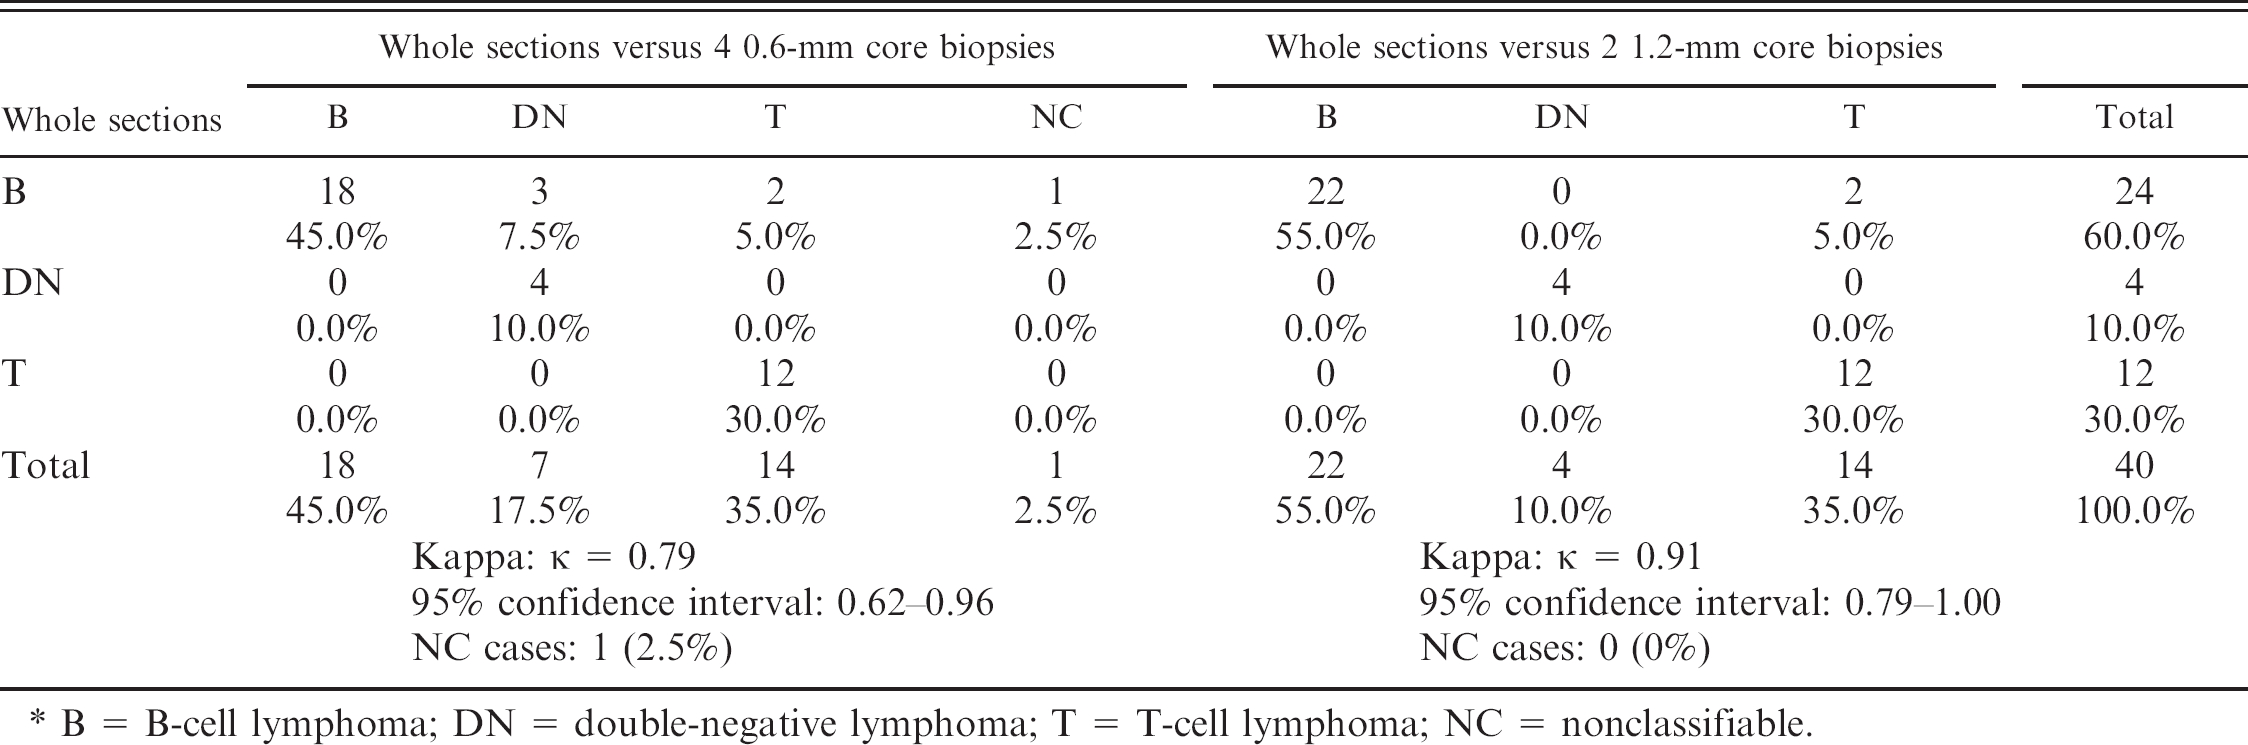
B = B-cell lymphoma; DN = double-negative lymphoma; T = T-cell lymphoma; NC = nonclassifiable.
As expected, the model predicts that an increase in core number is associated with an increase in accuracy, which is expressed as a decrease in the 95% CI width of the mean percentage positivity of core biopsies within a tumor. It is important to stress, however, that the amplitude of this decrease also progressively declines, as illustrated by an increased proximity of the corresponding curves in Figure 3. A similar observation has been reported in a previous TMA study that focused on human colorectal cancers. 5 At some point, the increased accuracy obtained by evaluating an additional core does not justify the extra effort, and other factors (e.g., interobserver variations, precision of cell counting) are likely to be a greater source of imprecision. Additional factors that influence the degree of accuracy include whether positive cells are scored in a binary or ordinary fashion or counted on a continuous scale and whether a marker is distributed homogeneously within a tumor.
In cancer research, the prognostic or predictive significance of a particular protein, or its potential role in pathogenesis, is often determined by immunohistochemical staining of tumors. Often it is not until immunohistochemical results are correlated to other parameters (e.g., patient data, tumor grade) that the degree of required accuracy can be defined. If the data are too imprecise, correlations might be overlooked. In this study, an unexpected and striking similarity was seen between the predictions computed for the 2 antigens examined, particularly considering their unequal range and distribution of positive percentage values. This similarity might simply be a coincidence, but it suggests that the degree of accuracy is only partially dependent on the marker analyzed.
Based on the model, it appears to the authors that collecting at least 4 0.6-mm or 2 1.2-mm core biopsies would adequately represent the whole sections without extending time and effort beyond acceptable limits. Compared with previous studies, this number of suggested cores is rather high. However, most studies scored positivity in a binary 1,4,7–9,13 or ordinary 6,17 way, which is less precise than using a continuous scale and is likely to require fewer cores. Furthermore, most validation studies only focus on a predetermined number of cores, 3,4,8,9,12,13,16,17 and comparison between studies is difficult due to variations in several parameters, such as antigen examined, scoring method or statistical analysis used, interinstitutional variability among observers, and immunohistochemical staining methods. 17
Two combinations of core sizes and numbers were used to assemble physical arrays from the case material, which were tested in a practical application (i.e., to immunophenotype the tumors). In general, comparison of core biopsies with the whole sections revealed a high degree of agreement, but this practical approach also unveiled some limitations of the TMA technique. When evaluating whole sections, the tissue architecture can be taken into account to select representative areas, whereas this advantage is reduced or lacking when core biopsies are analyzed. This observation is compatible with the fact that 1.2-mm cores showed a better agreement with the whole sections than 0.6-mm cores in the present study.
Tumors incorrectly classified with the TMAs either displayed a weak overall staining intensity or presented with core biopsies containing a high number of non-neoplastic lymphocytes. Additional possible sources of discrepancies include loss of individual core biopsies during preparation, heterogeneous staining of specimens and variations of staining intensity in different runs, and the antibody applied. For instance, all T-cell tumors identified on the TMAs using an additional monoclonal CD3 antibody were correctly classified, but this antibody yielded a higher number of DN or nonclassifiable tumors in the core biopsies than the polyclonal antibody (data not shown). This was attributed to the lower reactivity of the monoclonal versus polyclonal antibody. To avoid misclassification of non-distinctive cases, the authors suggest that labeling of the whole section be performed if tumors are classified as DN or are not classifiable based on core biopsies. Alternatively, if the immunophenotype must be determined with the highest possible accuracy, the whole sections of all tumors should be labeled. At this point, TMA data quality could further be improved by additional immunolabeling of the TMAs. This would facilitate recognition and exclusion of non-representative cores (i.e., cores with divergent immunolabeling), which might otherwise be challenging or even impossible in some subtypes of lymphoma.
In conclusion, the model presented in this study provides a general insight into the degree of accuracy by which tissue arrays may represent whole sections. The statistical approach developed might be applied to other antigens and tumor types. In a practical application, TMAs appeared to be suited for immunophenotyping of canine lymphomas, despite the occurrence of known technical limitations. The study provides a basis for the use of TMAs in future high-throughput immunohistochemical investigations of selected markers in canine lymphomas and should encourage the use of this technique in veterinary medicine.
Acknowledgements
The authors are greatly indebted to Mrs. S. Wunderlin for excellent technical help and to Dr. A. Polkinghorne for assistance in preparation of the manuscript. This project was funded by a Vetsuisse grant.
Footnotes
a.
JVC KY-F70, Yokohama, Japan.
b.
Beecher instruments, Sun Prairie, WI.
c.
Polysciences Inc., Warrington, PA.
d.
Erie Scientific Company, Portsmouth, NH.
e.
Dako Cytomation, Zug, Switzerland.
f.
R&D Systems Europe Ltd., Abingdon, United Kingdom.
g.
Soft Imaging System, Muenster, Germany.
h.
SAS, Heidelberg, Germany.