
Abstract
In mammals, thyrotropin, or thyroid-stimulating hormone (TSH), assay is used for the diagnosis of primary hypothyroidism. Hypothyroidism is the most common type of thyroid disorder in cattle. The aim of this study was to develop and validate, under physiologic and pathologic conditions, a radioimmunoassay (RIA) for bovine TSH (bTSH). Double RIA was performed with purified bTSH and specific bovine antiserum. Laboratory validation included research of minimal detection limit, accuracy, and reproducibility. The physiologic validation included a thyrotropin-releasing hormone (TRH) challenge performed on euthyroid cows and a follow-up of bTSH concentration over a 24-hour period. Furthermore, bTSH concentration was assayed in a large population of healthy dairy and beef cows to define reference interval. The pathologic validation was made by assaying bTSH and thyroid hormones on healthy and goitrous newborn calves. The minimum detection limit (MDL) for bTSH assay was 1.3 μU/ml. The recovery was 101% to 106%. The intra- and interassay coefficients of variation (CVs) ranged from 5% to 11% and 11% to 15%, respectively. The RIA covered the whole range of physiologic bTSH values, as shown by bTSH values induced by TRH-challenge. A pulsatile secretion of bTSH was observed, accompanied by a diurnal variation with lower night values than day values. Reference intervals of bTSH ranged from 1.3 to 13.0 μU/ml for beef and dairy breeds. Finally, bTSH easily discriminated goitrous newborn calves from healthy ones, leading to the definition of a cutoff value of 35 μU/ml. The bTSH assay positively reacted to physiologic and pathologic conditions. The accuracy and precision of the RIA were satisfying.
Keywords
Introduction
The hypothalamic-pituitary-thyroid axis is of particular importance for the adaptation of mammals to their environment. 16 Thyrotropin, or thyroid-stimulating hormone (TSH), is a glycoprotein produced in the anterior pituitary gland. Thyrotropin-releasing hormone (TRH), a neuropeptide produced in the para-ventricular nucleus of hypothalamus, controls the secretion of TSH. Thyroid-stimulating hormone acts on receptors of the thyroid gland to promote the synthesis and release of thyroid hormones (thyroxine [T4], tri-iodothyronine [T3]). Furthermore, thyroid hormones participate in the control of TSH secretion by a negative feedback on the pituitary gland and hypothalamus. 12 Low thyroid hormones levels due to iodine deficiency or altered utilization of iodine can increase the secretion of TSH, serving as a basis for the diagnosis of hypothyroidism in different species. 2,8,29
Hypothyroidism is the most common thyroid disorder in cattle. The possible causes of hypothyroidism in ruminants are a low iodine intake or an interference with absorption and utilization of dietary iodine. Although goiter is not necessarily related to hypothyroidism, numerous cases of goiter associated with hypothyroidism have been reported in cattle 21,25,30 without bovine thyrotropin (bTSH) having been investigated. Plasma or urinary iodine levels serve as an indicator of nutritional intake, but they are not directly related to thyroid function. 23 A sensitive way to evaluate thyroid function in cattle is the measurement of thyroid hormones, 25 which could also be replaced by assays of TSH concentration that can be useful for evaluating hypothyroidism, as commonly achieved in humans 8 and other mammalian species. 2,29
In humans, immunoradiometric assays (IRMAs) of TSH are routinely performed to assess hypo- and hyperthyroidism. 8 In dogs, TSH is assayed by competitive radioimmunoassay (RIA) to diagnose hypothyroidism. 29 Equine hypothyroidism can also be diagnosed by RIA-TSH. 2 In cattle, double-antibody RIAs were achieved for bTSH assay, 6,11 although limited data regarding bTSH values for healthy cattle are found in the literature. 3,6,11,26
The aim of the study was to develop and validate a specific and sensitive RIA for bTSH before defining reference interval for healthy dairy and beef cattle. The RIA was validated under physiologic (TRH challenge and circadian assays) and pathologic (goitrous calves) conditions.
Material and methods
The Animal Care and Use Council of the University of Liège approved the use and treatment of animals in this study. Thyrotropin-releasing hormone challenge and 24-hr sampling were first performed to obtain a physiologic validation of the bTSH assay. Thereafter, reference interval was defined on a large population of clinically healthy cows. Last, the bTSH RIA was tested under pathologic conditions on goitrous calves.
Development of the RIA bTSH
Buffer and bTSH-free plasma. The buffer used throughout the procedure contained bovine serum albumin a (BSA) 1 g/L, Tris-HCl 25 mM, b MgCl2 10 mM, c and sodium azide b 0.02%, w/v. The pH of the final solution was 7.4. Bovine thyrotropin-free plasma was prepared using the plasma of a healthy 2-mo-old male Belgian Blue calf. The calf was given orally 4,000 μg of thyroxine d twice at a 12-hr interval to induce a negative feedback in the hypothalamus and pituitary gland and inhibit secretion of TSH. Blood (heparin tube e ) was taken 3 and 5 hr after the second administration of the drug. Immediately after sampling, blood was centrifuged (20 min, 1,500 × g). Plasma was frozen (-20°C) until analysis. After being tested by RIA, the plasma of this calf was used for all assays.
Antigen, antiserum, and precipitant. Bovine-purified TSH (WHO-NIBSC 53/011, dissolved in 0.05 M phosphate buffer pH 7.4 in aliquots of 500 mU/200 μl) f was used for the standard. An anti-bTSH serum g was raised in rabbits against a preparation of highly purified bTSH, h as previously described. 28 Cross-reactions were less than 0.05% with follicle-stimulating hormone (FSH), 1% with luteinizing hormone (LH), 0.01% with prolactin, and less than 0.01% with growth hormone (GH). This antibody was conserved in glycerol/phosphate buffer (pH 7.4) 9/1 v/v. Antiserum was used at a final dilution of 1:20,000. The second antibody precipitation system consisted of a mixture of sheep anti-rabbit IgG (0.83%, v/v), normal rabbit serum (0.17%, v/v), PEG i 4%, BSA a 0.4%, and microcrystalline cellulose b 0.05%.
Radio-iodination. A preparation of highly purified bovine TSH h (prepared as similarly described for porcine thyrotropin 4 ) was used for the tracer. The bTSH was labeled according to the chloramine-T procedure10 with Na-125I j and chloramine-T. k The same tracer was used in RIA for up to a 4-wk duration.
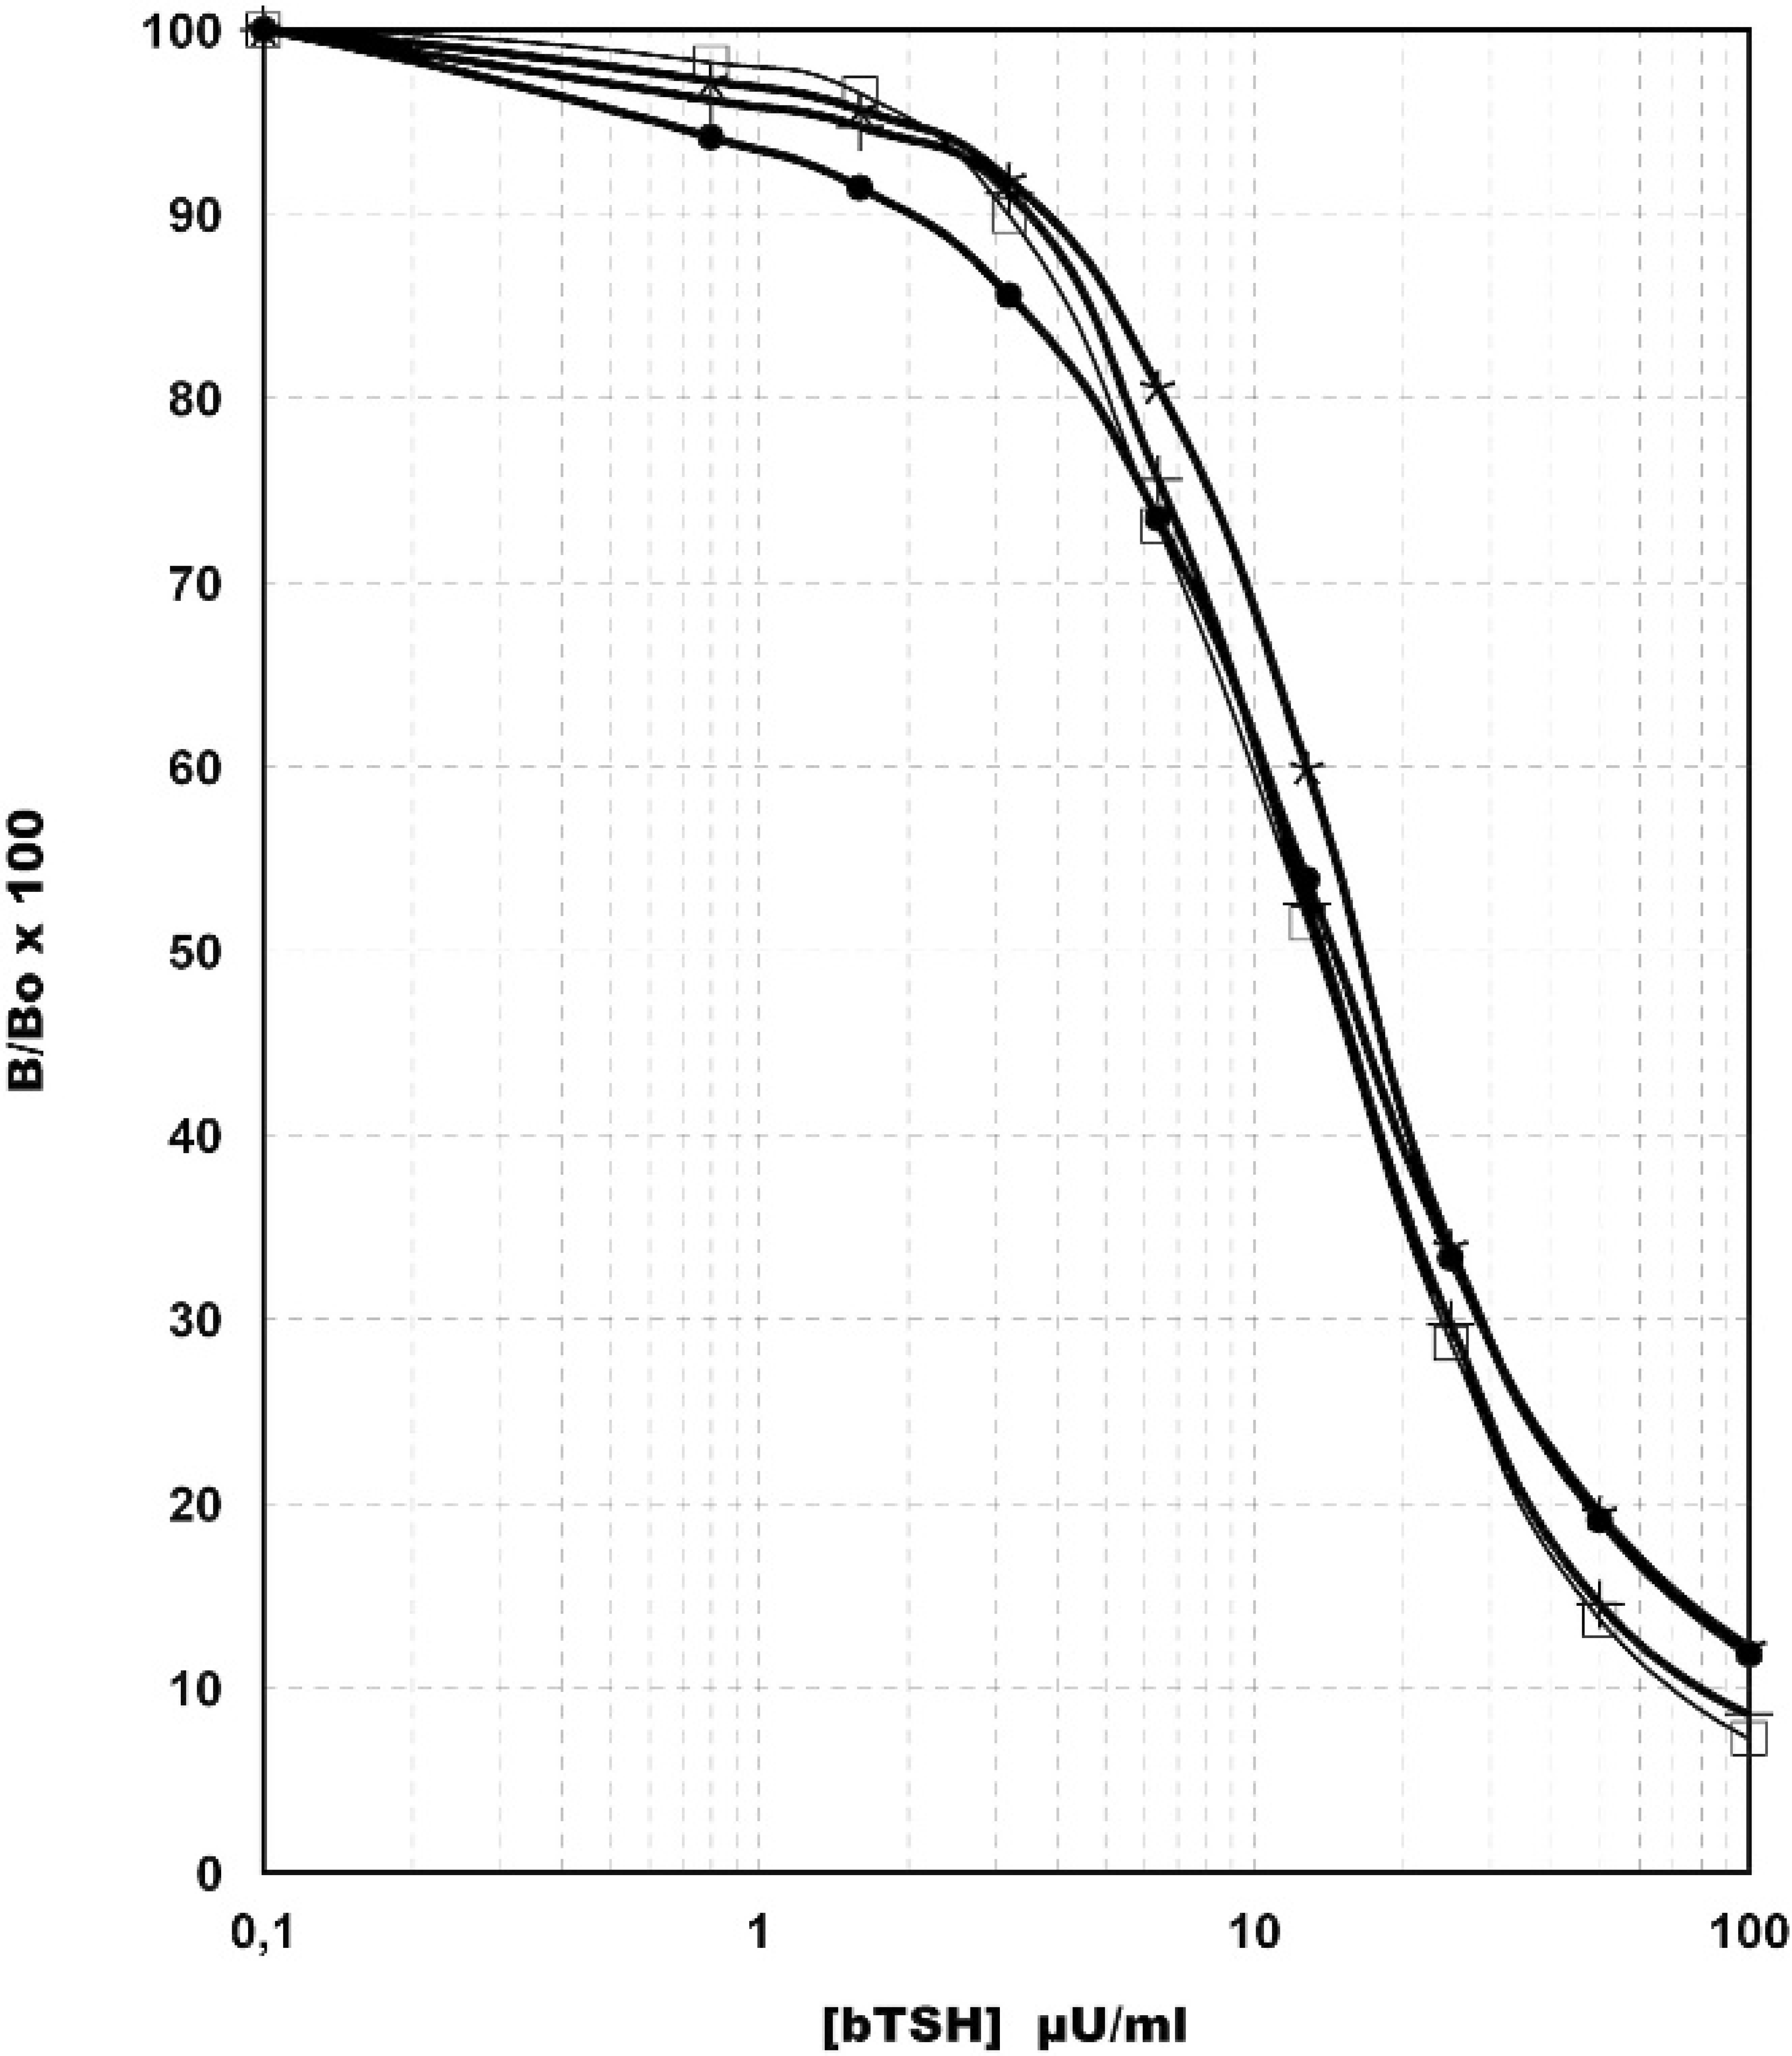
Bovine thyroid-stimulating hormone radioimmuno-assay standard curve in 4 different assays.
Method. The RIA was performed in duplicate in polystyrene tubes. For the standard curve determination, each tube contained 200 μL of purified bTSH (WHONIBSC 53/011) f ranging from 0.8 to 100.0 μU/ml dissolved in bTSH-free plasma (prepared as described above). The same volume of bovine plasma was used for determination of bTSH concentration in study samples. All the tubes were preincubated for 24 hr with 100 μL of anti-bTSH serum at room temperature (20°C). Thereafter, 200 μL of labeled bTSH (approximately 20,000 cpm) were added, and the incubation continued for a further 40 hr at 4°C. This mixture was incubated with 1 ml of precipitant during 30 min at 20°C. Thereafter, the bound and free ligands were separated by centrifugation (20 min, 2,800 × g) after washing with 2 ml of buffer. The supernatant was removed, and the radioactivity of the pellet was determined in an automatic γ-counter. 1 Logit-log transformation was used to produce linear standard curves and to estimate the bTSH concentration of samples. Figure 1 shows typical standard curves obtained in 4 different bTSH assays.
Characteristics of the RIA bTSH
Minimum detection limit (MDL) and accuracy. The sensitivity of the RIA was determined by measuring the smallest detectable concentration of bTSH. 22 The zero value was measured 20 times in the same assay. The standard zero mean and SD of precipitate counts were calculated. The bTSH value that corresponds to the mean count of the zero minus 2 SD transposed onto the standard curve was defined as the MDL in this RIA.
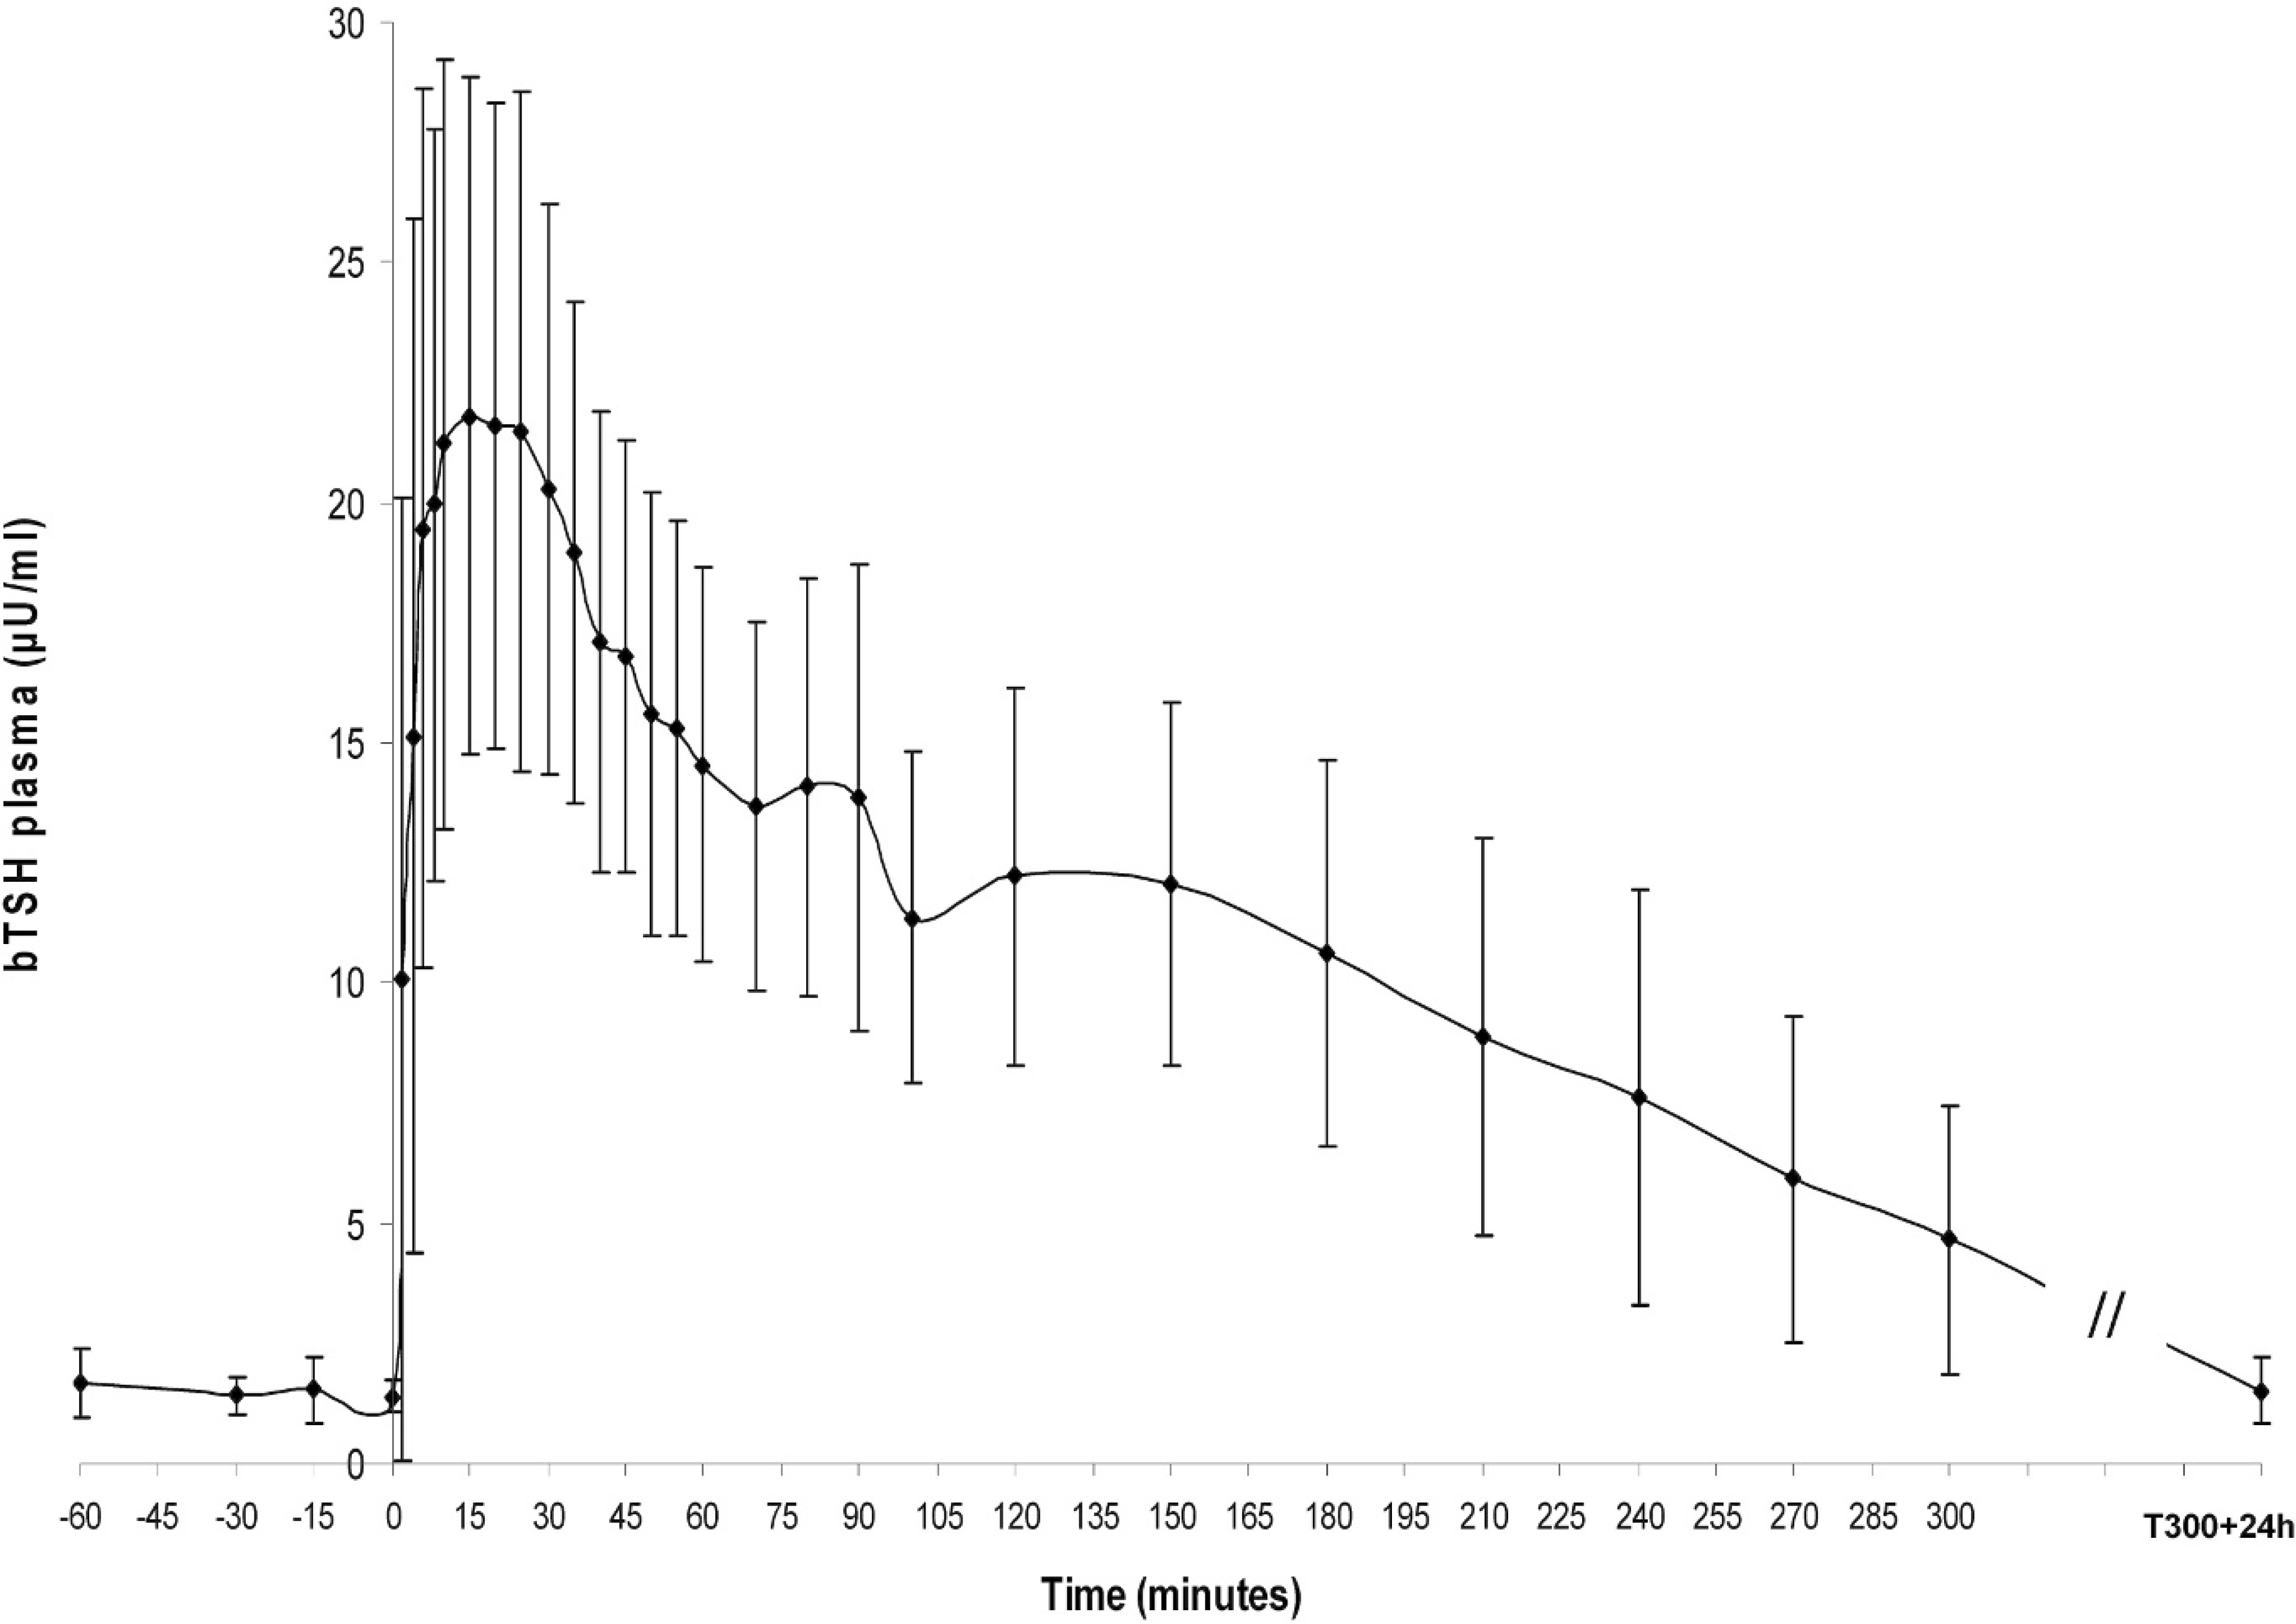
Thyroid-stimulating hormone challenge in 8 euthyroid cows.
The accuracy test was carried out by adding known concentrations (5, 10, 15, 20, and 25 μU) of bTSH to 1 ml of bovine plasma. The test was performed in duplicate in the plasma from 2 cows. The percentage of recovery was calculated according to the following formula: (observed value/expected value) × 100.
Serial dilutions (1:1, 1:2, 1:4, and 1:8) of bovine plasma containing high amounts of endogenous bTSH were performed in bTSH-free plasma. Lines of equal slope between standard curve and unknown samples show that there is no significant proportional analytical error within those ranges.
Reproducibility. Samples of bovine plasma with low (1 sample), moderate (1 sample), and high (2 samples) concentrations of bTSH were tested for reproducibility. The precision of the RIA was determined by calculating the intra- and interassay CV. To determine the intra-assay CV, the same plasma was measured 20 times within the same assay. The interassay reproducibility was assessed by analyzing the same plasma in 10 different assays.
Physiological validation of the RIA bTSH
TRH challenge. Eight healthy Holstein-Friesian nonpregnant and nonlactating cows, aged 6 ± 2 yr (mean ± SD) were used for the study. They were kept attached in stalls on straw bedding. Luminosity (12 hr/day), temperature (19.0°C ± 0.9°C, mean ± SD), and relative humidity (69.4 % ± 7.1%, mean ± SD) were controlled. Cows were fed twice a day, and the ration was composed of good-quality hay, dried beet pulps, concentrates (20% crude proteins), and barley. Water was provided ad libitum.
Blood was collected from the jugular vein of each cow via intravenous catheters m into heparin tubes. c A baseline of 4 samples taken in 1 hr was constituted prior to injection of TRH. At T0, a solution of 0.02% TRH n was injected intravenously into the cows at the dosage of 2 μg/kg body weight. Thereafter, blood was collected at predefined intervals (Fig. 2). Blood was centrifuged (20 min, 1,500 × g) and plasma frozen immediately (-20°C) before analysis. The mean peak bTSH value was calculated taking the highest bTSH concentration per cow. This peak was reached at different times, varying from each cow.
bTSH 24-hour follow-up. The same cows described above were used for the trial. The experiment began at 8:00
Reference interval of bTSH in healthy cows
Three hundred and thirty cows, aged 5 ± 2 yr (mean ± SD) from 69 different randomly selected herds, half in Belgium and half in France, were used for this trial that was spread from mid-autumn to mid-spring. Animals were also randomly chosen but were all clinically healthy. No drug that could interfere with TSH secretion was administered to this population of cows at least 1 mo before sampling. Approximately half (n = 169) of the cows belonged to dairy breeds and the other half (n = 161) to beef breeds. Among dairy cows, 72% were Holstein-Friesian (other breeds: Montbéliarde and Normande). Among beef cows, 63% were Charolais (other breeds: Belgian Blue, Blonde d'Aquitaine, Limousine, Salers, and Aubrac). Blood was collected from a jugular vein into tubes containing heparin o for measuring bTSH and T4.
Pathological validation of the RIA bTSH
Cases of congenital goiter, associated or not with stillbirth, had been reported by bovine practitioners in 2 beef herds. Twelve newborn calves with palpable goiter were studied. Blood samples (heparin tubes, o sampling from jugular vein) were taken on the first day of life. Furthermore, 45 healthy newborn calves from other herds were sampled in the same manner. Bovine thyroid-stimulating hormone, T4, and T3 were assayed.
Other assays
T3 and T4. Concentrations of total T3 and total T4 were assayed using diagnostic kits p,q in 20 μl of plasma. These kits were previously validated for cattle at the Endocrinology Laboratory of the National Veterinary School of Lyon (France). For T4, intra- and interassay CVs ranged from 2.6% to 6.4% and from 5.1% to 11.2%, respectively; for T3, intra- and interassay CVs ranged from 3.1% to 79% and from 4.3% to 8.3%, respectively. Recovery varied from 87% to 108% and from 92% to 99% for T4 and T3, respectively. The MDL was 12.6 nmol/ L and 0.14 nmol/L for T4 and T3, respectively.
Statistical analysis
Statistical analysis was performed using “R” software. 13 Variable normality was checked with the Shapiro-Wilk test. Wilcoxon rank sum test was used to test the difference between dairy and beef cow values for bTSH and T4/bTSH ratio in a population of 330 healthy cows and for bTSH, T3, T4/T3, and T4/bTSH ratio between goitrous and healthy calves. The same test was used for comparison of values of bTSH, T4, T3, T4/T3, and T4/bTSH in goitrous-dead and goitrous-alive calves. Due to the low number of cases, these comparisons must be considered as trends. The significance of the difference between reference interval values of T4 for dairy and beef cows and between goitrous and healthy calves T4 values was determined with a Student's t-test. Multiple comparisons of means (mix crossed model without repetition with 2-factor variability) were used to analyze circadian variations of bTSH. Wilcoxon signed rank test was used to determine the significance of differences between bTSH values at peak and other times (T0, T300, T300+24 hr) in TRH challenge and between values of healthy calves and their dams for bTSH and T4. The reference interval data was subjected to Spearman's rank correlation analysis for determining the link and the correlation coefficient (r) between bTSH and T4. When bTSH concentration was undetectable, the value of the MDL was used for the statistical analyses. Results are expressed as either median or percentile 2.5th and 97.5th or mean ± SD, according to the distribution of data. For reference interval values, 95% of the population was taken. 19 Reference interval is proposed as a range (percentile 2.5th, 50th, and 97.5th or mean ± 1.96 SD for normally distributed data). Cutoff value for hypothyroidism in newborn calves has been calculated using Win Episcope 2.0 software. 27
Results
Development and characterization of the bTSH RIA
MDL and accuracy. The MDL was 1.3 μU/ml. The recovery of the assay ranged from 101% to 106 % (104 ± 2%). Serial 2-fold dilutions of bovine plasma (from 56.5 to 7.3 μU/ml) showed dose-response parallel with the standard curve. The corrected values of bTSH after dilution (58.2 ± 0.4 μU/ml) were close to the value of the nondiluted plasma (56.5 μU/ml).
Reproducibility. The intra-assay CVs of 4 samples of bovine plasma were 5%, 9%, 7%, and 11% for bTSH values, respectively, equal to 33.2 ± 1.7, 26.0 ± 2.3, 11.3 ± 0.8, and 2.1 ± 0.2 μU/ml. The interassay CVs of 4 samples of bovine plasma were 14%, 12%, 11%, and 15% for bTSH values, respectively, equal to 14.0 ± 2.0, 13.9 ± 1.7, 7.4 ± 0.8, and 3.1 ± 0.5 μU/ml.
Physiological validation of the RIA: TRH challenge and bTSH 24-hour follow-up
TRH challenge. Figure 2 illustrates the bTSH response to TRH challenge. The bTSH reached peak concentration (25.5 ± 9.6 μU/ml) quickly after TRH injection (14 ± 6 minutes). The concentration of bTSH at peak was 9 to 34 times higher (P < 0.01) than at T0 (1.4 ± 0.3 μU/ml). Thereafter, bTSH concentration slowly decreased and attained, 5 hours after TRH injection (T300), a concentration still higher than at T0 (different from peak value at P < 0.01 and different from T0 at P < 0.05). Twenty-nine hours after injection (T300 + 24 hours), concentration of bTSH returned to the baseline value of T0 (P > 0.1).
bTSH 24-hour follow-up. It appeared that bTSH was secreted in a pulsatile manner all along the 24-hour period (1 representative cow in Fig. 3). There was a significant difference (P < 0.05) between concentration of bTSH during the day (8:00
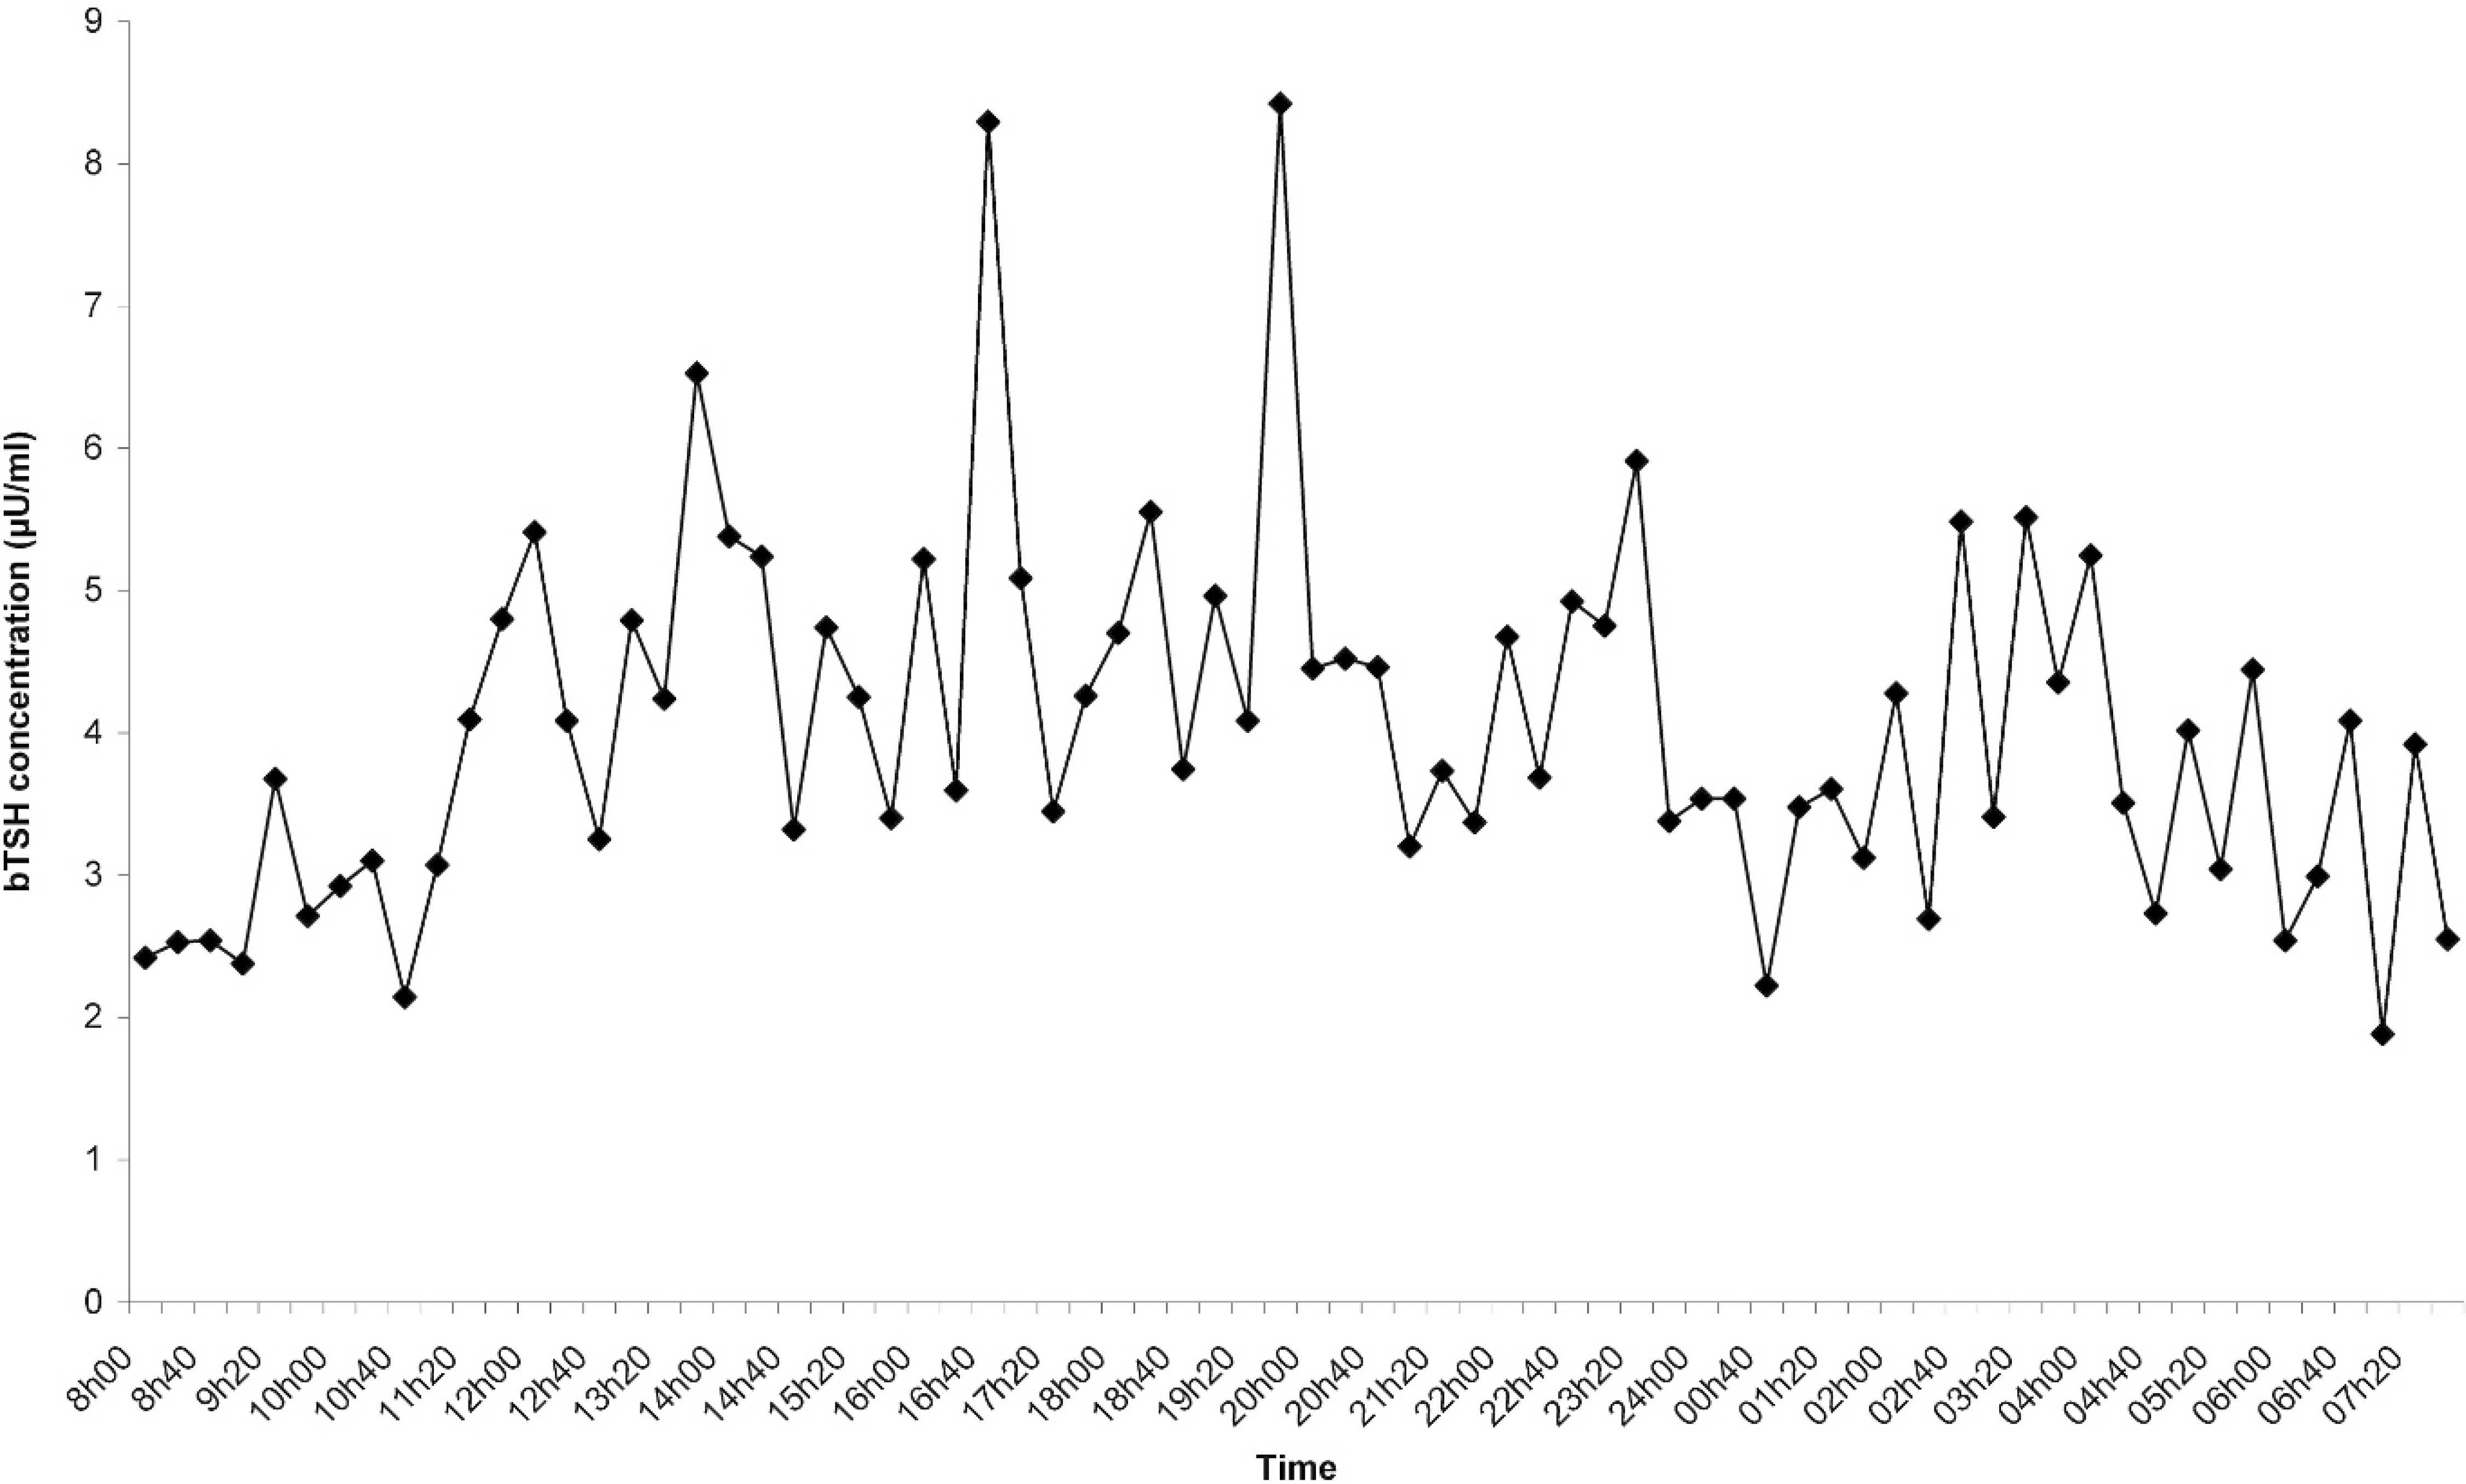
Pulsatile pattern of bovine thyroid-stimulating hormone secretion in a 24-hour period in a euthyroid cow.
Establishment of reference interval of bTSH in a population of healthy cows
Only T4 data were normally distributed. Values of bTSH, T4, and T4/bTSH ratio are shown in table 1. Using this study's RIA, 20% of the sampled cows (n = 66) were below the MDL for bTSH. Figure 4 presents a histogram of frequency showing the distribution of bTSH in healthy cows.
Range of reference intervals for bovine thyroid-stimulating hormone (bTSH) (percentiles 2.5–50–97.5th) and T4 (mean ± 1.96 SD) in a population of clinically healthy cows (aged 5 ± 2 yr with a range from 2 to 10 yr).
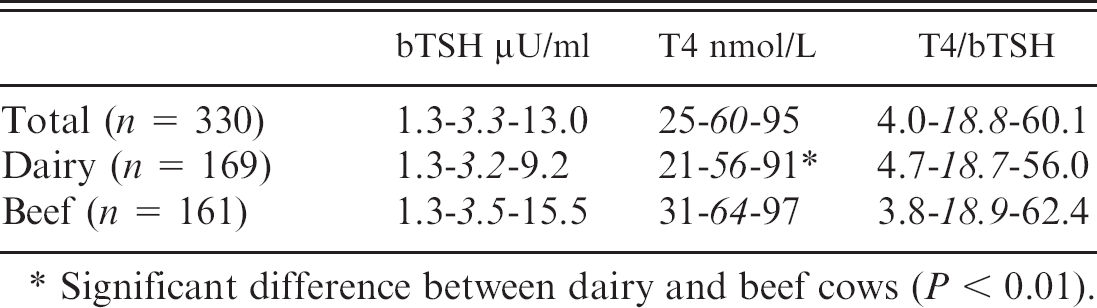
Significant difference between dairy and beef cows (P < 0.01).
There was no significant difference (P > 0.05) between dairy and beef cows for bTSH values. Nevertheless, higher T4 values were seen in beef cows compared with dairy cows (P < 0.01). The ratio T4/bTSH was not different in the 2 groups of cows (P > 0.1). A weak correlation was found between bTSH and T4 values (P < 0.01, r = 0.17), but only when values lower than MDL were excluded (n = 66). Considering all values (n = 330), the correlation became nonsignificant (P = 0.06).
Pathological validation of the RIA bTSH: goitrous and healthy newborn calves
Comparison of values of bTSH, T4, T3, T4/T3, and T4/bTSH in healthy and goitrous calves and their statistical relevance are presented in table 2. A significantly higher value of bTSH was measured for goitrous calves (P < 0.01) compared with healthy calves. Significantly higher values were observed for healthy calves compared with goitrous calves regarding T4, T4/T3 ratio, and T4/bTSH ratio (P < 0.01) and T3 (P < 0.05). Regarding the group of goitrous calves, 8 of them (those that had larger thyroid gland at palpation and were hairless) died within the first day of life, while the 4 other goitrous calves (with moderate goiter and normal hair) survived. From bTSH, T4, and T3 results (Table 2), the 8 goitrous calves that died were considered hypothyroid, whereas the 4 other calves were not. Finally, values of bTSH and T4 were significantly higher (P < 0.01) for healthy newborn calves compared with healthy cows of the reference population described above. Figure 4 shows the distribution of bTSH values in healthy cows (n = 330), healthy calves (n = 45), and goitrous calves (n = 12).
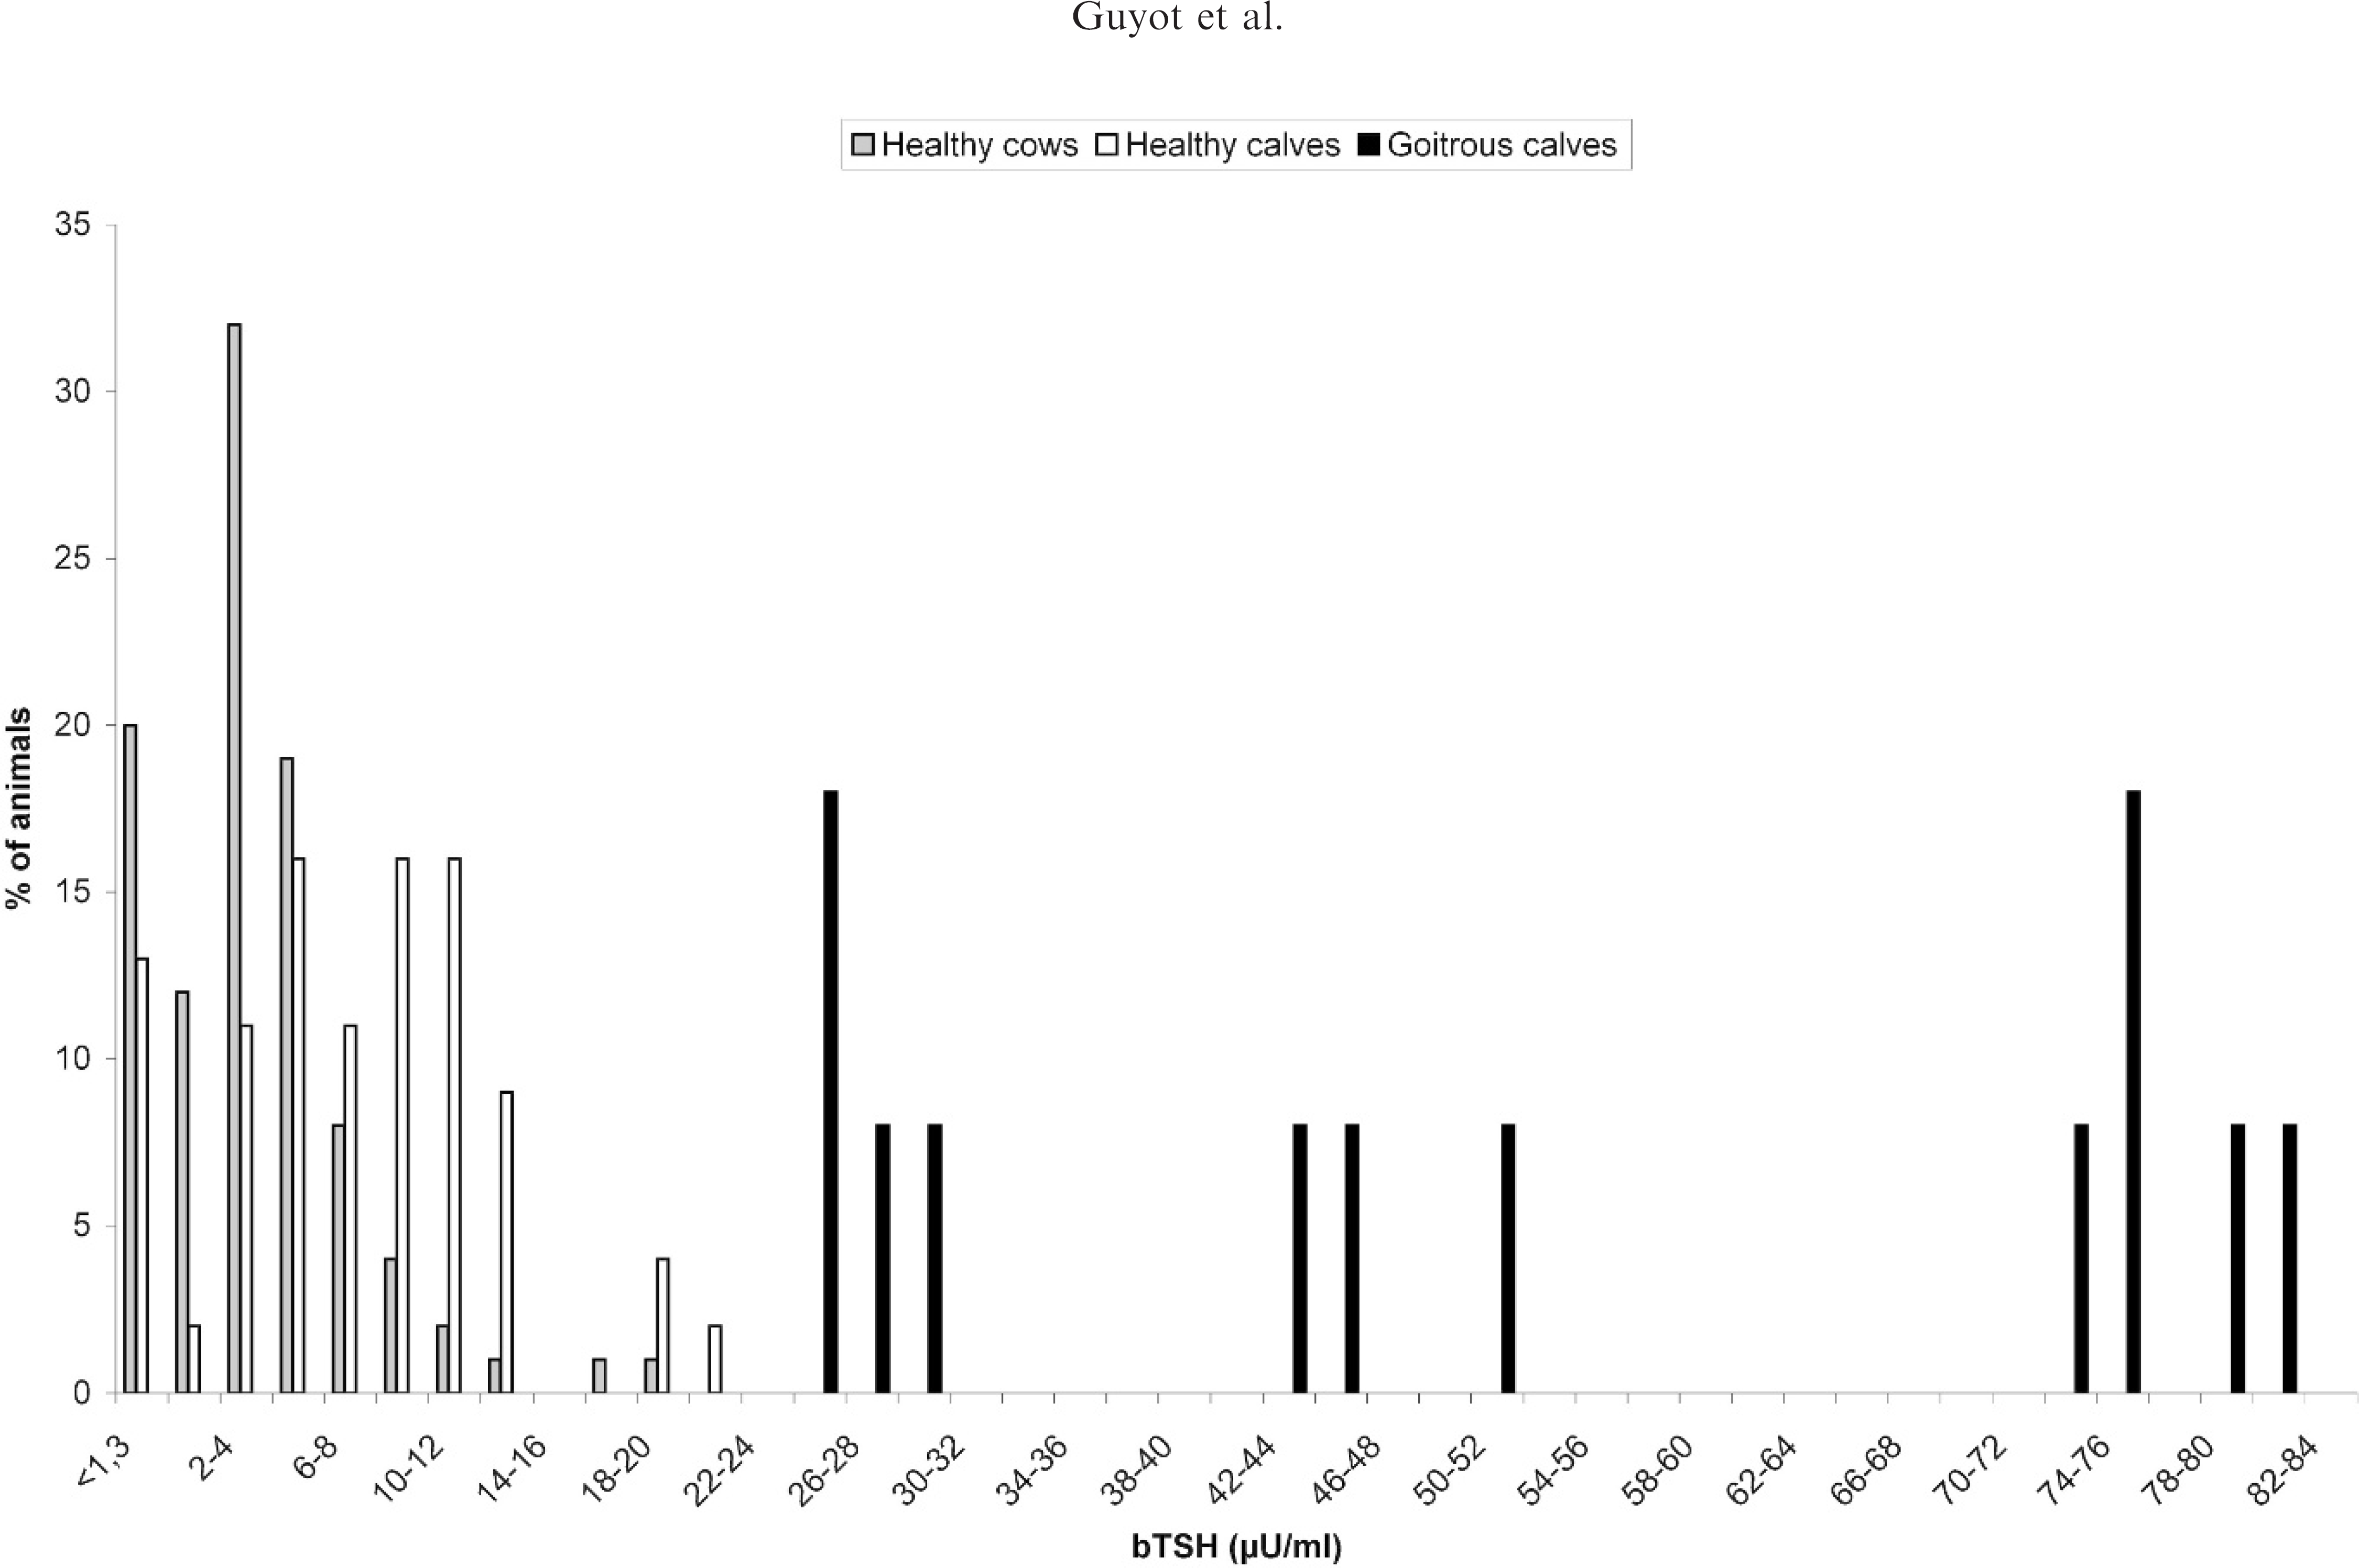
Frequency histogram of bovine thyroid-stimulating hormone concentration in healthy cows (n = 330), healthy newborn calves (n = 45), and goitrous newborn calves (n = 12).
For the discrimination of hypothyroid newborn calves, a cutoff value of 35 μU/ml has been stated with 100% of sensitivity and specificity. Nevertheless, this cutoff value has been calculated on the basis of a low number of hypothyroid newborn calves (n = 8) compared with healthy (n = 45) and goitrous but nonhypothyroid (n = 4) newborn calves.
Comparison of bovine thyroid-stimulating hormone (bTSH), T4, T3, T4/T3, and T4/bTSH in clinically healthy and goitrous newborn calves (percentiles 2.5–50–97.5th).∗
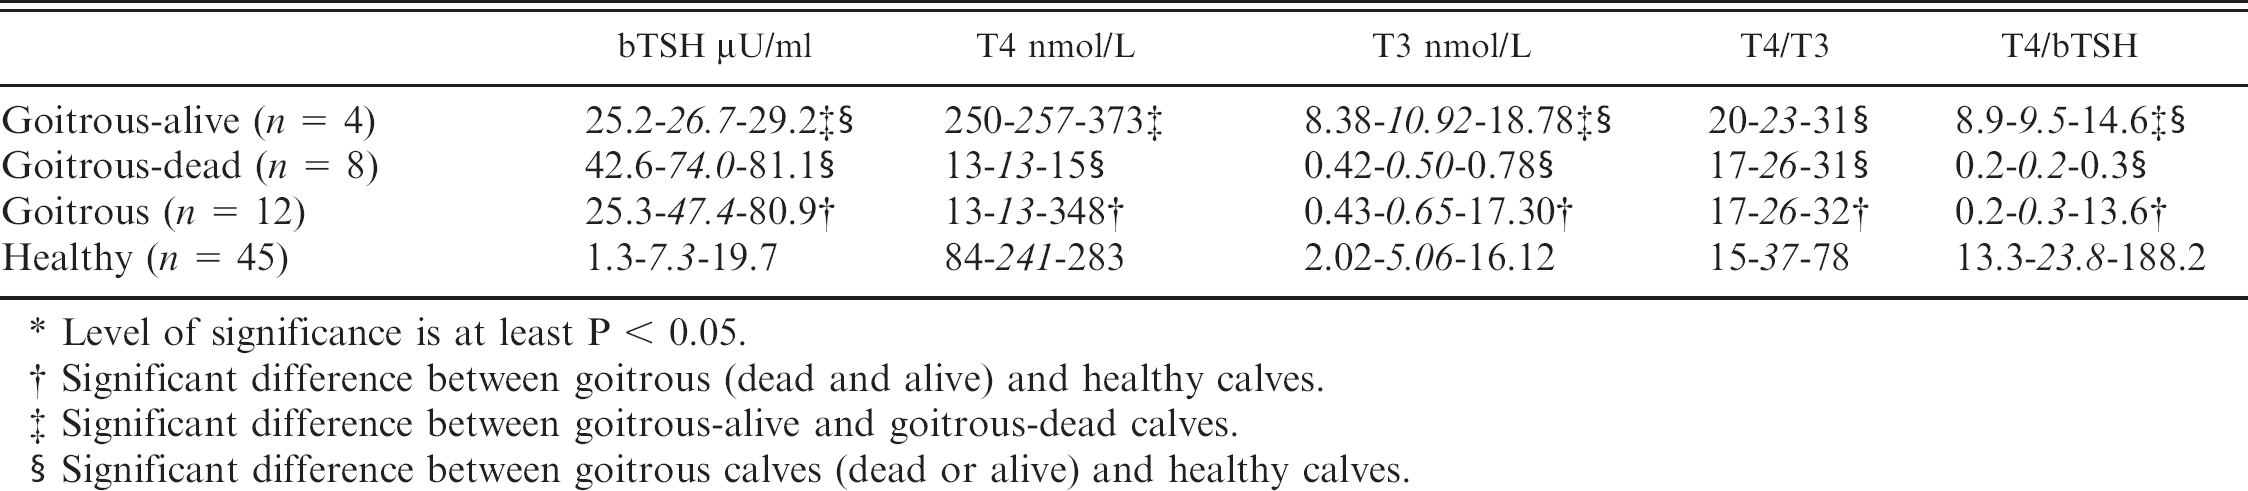
Level of significance is at least P < 0.05.
Significant difference between goitrous (dead and alive) and healthy calves.
Significant difference between goitrous-alive and goitrous-dead calves.
Significant difference between goitrous calves (dead or alive) and healthy calves.
Discussion
After testing different systems of RIA (with various conditions of incubation, temperatures and times, antiserum dilutions, iodination methods, and volumes of assay), it was clear that the method described in this paper was the most sensitive and reproducible one for the determination of bTSH concentration in plasma.
The injection of TRH effectively stimulated the secretion of TSH in the 8 cows. Globally, the TSH response curve to TRH challenge was in accordance with numerous studies in cattle. 5,20 The amplitude of TSH response described in this study was similar to that reported in a previous study 20 and more marked when compared with older ones. 5 This is probably due to the higher dose of TRH administered in both the present and the more recent study. 20
The TRH challenge induced a large range of bTSH values. These values stayed within the limits of this study's RIA and involved the whole range of those presented for reference interval (extremes included). The physiologic response of bTSH after TRH injection validated this study's RIA from low (MDL) to high values of bTSH. Furthermore, the half-life of bTSH could be rated to be slightly less than 3 hours based on the decrease curve of bTSH concentration after TRH injection.
Pulsatility of bTSH secretion has been described in cattle, 24,26 but relatively few studies have examined bTSH secretion in this species. Nevertheless, the general pattern of bTSH secretion over 24 hours observed in this study was comparable to those presented in previous studies. Thyroid-stimulating hormone secretion also follows a pulsatile pattern in humans, although nadir levels are reached in the afternoon and peak levels at night, 18 contrarily to cattle, as observed in this study.
Despite its circadian variation and pulsatile pattern of secretion, bTSH can be assayed at any moment during the day with a reasonably good diagnostic value. Indeed, the range of reference values did not overlap the range of pathologic ones that are generally found to be much higher.
Twenty percent of the bTSH values of this study's cow population were below the MDL. For these cows, T4 levels were within the range of reference interval. Based on T4 values and pulsatility of bTSH, it was likely that the studied cows were not hyperthyroid, even though bTSH was below the MDL. Cows were probably sampled at a time when bTSH secretion was low. Because the assay was not sensitive enough in low bTSH values, it cannot be used as a test for hyperthyroidism. For this purpose, more sensitive IRMA methods should be developed in cattle. However, the RIA developed in this study proved to be a valuable tool for the detection of thyroid disorders related to hypothyroidism (associated with high bTSH values).
In this study, the reference interval was defined during the autumn-winter season. Thyroid hormones levels are known to vary according to the season, 17 even though the authors consider that the stage of lactation has more influence than the season. However, sampling during summer would be interesting to evaluate the seasonal effect.
It was difficult to compare this study's values of bTSH with those found in the literature because only a few studies reported values in large populations of cows. Previous authors 6 had values of bTSH almost 10 times higher (30–50 μU/ml). They justified their result by stating that they were in an endemic region of iodine deficiency-related goiter. Other authors 9 published values of bTSH (3.8–26.9 μU/ml) that were close to those obtained in this study, but the number of sampled animals was low (2 Highlander, 3 Zebu, 2 Angus, 3 Hereford, 6 Holstein, and 3 Guernsey), precluding the establishment of reference interval.
The T4 values were used to compare this study's population of healthy cows with other populations of healthy cows to indirectly validate the reference values of bTSH. Values of T4 in healthy adult cows found in the literature 14,25 were in accordance with those of this study. In this study, the difference seen in T4 levels in dairy and beef herds might come from the different selenium levels in these 2 populations. Indeed, a selenium deficiency can cause a significant decrease of T3, increase of T4, and inhibition of deiodinase type I (the enzyme allows the transformation of T4 into T3) in the bovine liver. 1
Different authors have reported that thyroid hormones of the newborn calf vigorously increase in the hours after calving (maximum levels the first day of life) and decrease until 5 to 10 days after calving. 7,25 In babies, hTSH is also known to increase in the hours after birth (“TSH surge” 30 minutes after birth) and to stabilize at lower levels about 24 to 48 hours after birth. 15 A similar phenomenon seems to occur in cattle, too. High TSH levels are thus frequent in the newborn and may not be specifically attributed to hypothyroidism. In this study, the authors had to sample blood quickly in the herds with congenital goiter because mortalities occurred within the first 24 hours of life in these calves. Weighing and histology of thyroid glands were not performed on dead calves, in order to confirm the diagnosis of goiter induced by hypothyroidism. However, thyroid hormones and especially the ratio T4/T3 were sufficient to make such diagnosis. 25 Nevertheless, although T4/T3 ratio was helpful to find goitrous calves, it did not allow discrimination of goitrous-dead and goitrous-alive calves, contrarily to bTSH that could discriminate these subgroups of goitrous calves.
Values of bTSH in 60 healthy calves at birth slightly lower (3.49 ± 0.75 μU/ml) than this study have been formerly reported. 3 Other authors 26 found in 5 healthy Jersey calves, aged from 2 to 80 days, a range of bTSH values between approximately 1.0 μU/ml and 4.0 μU/ml. Despite the huge variation of hormone concentrations on the first day of life, bTSH did easily discriminate hypothyroid calves from healthy calves in this study. Further studies with a more important population of older healthy and hypothyroid calves are needed to determine another cutoff value at an age at which bTSH concentration is stabilized.
In conclusion, this study's RIA has proved its capacity to measure a wide range of bTSH values, varying from physiologic to pathologic, with relatively good precision. It appeared that hypothyroid newborn calves were related to bTSH values extremely different from values of healthy animals. Nevertheless, researchers must be aware of the limitation of this test when low bTSH values are measured. Indeed, this RIA could only be considered as a tool to improve the diagnosis of hypothyroidism in cattle.
Footnotes
a.
BSA Fraction V, ICN Biomedicals, Orsay, France.
b.
Merck, Overijse, Belgium.
c.
Biochemika (Fluka), Sigma-Aldrich, Bornem, Belgium.
d.
Elthyrone®, Levothyroxinum natricum, 200 μg/tablet, Abbott, Ottignies, Belgium.
e.
Vacuette®, sodium heparin, Greiner Bio-One, Courtaboeuf, France.
f.
Thyrotrophin International Standard NIBSC 53/011, WHONIBSC, Hertfordshire, United Kingdom.
g.
Anti-bTSH serum (1975/Batch-001) was provided by Prof. J. Closset, University of Liège, Faculty of Medicine, General, Human and Pathological Biochemistry, Endocrinology Laboratory, Liège, Belgium.
h.
Highly purified bTSH (21 IU/mg in terms of WHO-NIBSC 53/011 reference preparation) was provided by Prof. J. Closset.
i.
Vel, Leuven, Belgium.
j.
Amersham Pharmacia Biotech, Buckinghamshire, United Kingdom.
k.
Sigma, Sigma-Aldrich, Bornem, Belgium.
l.
LKB Wallac 126 Multigamma counter, Turku, Finland.
m.
Intraflon®, short intravenous catheter, 14G, L.80 mm, Vycon, Ecouen, France.
n.
Thyrotropin releasing hormone, 50 mg, Sigma-Aldrich, Bornem, Belgium.
o.
S-Monovette®, lithium heparin, Sarstedt, Essen, Belgium.
p.
Clinical Assays™ GammaCoat™ M Total T3 125I RIA Kit, DiaSorin, Stillwater, Minnesota.
q.
Clinical Assays™ GammaCoat™ M Total T4 125I RIA Kit, DiaSorin, Stillwater, MN.