
Abstract
A glass-based microarray was developed to detect 11 antimicrobial resistance genes that confer resistance to aminoglycosides, tetracyclines, sulfonamides, and chloramphenicols. The target genes for microarray were generated from Salmonella isolates by PCR and confirmed by sequencing. The specificity of the microarray was tested using 11 positive DNA probes. The sensitivity was tested with tetA gene and Salmonella isolates. Using detection threshold of signal-to-noise ratio (S/N) ≥1.5 or median pixel intensity ≥1000, antimicrobial resistance genes carried by 30 Salmonella isolates were detected. Common genes included sul I (76.7%, 23/30), aph(3′)-IIa (60%, 18/30), tetC (60%, 18/30), cat1 (43.3%, 13/30), tetA (40%, 12/ 30) and aadA1 (36.7%, 11/30), and the results were confirmed to be correct by PCR.
Introduction
During the past decades, the worldwide use of antimicrobials in animal husbandry for purposes of prophylaxis, chemotherapy, and growth promotion has created enormous pressure for the selection of antimicrobial resistance among bacteria. 24 Today, there is increasing concern about the severity of antimicrobial resistance in Salmonella, which is an important reservoir of antimicrobial resistance genes; many other enteric pathogens and commensal bacteria may also play a role as reservoirs for antimicrobial resistance genes. 11,12,19
The minimal inhibitory concentration (MIC) technique is commonly used to determine the resistance of pathogenic or commensal bacteria because of its simplicity and because MICs provide information that is useful in prescribing appropriate antimicrobials. Phenotypic testing such as the MIC technique, however, will not detect “silent” antimicrobial resistance genes that might be expressed in vivo or disseminated to other bacteria. 14,20 Molecular testing methods offer similar information more quickly and provide for more discriminatory information. 6,9,15 Because of the large number of recognized antimicrobial resistance genes, parallel detection systems such as microarrays are well suited to this task. 4
DNA microarray (or microchip) technology is a powerful tool for studying antimicrobial resistance genes. Compared with conventional membrane-based hybridization, glass slide-based microarrays offer the additional advantages of rapid detection, lower cost, automation, and low background levels. 22 A few microarrays have been developed to date for identifying antimicrobial resistance genes. 4,10,16,20,23 This study describes a microarray technique for detecting the genes that confer resistance to aminoglycosides, tetracyclines, sulfonamides, and chloramphenicols. The PCR-generated DNA of antimicrobial resistance genes from Salmonella isolates was used as the basis for the microarray.
Materials and methods
Salmonella isolates
Thirty Salmonella isolates were analyzed in this study. The isolates were recovered from dead pigs at 14 farms in 6 provinces in the People's Republic of China from March 2001 to March 2003. All Salmonella organisms were isolated and purified on Salmonella shigella (SS) agar. a The isolates were further identified using ATB identification kits b and were serotyped with commercial antisera according to the manufacturer's instructions. c
Antimicrobial susceptibility testing
The MIC of antimicrobials for the Salmonella isolates was determined and interpreted using the National Committee for Clinical Laboratory Standards. 17,18 The 11 antimicrobials were streptomycin (Str), gentamicin (Gen), kanamycin (Kan), neomycin (Neo), tetracycline (Tet), doxycycline (Dox), sulfamethoxazole (Smx), sulfamethoxazole trimethoprim (Sxt), chloramphenicol (Chl), thiophenicol (Tpc), and florfenicol (Ffc). Escherichia coli ATCC25922 and Salmonella C79-13 were used as quality-control organisms. d
PCR, gene sequence analysis
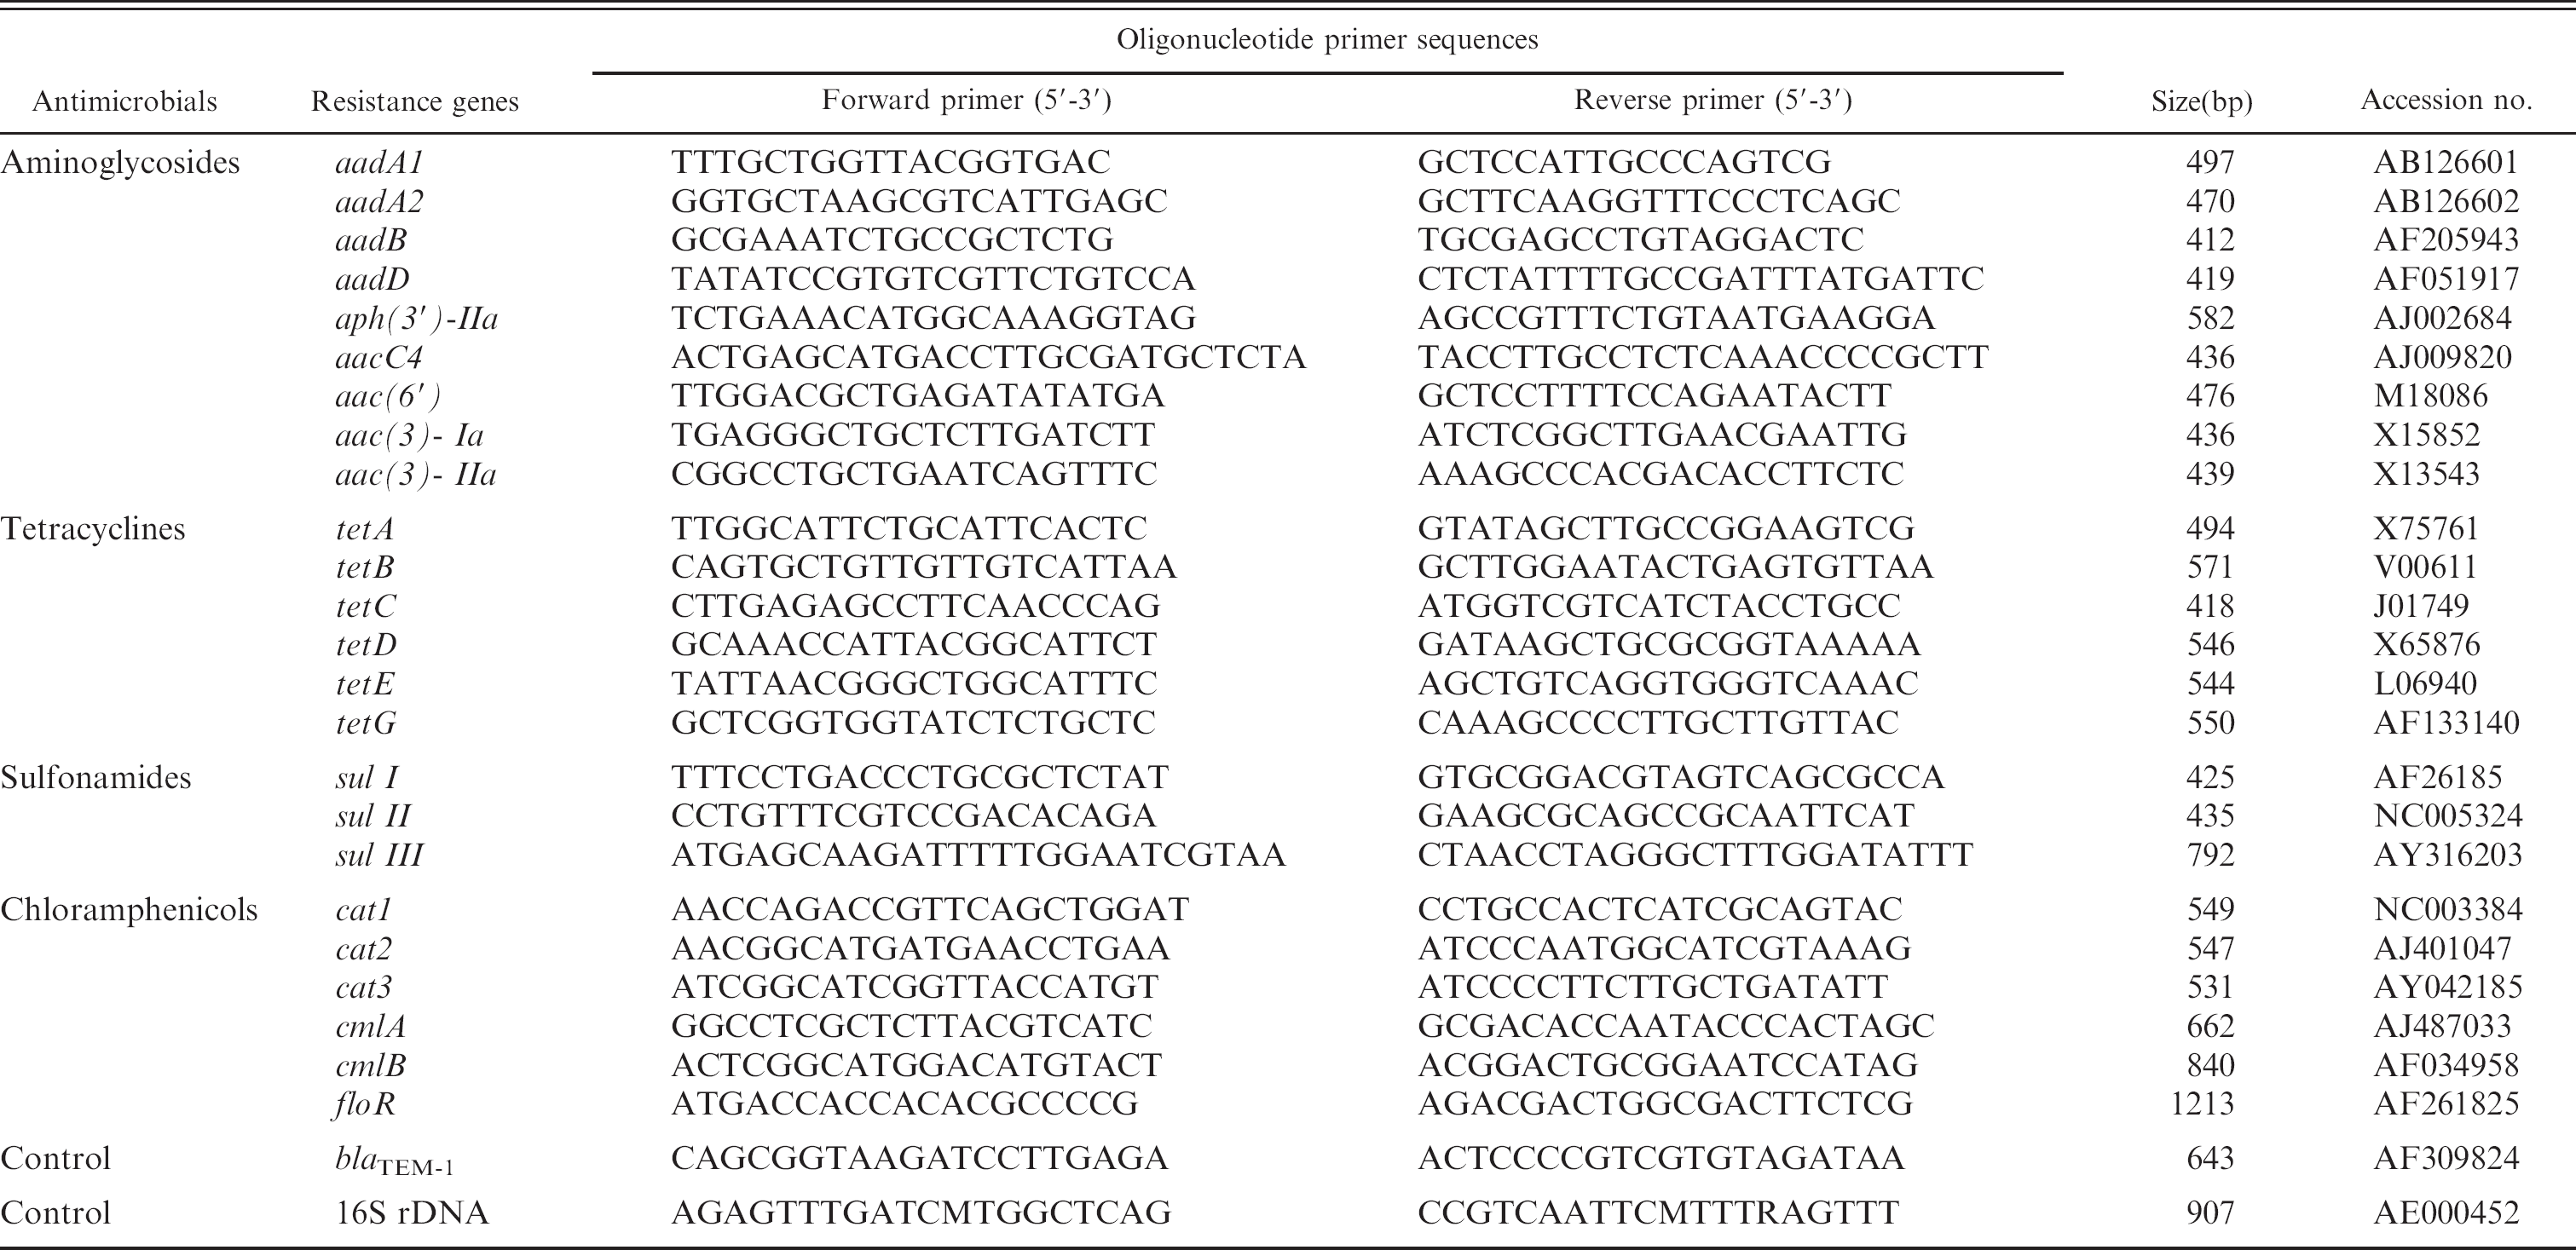
Twenty-four pairs of oligonucleotide primers (Table 1) were designed to target genes conferring resistance to aminoglycosides, tetracyclines, sulfonamides, and chloramphenicols. The primers were designed using the DNAStar PrimerSelect 5.0 software program e and were synthesized commercially. f The PCR was performed in 50 μl (total volume) of distilled H2O, as previously described, 13 containing 1XTaq polymerase buffer, f 2.5 mM MgCl2, 200 μM of each deoxynucleotide, 800 nM of each primer, 40 ng template DNA, and 2.5 U of Taq DNA polymerase. The thermal cycler conditions included denaturation at 95°C for 5 minutes, followed by 35 cycles of 94°C for 30 seconds, 55°C for 30 sec, and 72°C for 30 sec, and a final 10-min extension at 72°C.
All PCR products were purified with the QIAquick PCR Purification kit g according to the manufacturer's instructions and were analyzed for nucleotide sequence. f The resulting sequence data were compared with data in the GenBank database by using BLAST at the National Center for Biotechnology Information Web site (http://www.ncbi.nlm.nih.gov/).
Microarray construction and postprocessing
The purified PCR products were diluted to a final concentration of 100 ng/μl in printing buffer (100 mM Na2HPO4, 200 mM NaCl, 0.01% sodium dodecyl sulfate [SDS]; pH ∼ 11), heat denatured for 5 min at 95°C using a thermal cycler, and cooled to 4°C. For printing, 10 μl of each sample was then transferred to a 384-well microplate. DNA samples were arrayed with 220 μm diameter pins at a spacing distance of 1,000 μm on silane-coated (amine) 25 × 75-mm glass slides h using a MicroGrid Compact robotic printer i at 25°C with 65% relative humidity. All 64 probes were arranged as a matrix of 8 rows × 8 columns, and each sample was printed as 4 replicate spots within each array.
DNA microarrays were rehydrated over a 60°C water bath for 30 sec and dried on a heating block at 80°C for 10 sec. The target DNA on the microarrays was fixed for 10 min by ultraviolet cross-linking at 254 nm wavelength in an UVItec Crosslinker CL-508. j The glass slides were then treated with 0.2% SDS for 1 min, washed with ddH2O twice for 2 min each time, air dried at room temperature, and stored dry in the dark at room temperature.
Preparation of labeled DNA
Two methods were used to fluorescently label DNA. To detect the specificity and sensitivity of the microarray, 11 probes of antimicrobial resistance genes, control gene (bla TEM-1), and orientation gene (16S ribosomal DNA) were labeled by PCR amplification. Each reaction mixture (50 μl) was composed of 1 × Taq polymerase buffer f ; 2.5 mM MgCl2; 200 μM dATP, dTTP, and dGTP; 100 μM dCTP; 50 μM Cy3-dCTP k ; 800 nM each primer; 40 ng of template DNA; and 2.5 U of DNA polymerase. The thermal cycler conditions were 5 min of denaturation at 95°C, followed by 35 cycles of 94°C for 30 sec, 55°C for 30 sec, and 72°C for 30 sec; and a final 10-min extension time at 72°C. For detecting antimicrobial resistance genes in 30 Salmonella isolates, a direct-labeling procedure was used. Each 50-μl labeling reaction mixture contained 40 ng to 2.5 μg of denatured genomic DNA; 1.5 μg of random hexamers l ; 1 × EcoPol buffer (10 mM Tris-HCl (pH 7.5), 5 mM MgCl2, 7.5 mM dithiothreitol); 200 μM dATP, dTTP, and dGTP; 100 μM dCTP; 50 μM Cy3-dCTP k ; 2.5 mM dithiothreitol; and 10 U of the large Klenow fragment of DNA polymerase I. m The reaction mixture was incubated at 37°C for 2 hr, heat treated in a 100°C heating block for 3 min, and chilled on ice. Labeled DNA probes were purified using a QIAquick PCR purification column in the dark according to the manufacturer's instructions, g resuspended in sterile water, and quantified by spectrophotometry.
Microarray hybridization
The slides were incubated at 44°C for 2 hr in the prehybridization solution (3.5 × SSC; 0.2% SDS; 1% herring sperm DNA m ) to block nonspecific binding of the probe. The slides were rinsed 5 times in ddH2O at room temperature and twice in isopropanol before being dried using compressed nitrogen. The labeled DNA probe was denatured for 5 min at 95°C with a thermal cycler, cooled to 4°C, and mixed with hybridization buffer (4 μl of ddH2O; 7.5 μl of 20 × SSC; 2.5 μl of SDS; 1 μl of 10 mg of herring sperm DNA per milliliter; and 15 μl of formamide n ). The 30-μl total volume was hybridized to the microarray, covered with a coverslip, and put into a waterproof slide chamber. Hybridization was carried out for 0.5 to 24 hr. For experiments determining the effect of temperature on signal intensity, hybridization was carried out at 44, 48, 52, 56, 60, 64, and 68°C. After hybridization, the microarrays were washed with 1 × SSC + 0.1% SDS, 0.1 × SSC + 0.1% SDS, and 0.1 × SSC for 5 min each at room temperature and dried at room temperature in the dark.
Array scanning and quantitative analysis of hybridization signals
Microarrays were initially scanned at a resolution of 50 μm to obtain a quick display image and then at 10 μm with the scanning laser non-confocal fluorescence microscope GenePix™ Personal 4100A System. o The emitted fluorescent signal was detected by a photomultiplier tube (PMT) at 532 nm (Cy3). The laser power was 90%, and the PMT gain was 85%.
The scanned image displays were saved as 16-bit TIFF files, and transferred to GenePix pro 5.0 software o for subsequent analysis. GenePix was used to calculate the median pixel intensity of each hybridization spot and to subtract the median local background fluorescence. When the signal-to-noise ratio (S/N) was ≥1.5 or when the median pixel intensity ≥1000, a spot was scored as positive. The threshold of testing antimicrobial resistance genes was defined as follows for a total of 4 repeated spots of a resistance gene: 1) if 3 or more spots were positive, the result of antimicrobial resistance gene in bacteria was considered positive (+); 2) if 2 spots were positive, the result was considered ambiguous (+/-), and the test was repeated; and 3) if 1 or no spot was positive, the result was considered negative (-).
Primer sequences and related information.
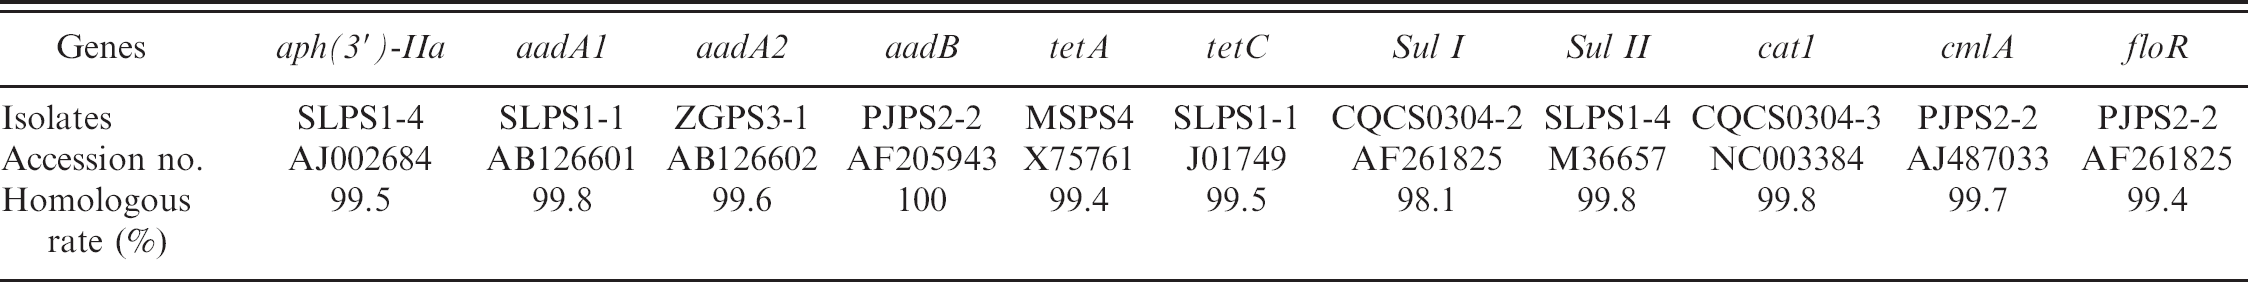
Comparison of PCR products and antimicrobial resistance gene sequences from Genbank.
Results
Antimicrobial resistance genes for microarray construction
Eleven resistance genes were characterized by PCR and DNA sequencing analysis, including 4 aminoglycoside resistance genes (aph(3′)-IIa, aadA1, aadA2, and aadB), 2 tetracycline resistance genes (tetA and tetC), 2 sulfonamide resistance genes (sul I and sul II), and 3 chloramphenicol resistance genes (cat1, cmlA, and floR). The sequence identity of each gene, compared with GenBank sequences, was very high (≥98.1%) (Table 2). Therefore, all 11 genes were used to construct the DNA microarray; bla TEM-1 was used as the positive control and 16s rDNA as orientation.
Hybridization parameters of microarray
Arrayed DNA that was rehydrated at 60°C for 30 seconds, in contrast to DNA that received was not rehydrated, gave the highest and most reproducible signal intensities after microarray hybridization. PCR-generated tetA DNA was prepared for array deposition in printing buffer at various concentrations and rehydrated at 60°C for 30 seconds before hybridization. No substantial difference in hybridization signal intensities was observed when the DNA concentration was greater than 100 ng/μl. Therefore, a target DNA concentration of 100 ng/μl was used for microarray construction in later experiments. Hybridization signal of a certain probe hybridized to its cognate gene was observed at temperatures from 44 to 68°C. The optimal hybridization temperature varied from 48 to 56°C according to the DNA probe (Fig. 1). An average temperature of 52°C was therefore used as hybridization temperature in later experiments. The effect of hybridization time from 0.5 to 24 hours on signal intensity was also tested by using tetA probe hybridized to the array. Hybridization signal was not saturated in 3 hours, but saturation was evident in 6 hours, indicating that a hybridization time of 6 hours was optimal.
Validation of microarray
To determine the specificity of microarray hybridization, all of the 11 labeled resistance genes were hybridized to the microarray. In most cases there was a one-to-one correspondence for hybridization signal to respective target, orientation gene, and positive control gene spots. There was minor cross-hybridization between aadA1 and aadA2 (Fig. 1). However, the cross-hybridization S/N was 0.68 (less than the threshold of 1.5), and the median pixel intensity was 835 (less than the threshold of 1,000). Therefore, the cross-hybridization of aadA1 and aadA2 was scored as negative. The analytic sensitivity of microarray hybridization was examined at probe concentrations from 3 pg/μl to 24,000 pg/μl by using tetA probe. The sensitivity was 3 pg/μl, and the optimal concentration of probe was 3600 pg/μl. For detecting the resistance gene(s) in bacteria, the sensitivity of the microarray was 104 colony-forming units per milliliter.
Detection of antimicrobial resistance gene with microarray
The antimicrobial resistance genes of 30 Salmonella isolates were tested with the microarray. Twenty-eight isolates were identified as having at least one antimicrobial resistance gene. The following antimicrobial resistance genes were commonly present in the 30 Salmonella isolates: sul I (76.7%, 23/30), aph(3′)-IIa (60%, 18/30), tetC (60%, 18/30), cat1 (43.3%, 13/ 30), tetA (40%, 12/30) and aadA1 (36.7%, 11/30). Multiple antimicrobial resistance genes belonging to same category of antimicrobials were detected in some isolates. For example, aph(3′)-IIa, aadA1, and aadB were detected in 4 aminoglycoside-resistant isolates (SLPS2-2, WJPS3-3, CDPS1, NJPS1); aph(3′)-IIa, aadA2, and aadB were detected in 3 aminoglycoside-resistant isolates (MSPS4, MSPS6, MSPS8); tetA and tetC were detected in 8 tetracycline-resistant isolates (ZGPS3-1, MSPS4, MSPS6, MSPS8, PJPS2-2, CQCS0304-2, BSCS0303-2, NJPS4); sul I and sul II were detected in 4 sulfonamide-resistant isolates (SLPS1-4, CQCS0304-3, SLCS0303-5, MYPS1); and cat1, cmlA, and floR were detected in 2 chloramphenicol-resistant isolates (PJPS2-2 and NJPS1). In addition, floR was detected in all 6 florfenicol-resistant Salmonella isolates (ZGPS4-1, PJPS2-2, CQCS0304-2, SLCS0303-2, NJPS1, NJPS4). Two remaining isolates did not hybridize to any of the resistance genes presented on the array (Table 3). Further testing by PCR determined that this failure to hybridize in the microarray was because of the absence of any corresponding resistance gene in the 2 bacterial isolates. The detection results of antimicrobial resistance genes of every isolate were further confirmed to be correct by PCR.
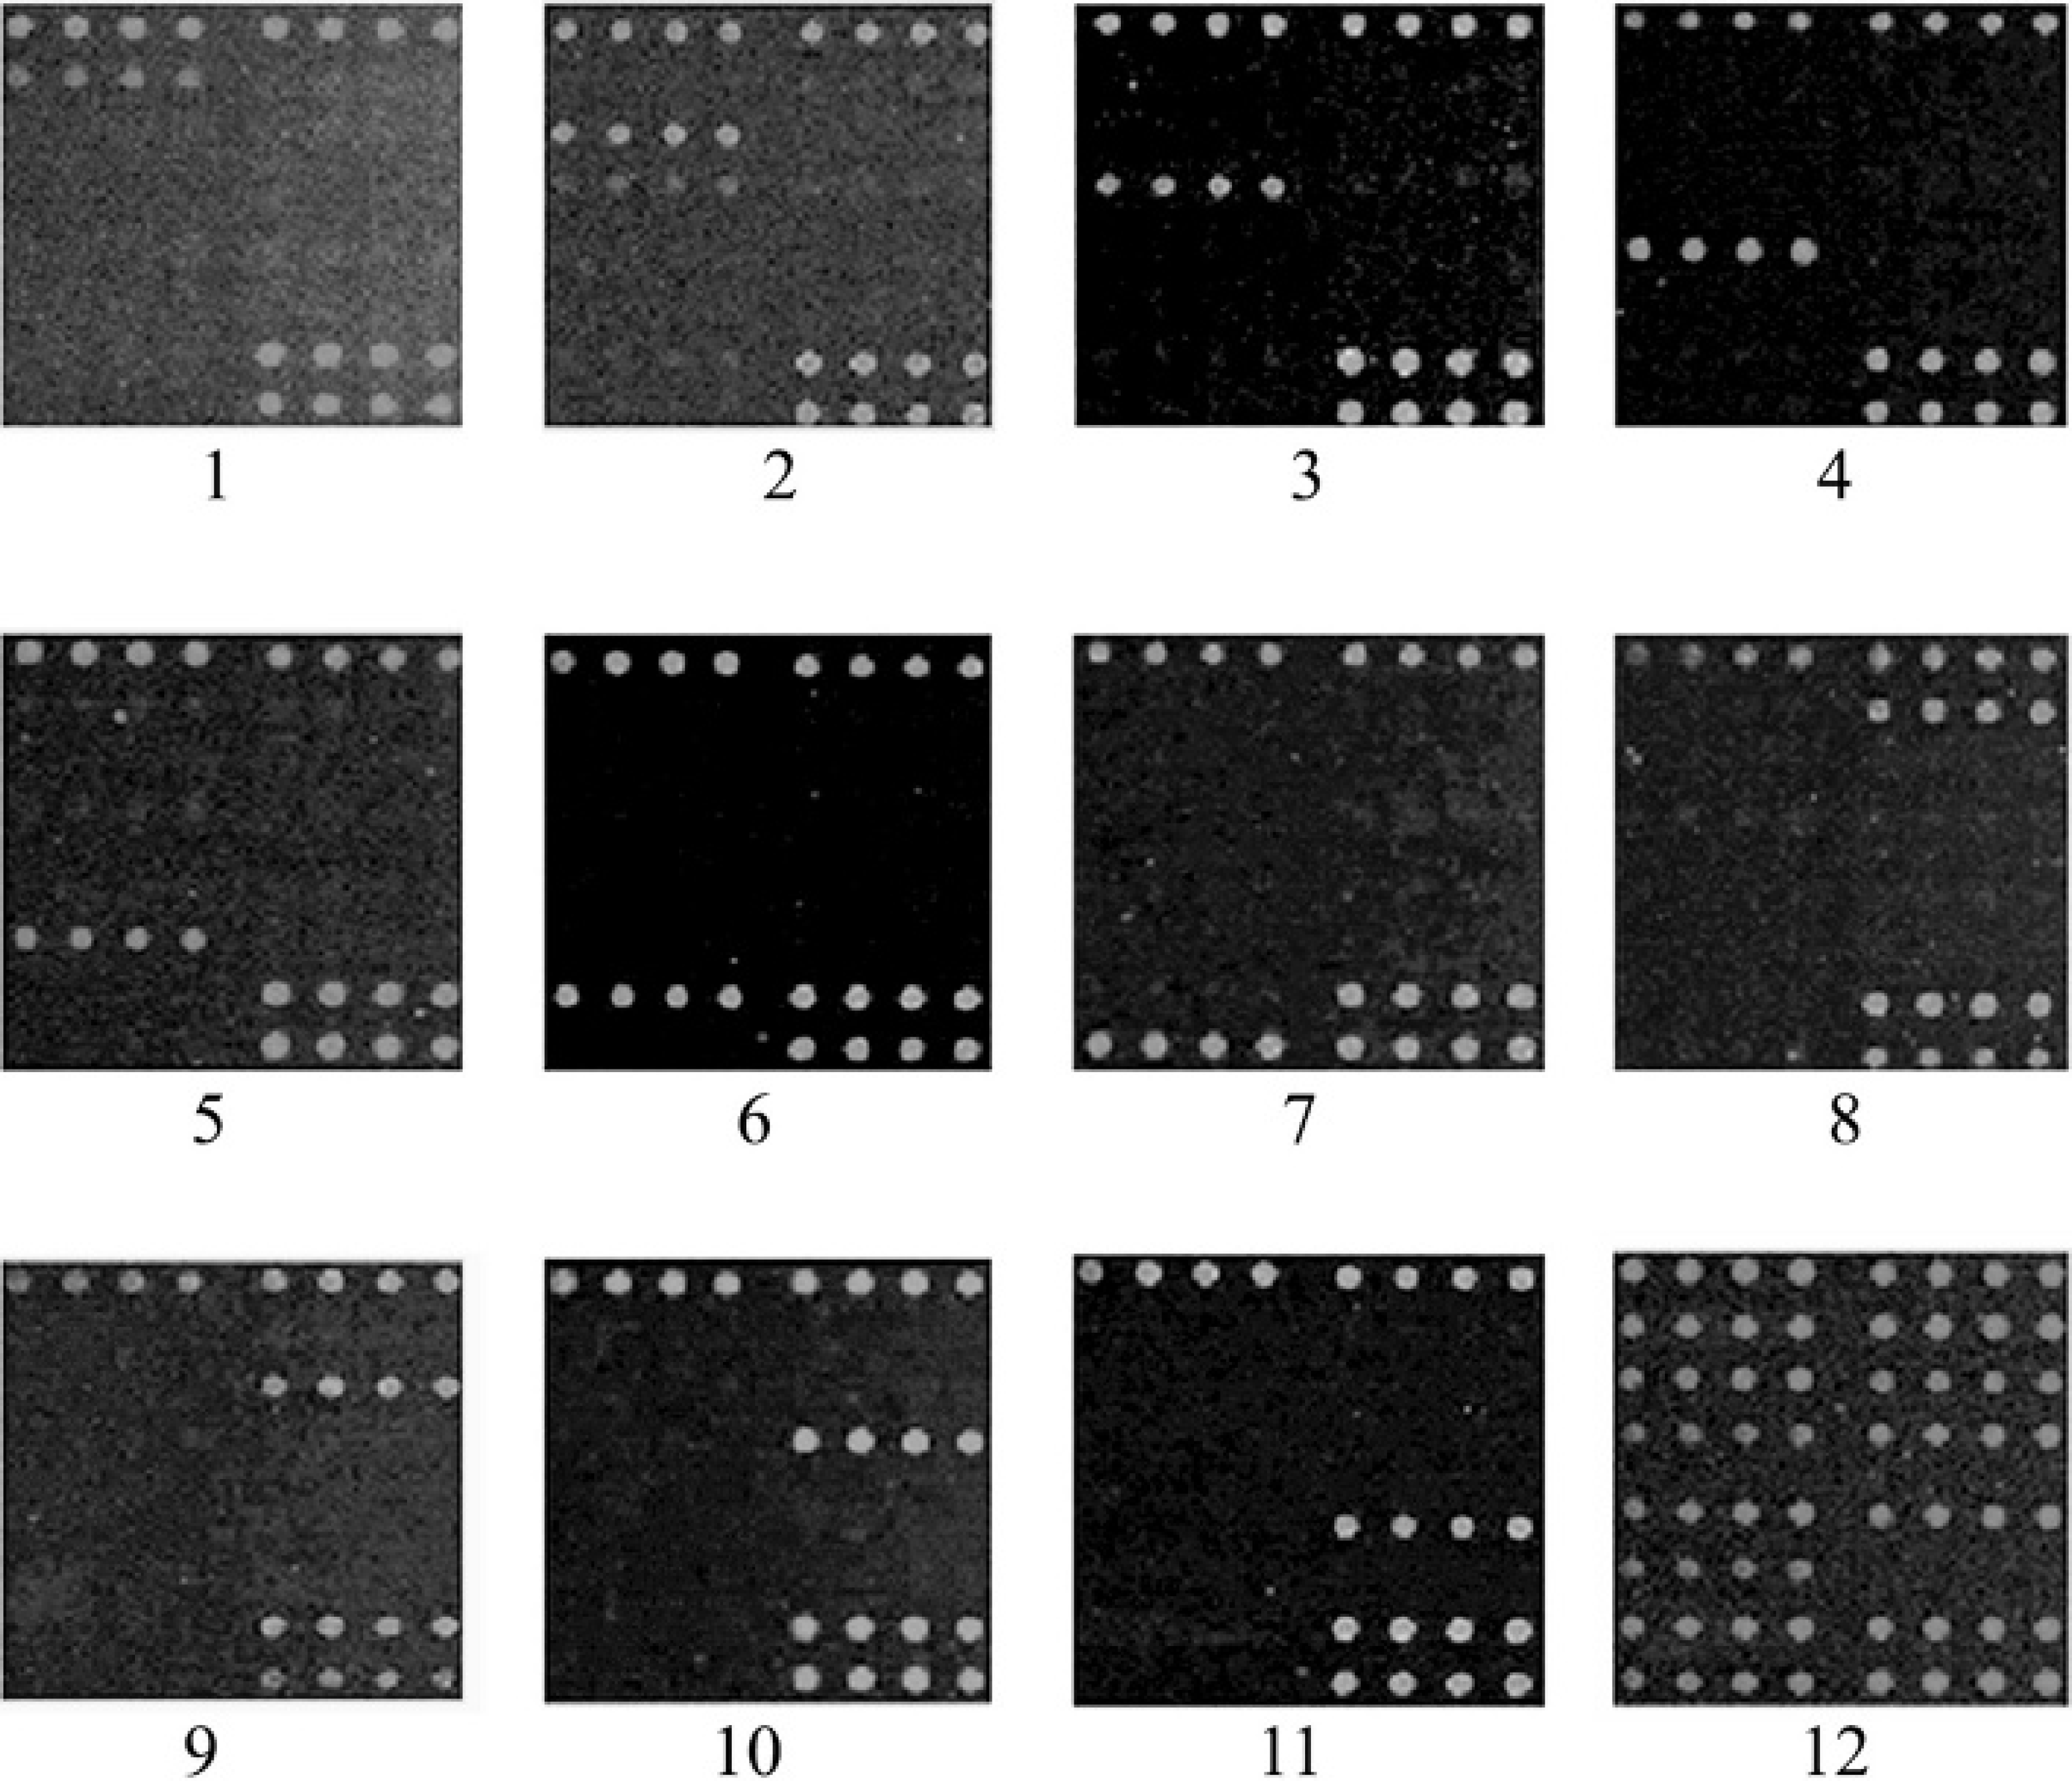
Hybridization results illustrating specificity of antimicrobial resistance genes. Targets were printed in quadruplicate in 2 columns. From top to bottom of each array, the left column included 16S rDNA (orientation gene), aph(3′)-IIa, aadA1, aadA2, aadB, sul I, sul II, tetA. The right column included 16S rDNA (orientation gene), tetC, cat1, cmlA, floR, printing buffer (blank control), bla TEM-1(positive control), and 16S rDNA (orientation gene). The microphotographs from 1 to 11 showed that labeled gene of aph(3′)-IIa (48°C), aadA1 (52°C), aadA2 (52°C), aadB (56°C), sul II (52°C), sul II (52°C), tetA (52°C), tetC (56°C), cat1 (56°C), cmlA (52°C), and floR (52°C) specifically hybridized with microarrays, respectively, together with 16S rDNA and bla TEM-1, at the optimal temperature; the microphotograph 12 showed that all labeled genes hybridized with microarrays (52°C).
Discussion
DNA microarrays have been used previously to detect resistance genes in bacteria. 4,10,16,20,23 Several types of DNA templates can be used to construct microarray, depending on the intended use. For example, short oligonucleotide probes can be used to detect single nucleotide polymorphisms 1 , long oligonucleotide probes can be used to detect sequences that contain a few mismatches, and PCR probes can be used to detect moderately divergent genes. Call et al. 4 found that DNA microarray of tetracycline resistance genes with short oligonucleotide probes (25-mer) was insensitive to low-copy-number genes, so they constructed microarrays with 550-bp PCR products that could identify 17 tetracycline resistance genes. In the present study, PCR products were also used to construct microarrays that could identify 11 genes that confer resistance to aminoglycosides, sulfonamides, tetracyclines, and floramphenicols.
In this study, aadA1 and aadA2 cross-hybridized to each other to a minor extent. It was later found that the 2 DNA sequences were 89.4% homologous. This phenomenon was also observed by other workers 8 who determined that targets containing less than 80% sequence identity relative to the hybridization probe sequences showed cross-reactivities ranging from 0.6% to 12%; targets containing greater than 80% identity showed higher cross-reactivities (26% to 57%). 8 Although cross-hybridization or weak microarray signals present a challenge to determining positive spots, it was determined in the present study that a positive detection threshold of S/N ≥1.5 or median pixel intensity ≥1,000 was sufficient to yield results with high specificity. These results corroborate those of other workers who suggested that signals lower than 1.5-fold above the median background (S/N <1.5) were generally unreliable. 21
Detection results of resistance * to antimicrobials (phenotype) and resistance genes (genotype) of 30 isolates.
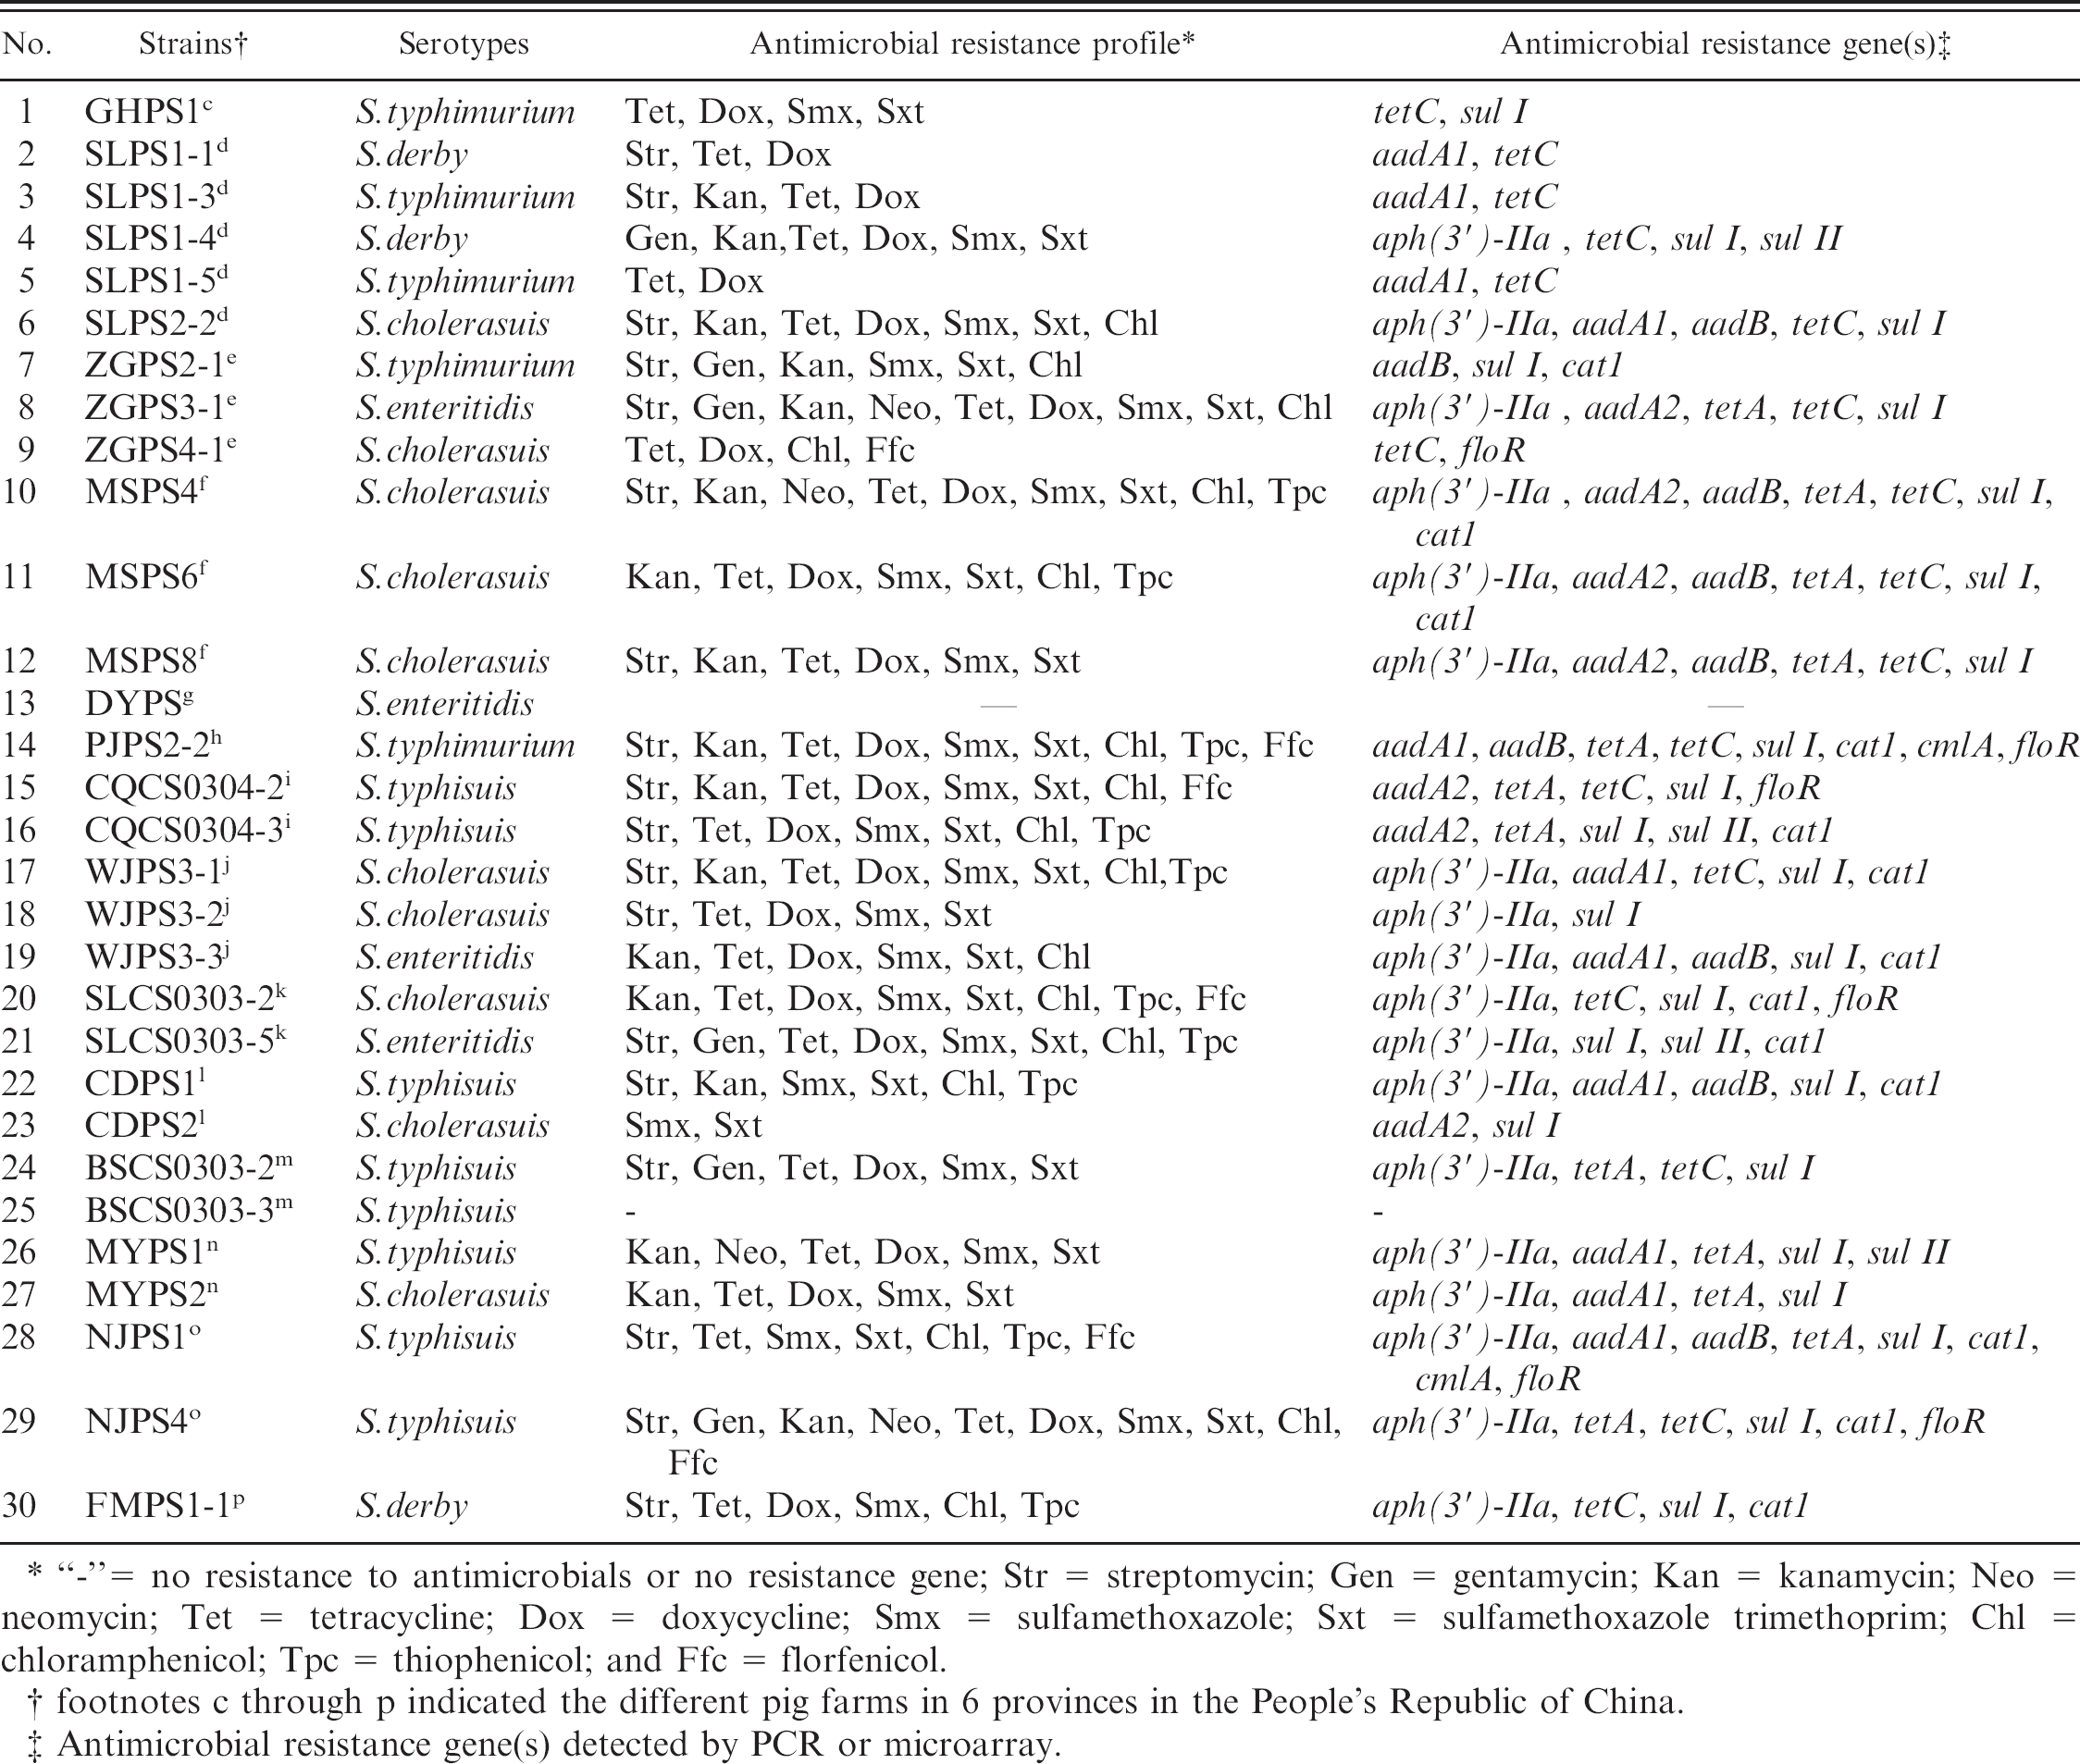
“-”= no resistance to antimicrobials or no resistance gene; Str = streptomycin; Gen = gentamycin; Kan = kanamycin; Neo = neomycin; Tet = tetracycline; Dox = doxycycline; Smx = sulfamethoxazole; Sxt = sulfamethoxazole trimethoprim; Chl = chloramphenicol; Tpc = thiophenicol; and Ffc = florfenicol.
footnotes c through p indicated the different pig farms in 6 provinces in the People's Republic of China.
Antimicrobial resistance gene(s) detected by PCR or microarray.
Compared with phenotypic testing, PCR and microarrays have the advantage of detecting the presence of antimicrobial resistance genes that are not phenotypically expressed in vitro. 5,20 In the present study, antimicrobial resistance genes of 30 Salmonella isolates in China were detected. It was found that SLPS1-5 and CDPS2 Salmonella isolates did not phenotypically express resistance to amino-glycosides, but the aadA1 gene was present in SLPS1-5 and the aadA2 gene was present in CDPS2. Maynard et al. 14 also found that two E. coli isolates harboring the aph(3′)- Ia gene, which confers resistance to kanamycin and neomycin, were susceptible to kanamycin and neomycin. Thus, the present results and those of Maynard et al. indicate that some antimicrobial resistance genes are “silent” in bacteria in vitro; however, these silent genes can spread to other bacteria or turn on in vivo, especially under antimicrobial pressure. Sulfonamide resistance genes were detected in all isolates exhibiting the sulfonamide phenotype. However, no tetracycline or chloramphenicol resistance genes were present in some isolates exhibiting tetracycline or chloramphenicol resistance. The most likely reason is the existence in these bacteria of alternative resistance genes not included in the microarray. Two isolates (SLPS1-1 and SLPS1-3) cultured from pigs in a farm within a 1-year span displayed very similar antimicrobial resistance phenotypes and the same array-derived genotypes. However, the 2 other isolates (SLPS1-4 and SLPS1-5) obtained from pigs in the same farm over a 2-year span displayed different antimicrobial resistance phenotypes or genotypes compared with the previous isolates (SLPS1-1 and SLPS1-3). Thus, it appears that detecting resistance genes can help trace the origin of resistance genes as well as their geographical distribution, diversity, and temporal variation. Previous studies have shown that neither chloramphenicol acetyltransferase (cat) genes nor nonenzymatic chloramphenicol resistance (cmlA) genes provide resistance to florfenicol. 2,7 Conversely, flo-mediated resistance to chloramphenicols also confers resistance to florfenicol. 3 In the present study, floR was detected in all 6 florfenicol-resistant Salmonella isolates, in addition to either or both cat1 and cmlA.
The microarray technique developed in the present study proved be an efficient method that allows for rapid detection (<12 hours) and identification of resistance genes in Salmonella isolates.
Acknowledgment
This research was supported by grant 2002BA514A-17-11 of the National 10th Five-year Key Technologies R&D Program in China.
Footnotes
a.
Difco Laboratories, Detroit, MI.
b.
BioMerieux, Marcy, France.
c.
Chengdu Institute of Biological Products, Chengdu, China.
d.
China Institute of Veterinary Drug Control, Beijing, China.
e.
DNASTAR, Inc., Madison, WI.
f.
Shanghai Sangon Biological Engineering Technology and Service Co., Ltd., Shanghai, China.
g.
Qiagen, Valencia, CA.
h.
Shanghai Baio Technology Co., Ltd., Shanghai, China.
i.
BioRobotics Ltd., Cambridge, UK.
j.
UVItec Ltd., Cambridge, UK.
k.
Amersham Pharmacia Biotech, Piscataway, NJ.
l.
Gibco BRL, Gaithersburg, MD.
m.
Promega, Madison, WI.
n.
Sigma Chemical Co., St. Louis, Mo.
o.
Axon Instruments, Inc., Union City, CA.