
Abstract
Background:
Diabetes mellitus is a disease associated with several complications in its acute and chronic stages.
Objective:
The aim of the study was to determine the treatment-associated changes in optic nerve sheath diameter in patients admitted to the emergency department due to one of the acute hyperglycemic complications of diabetes mellitus.
Materials and method:
Diabetic patients with serum glucose levels of 250 mg/dL or higher were included in the study. Healthy volunteers were included in the control group. Optic nerve sheath diameter was measured at 0th hour and at the end of the second hour. Blood samples were collected simultaneously with optic nerve sheath diameter measurements.
Results:
The study included 100 individuals. Group 1 included 50 patients and Group 2 included 50 healthy adults. Optic nerve sheath diameter was 4.5 ± 0.4 mm in Group 1 and 4.4 ± 0.5 mm in Group 2 in 0th hour, and no statistical difference was found between the groups (p = 0.162). In Group 1, optic nerve sheath diameter increased 0.6 ± 0.4 mm after the treatment. Of the patients in Group 1, 22 (44%) patients with diabetic ketoacidosis or hyperosmolar hyperglycemic state were assigned to Group 1A and 28 (56%) patients with isolated hyperglycemia were assigned to Group 1B. There was not a difference between the pre- and post-treatment optic nerve sheath diameter values of the patients in Group 1A and Group 1B. Optic nerve sheath diameter was observed to enlarge after treatment. The difference in optic nerve sheath diameter was 0.6 ± 0.4 mm in Group 1A and 0.5 ± 0.4 mm in Group 1B (p = 0.294).
Conclusion:
Pre-treatment optic nerve sheath diameter values of the patients who were diagnosed with one of the acute hyperglycemic complications of diabetes mellitus are not different from healthy adults. Furthermore, optic nerve sheath diameter values do not change with the severity of the disease. However, optic nerve sheath diameter values change with treatment. For this reason, optic nerve sheath diameter can be used to following the development of brain edema.
Introduction
Diabetes mellitus (DM) is a disease that may develop many complications in acute and chronic period. Despite all advances in follow-up and treatment, diabetic emergencies may result in mortality. For this reason, there are currently many studies ongoing about the treatment and early diagnosis of the complications related to DM.1–3
Brain edema is a relatively common phenomenon associated with a large number of etiological factors. Brain edema describes the increase in brain volume due to its increased water content. Ultimately, the increased brain volume, in the rigid skull, results in an increase in the intracranial pressure (ICP). The increase in ICP causes the cerebral perfusion pressure to decrease, leading to cerebral ischemia. The consequences of cerebral edema can be devastating and even fatal if not treated. 4
Brain edema due to treatment in emergency departments or during an inpatient hospital stay is the most important complication in DM patients and may result in mortality. Intracellular acidosis due to sodium bicarbonate given in treatment, excessive amounts of fluid administration, and the rapid reduction of blood osmolarity due to a rapid decline in glucose levels cause osmotic swelling, leading to brain edema. 5 Although it is more common in pediatric patients, brain edema may also occur in adult patients. 2 Therefore, recognition of acute complications in the emergency departments gains importance because they are the healthcare facilities where the initial treatment is provided at firsthand.
Computerized tomography (CT) or magnetic resonance imaging (MRI) can be used to diagnose brain edema in hyperglycemic states. However, CT is associated with exposure to substantially high doses of radiation. MRI is time-consuming and it is not always available in emergency department. Furthermore, both CT and MRI require the transport of critical patients to other facilities. Invasive ICP monitoring is the gold standard to diagnose any rise in ICP. However, invasive ICP monitoring may lead to complications such as hemorrhage or bacterial colonization and this technique may not be applicable to all patients with increased ICP. Therefore, there is a need of noninvasive, simple, reproducible, and bedside method for ICP monitoring.6–10
There is also a need to limit the number of diagnostic tests due to the high patient inflow at emergency departments. Moreover, it is very important to accelerate the diagnosis and treatment processes in patients suffering from life-threatening disorders. Ultrasonography (USG) has become an integral part of the emergency care facilities because of being a fast, easy-to-learn, noninvasive, and reproducible method, which can be performed at bedside.9–11
Ocular USG has recently been a widely used method to measure the optic nerve sheath diameter (ONSD) to diagnose increase in ICP in traumatic and nontraumatic cranial events.12–14 USG was first introduced to use in order to detect iatrogenically developing cerebral edema in pediatric patients with diabetic ketoacidosis (DKA). 3
The aim of this study was to determine the treatment-associated changes in ONSD in adult patients diagnosed with one of the hyperglycemic acute complications of DM in the emergency department.
Materials and methods
This prospective study was conducted in emergency department of a tertiary hospital in the period between January 2016 and August 2018. This study included patients older than 18 years with DM or had recently been diagnosed with DM, presenting with one of the acute hyperglycemic complications of DM (isolated hyperglycemia, DKA, or hyperosmolar hyperglycemic state (HHS)).15–17 The healthy volunteers group without DM, whose number is same with study patients, whose capillary blood glucose is between 70 and 125 mg/dL, is included in the study as the control group. The volunteers who are the control group were taken to the study from 08 a.m. to 11 a.m. within five working days. ONSD measurements of the patients and healthy volunteers included in the study were performed just after capillary blood glucose measurement. Then, the blood samples were collected for laboratory studies. The emergency physician who would perform the ONSD measurement was blind to the laboratory tests results.
Patients who were admitted due to head trauma or who had a history of an intracranial event (cerebrovascular disease, subarachnoid hemorrhage, and central nervous system infection), brain tumor, or a history of ophthalmic surgery were excluded from the study.
A standardized data record form was created for the study before setting out the study. The patients’ age, gender, complaints at the time of admission, neurological examination findings, Glasgow Coma Scale scores, capillary blood glucose test results at the 0th and second hour, venous blood gas levels at the 0th and second hour (pH, PCO2, and HCO3 values), blood biochemistry test results (glucose, Na+, K+, and Cl− values), ONSD values of the right and left eyes which were measured with point-of-care ultrasound (POCUS), and the treatment (insulin or intravenous fluid) applied to the patients were recorded in the data record form.
The patients who met the inclusion criteria of the study were assigned to Group 1 and the healthy volunteers were assigned to Group 2 as the control group.
Group 1 patients were studied in three categories: DKA, HHS, and isolated hyperglycemia. Patients in Group 1 were divided into two subgroups as Group 1A and Group 1B. Group 1A included the patients with DKA or HHS and Group 1B included the patients with isolated hyperglycemia.
Group 1A included a group of patients with serum glucose levels of ⩾250 mg/dL, blood pH values of ⩽7.30, serum bicarbonate (
All patients received treatment in compliance with the treatment guidelines. Normal saline was given as the intravenous fluid therapy at the rate of 15–20 mL/kg/h in the first hour and it was completed to a total of 2 L in the second hour. Insulin treatment was given at an infusion rate of 0.1 U/kg/h intravenously through a separate venous line other than the one through which the fluid therapy was administered. At the end of first hour of treatment, for the patients who had a reduction in the blood glucose levels by more than 70 mg/dL and whose blood glucose level fell below 200 mg/dL, and also had a K+ level of <3.5 mEq/L in laboratory test results, insulin therapy was not administered in the second hour. None of the patients received sodium bicarbonate (NaHCO3), mannitol, or 3% saline during the treatment.15–17
Statistical analysis
The data collected in the study were entered in SPSS 25 statistical software program, and then, the statistical analyses were performed. Age, gender, and the complaints at the time of the admission were accepted as independent variables. The serum glucose levels at 0th and second hour and the results of blood gas analysis and biochemistry tests were evaluated as dependent variables.
Histogram charts and the Kolmogorov–Smirnov test were used for testing whether the variables conform to a normal distribution. Mean and standard deviation values were used when presenting descriptive analyses. When normally distributed data were analyzed, student’s t-test was used for comparing two independent groups, whereas the paired samples t-test was used for comparing the dependent groups. Bivariate Pearson correlations test was used for testing correlations. A p value of <0.05 was considered statistically significant.
The mean ONSD values of the right and the left eyes were included in the statistical analysis. The pre-treatment and post-treatment laboratory test values and the ONSD measurements were compared between the groups. First, Group 1 and Group 2 were compared to each other. Then, Group 1A and Group 1B were compared. In addition, the correlations of the pre-treatment and post-treatment alterations of ONSD with those in the laboratory test results were tested.
Ocular ultrasound technique
ONSD was performed by a trained emergency physician. The patient was placed in the supine position. While the patient’s eyes were closed, a thin layer of gel was applied to both of the eyelids. The optic nerve was visualized by the 7.5 MHz linear probe of the ultrasound device (Mindray Medical, Germany). First, both eyes were scanned in vertical and horizontal planes through the eyelid, and then, the optic disk of the eye was viewed. The ONSD measurements were performed in transverse and sagittal planes by using the width of the hypoechoic area which represents the optic nerve sheath, 3 mm proximal to the optic disk, as references (Figure 1). ONSD was measured on the right and on the left for three times each, and then, the mean values were calculated for each side.
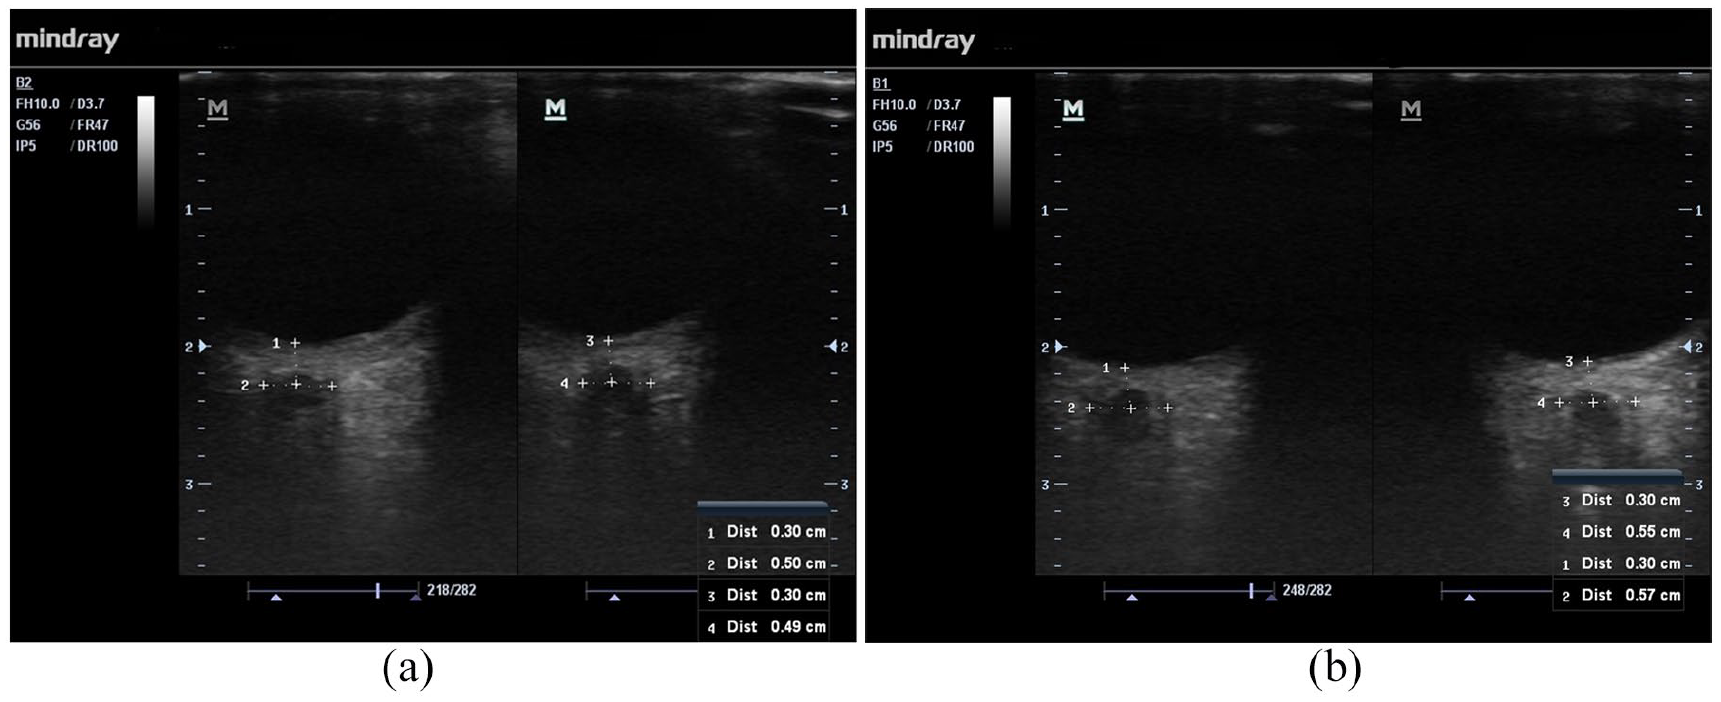
The illustration of ONSD measurement. The ONSD measurements were performed in transverse and sagittal planes by using the width of the hypoechoic area, which represents the optic nerve sheath, 3 mm proximal to the optic disk, as references. In this case, a 57-year-old male patient with a history of DM was admitted to the emergency department with complaint of fatigue. The blood glucose value of the patient was 376 mg/dL at the 0th hour and 242 mg/dL at the second hour. The patient was given 2000 mL of normal saline within 2 h for fluid therapy. At 0th hour, the patient’s right ONSD was measured as 5.0 mm and left ONSD was measured as 4.9 mm; at the end of the second hour, the right ONSD was measured as 5.5 mm and the left ONSD was measured as 5.7 mm.
Results
A total of 100 individuals were included in the study. Of them, 50 patients were included in Group 1 and 50 healthy adults were included in Group 2. The mean age was 59.44 ± 16.42 years in Group 1 and 58.5 ± 18.148 years in Group 2. There were 25 (50%) males and 25 (50%) females in Group 1, and 23 (46%) males and 27 (54%) females in Group 2. There were no differences between gender distribution (p = 0.841) and the mean age (p = 0.139) between Group 1 and Group 2.
The osmolarity levels in the 0th hour blood samples of the patients were 299 ± 12 mOsm/kg in Group 1 and 286 ± 13 mOsm/kg in Group 2. There was a significant difference between these two groups in blood osmolarity levels at hour 0 (p < 0.001), but there was not a difference between the measured ONSD values (p = 0.162). The patients were given a mean amount of 1729 ± 200 mL fluid therapy in 2 h following their admission. There was a statistically significant difference between the blood osmolarity levels in Group 1 and Group 2 at the end of the second hour. There was also a statistically significant difference in ONSD values between these two groups. In Group 1, ONSD found out to be increased at the end of the second hour (Table 1).
Osmolarity and ONSD values of Group 1 and Group 2 at 0th and second hours.
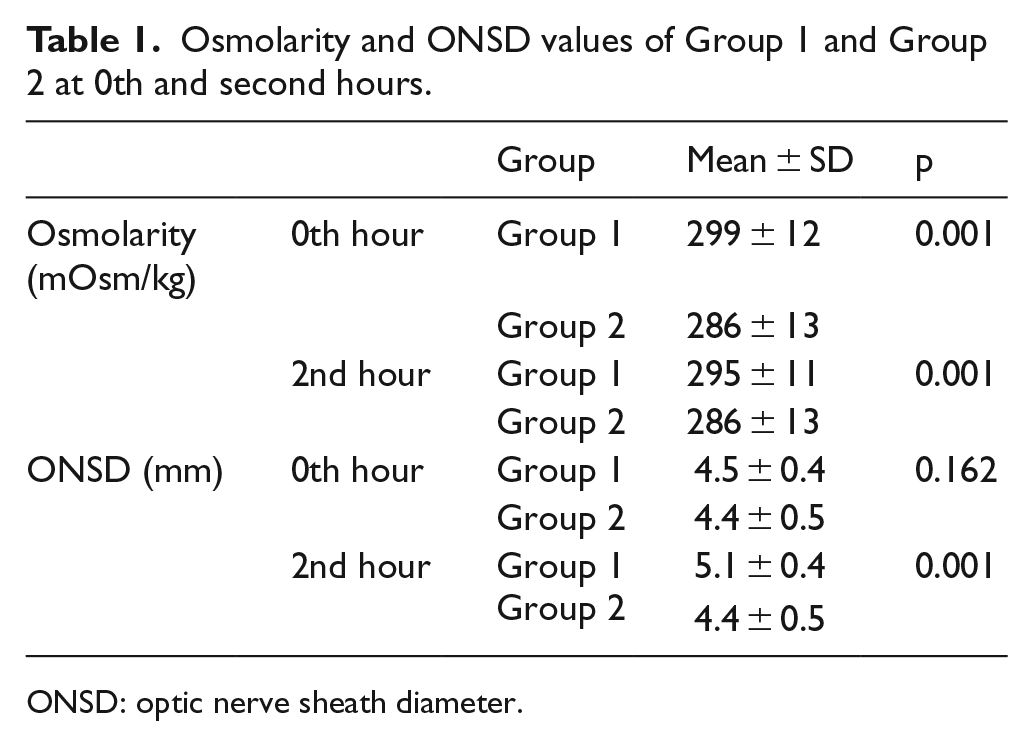
ONSD: optic nerve sheath diameter.
The examination of the biochemistry test results of the patients revealed that the pre-treatment and post-treatment values of glucose, K+, Na+, and the osmolarity levels were significantly different in Group 1 (p > 0.005); however, the posttreatment pH, CO2, and HCO3 levels did not significantly change. There was a statistically significant change in ONSD values before and after treatment (p < 0.001). The difference between the pre-treatment and post-treatment ONSD values was 0.6 ± 0.4 mm (p < 0.001; Tables 2 and 3).
Changes in laboratory and ONSD values after treatment in Group 1.
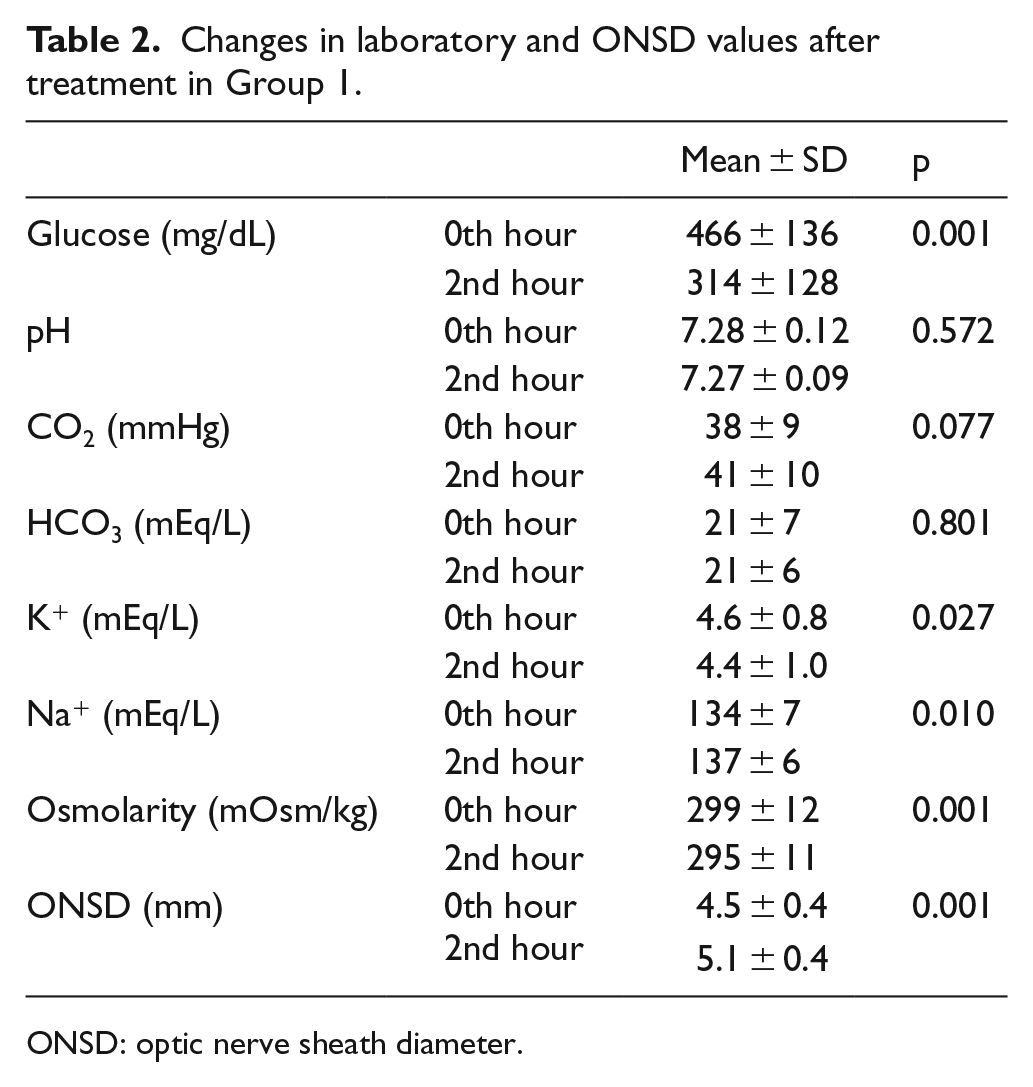
ONSD: optic nerve sheath diameter.
Correlation of ONSD difference with difference in laboratory values before and after treatment.
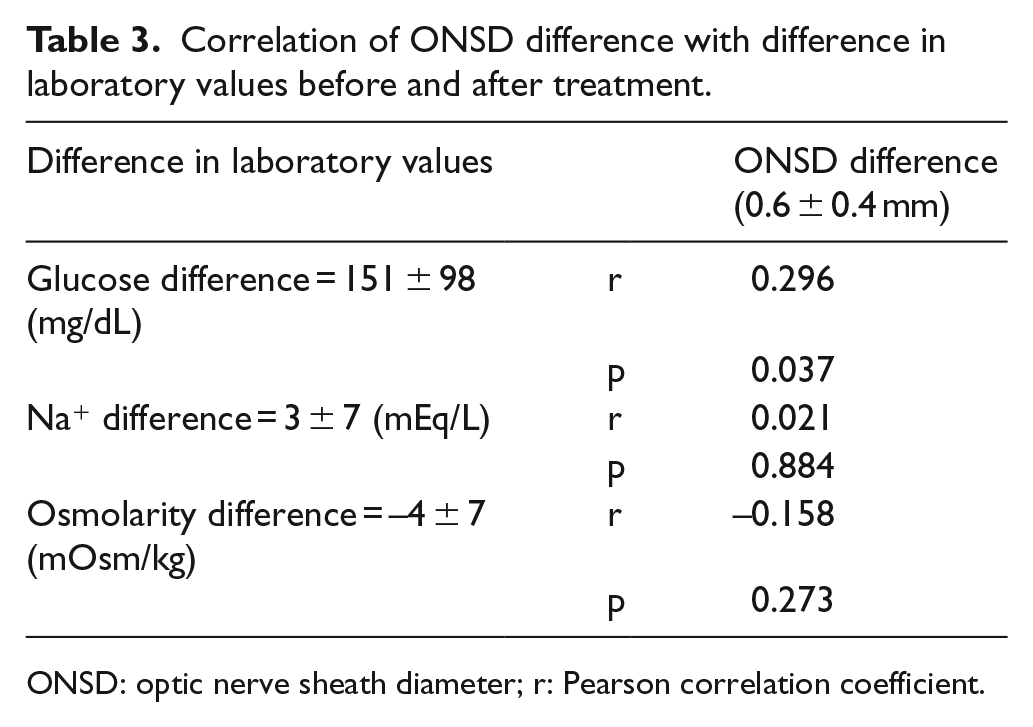
ONSD: optic nerve sheath diameter; r: Pearson correlation coefficient.
When the correlation was evaluated of pre- and post-treatment ONSD difference with pre- and post-treatment glucose, Na+ and osmolarity difference, a positive correlation was demonstrated only between the ONSD difference and glucose difference. There was no correlation between ONSD difference, Na+ difference, and osmolarity difference (Table 3).
Of the patients in Group 1, 22 (44%) patients were assigned to Group 1A and 28 (56%) patients were assigned to Group 1B. Between Group 1A and Group 1B, there were differences in the levels of glucose, pH, CO2, HCO3, and osmolarity (p < 0.05), but there was no difference between the ONSD values (p = 0.799; Table 4).
Comparison of the 0th hour laboratory and ONSD values of Group 1A and Group 1B patients.
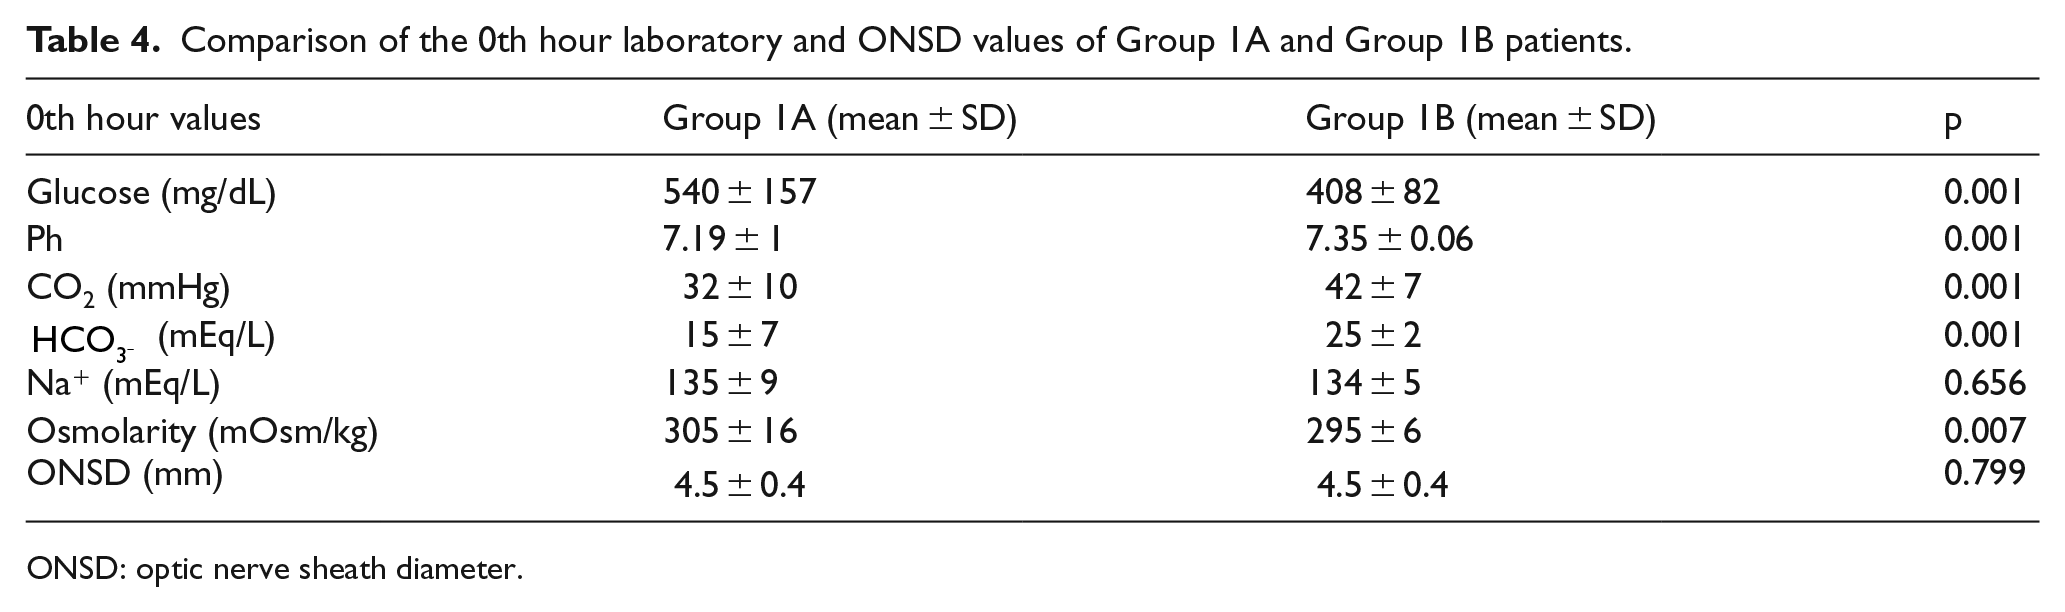
ONSD: optic nerve sheath diameter.
The amount of fluid administered to the patients in 2 h was 1786 ± 165 mL in Group 1A, and it was 1684 ± 215 mL in Group 1B (p = 0.07). The pre- and post-treatment differences between the laboratory test results in Group 1A and Group 1B were similar except the pH difference (Table 5).
Differences in laboratory and ONSD values in Group 1A and Group 1B after treatment. Differences in laboratory values in Group 1A and Group 1B after treatment.
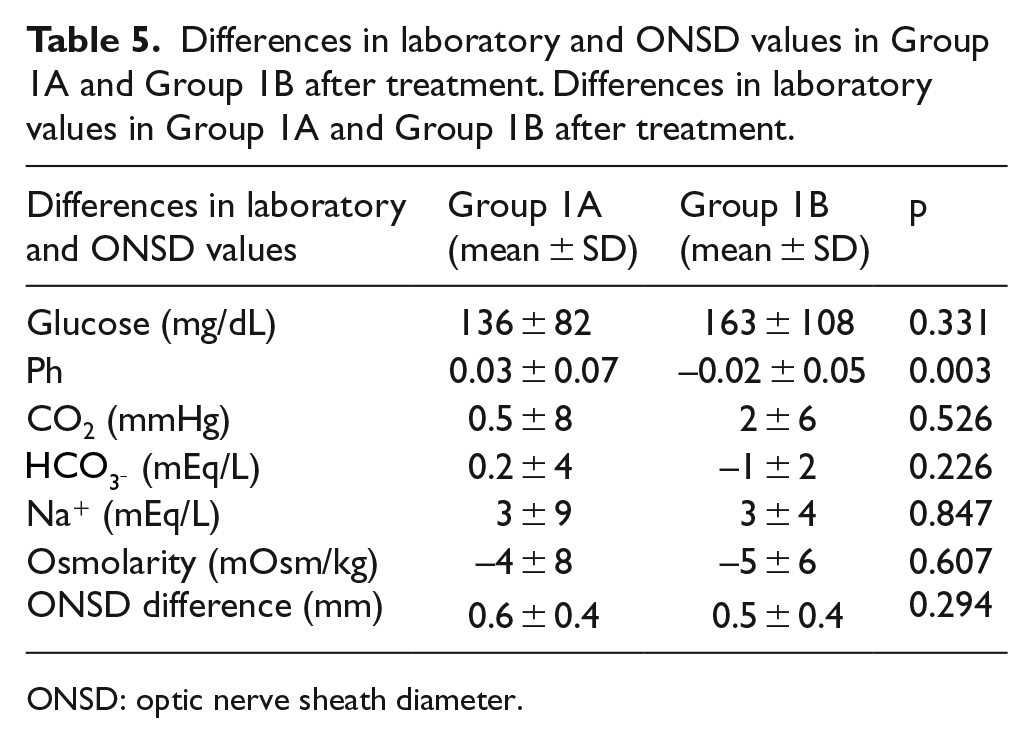
ONSD: optic nerve sheath diameter.
There was no difference between the pre- and post-treatment ONSD values of the patients in Group 1A and Group 1B. It was observed that ONSD was enlarged after treatment. After the treatment, ONSD was 5.2 ± 0.4 mm in Group 1A and 5.0 ± 0.5 mm in Group 1B. The ONSD difference was 0.6 ± 0.4 mm in Group 1A and 0.5 ± 0.4 cm in Group 1B (p = 0.294).
Discussion
The clinical findings of increased ICP due to brain edema are not specific. The clinical findings include headache, projectile vomiting, lethargy, altered sensorium, cranial nerve palsies, hypertension, bradycardia, altered breathing patterns, and eventually coma and death. 4 Therefore, early diagnosis of increased ICP is critical to prevent untoward consequences.
Noninvasive measurements of ONSD have recently been introduced to detect increased ICP. The normal ONSD values range from 3.7 to 5.0 mm in healthy adults.18–20 The cut-off value of ONSD was found out to be between 4.8 and 5.7 mm when compared with the values obtained in invasive monitoring of ICP.21,22 A study have reported that ONSD is 4.6 mm for women and 4.8 mm for men, and they have demonstrated that this cut-off value has high sensitivity and specificity in intracranial hypertension patients diagnosed with brain CT and MRI. 23 It has been reported that alterations in ONSD values occur in all events that may lead to a change in the ICP.24–28 In a study on patients with acute stroke, ONSD was found to be enlarged in the cranial CT images. In this study, ONSD was found to be 4.1 ± 0.5 mm in the control group and 5.4 ± 1.1 mm in the patients with pathological findings in the CT images. 12 In a study measuring ONSD with CT, ONSD was found to be 5.3 ± 1.1 mm in children with intracranial hemorrhage due to head trauma, and it was reported to be 4.1 ± 0.8 mm in the normal CT images of the patients. 14 In a study on ischemic stroke patients, ONSD was reported to be 5.4 ± 0.6 mm in the patient group and it was reported to be 4.2 ± 0.4 mm in the healthy volunteers. 27
The most important complication leading to mortality in DKA is brain edema and associated increase in the ICP. Recently, studies investigating the change of ONSD in the detection of brain edema in children with type 1 DM have been conducted.3,29 In a study in children with type 1 DM, patients were divided into three study groups: (1) well-controlled type 1 DM, (2) type 1 DM with hyperglycemia, and (3) type 1 DM with DKA. There was no difference identified between the ONSDs of these groups. 3 Another study investigated the change of ONSD by serial ONSD measurement during pediatric DKA treatment. In this study, it was observed that after the initiation of treatment, the ONSD showed a bell-shaped trajectory in the form of an increase in ONSD followed by a return to the baseline. 29 In another study investigating the risk of cerebral edema in children diagnosed with type 1 DM, ONSD (4.7 mm) measured in children with DKA at the onset of the disease was wider than non-DKA children (4.4 mm). In the same study, ONSD (4.3 mm) was found to be similar to non-DKA (4.4 mm) patients after at least 48 h of metabolic compensation in children with DKA. 30 A study on children with DKA reported no differences between the measurements performed in the first hour, eighth hour, and the 24th hour after the treatment. In this study, no brain edema was considered clinically in any patient. 31 In our study, we observed that while there was a difference in the osmolarity levels between the hyperglycemic patients and healthy adults before the treatment, there was no difference in the ONSD measurements. This finding might have resulted from the adaptation of the brain to the hyperglycemic condition. However, after the treatment, we observed a reduction in the difference between the osmolarity levels of the patients compared to those in the healthy adults, while the ONSD diameters of the patients were found to be increased. After the treatment, ONSD of the patients increased by 0.6 ± 0.4 mm. We consider that this post-treatment difference in ONSD occurred due to an increase in the water content in the brain. This result is important for showing that ONSD can be used for detecting brain edema.
Vascular factors are the leading causes taking part in the mechanism of developing brain edema. At first, an extracellular cerebral hypoperfusion and then a treatment-associated hyperperfusion state is considered to be responsible for developing brain edema. In the development of brain edema, the situation that hyperglycemia, dehydration, deep acidosis, and the severity of hyperventilation are more effective than the levels of osmolarity confirms this mechanism. Furthermore, it is reported that increased levels of blood urea nitrogen, alterations in the levels of Na+, and treatment with NaHCO3 have been involved in the development of brain edema. Brain edema is more common in patients with Type 1 DM, but also can be seen in patients with type 2 DM.5,32,33 However, in a study on children with Type 1 DM, it was observed that no ONSD alterations occurred in association with disease severity. 3 Similarly, in our study, it was determined that the ONSD measurements in the DKA and HHS patients were not different compared to those in the patients with isolated hyperglycemia. It comes out that the ONSD does not change with the severity of the disease. Whereas ONSD increased in both of these groups after treatment. The ONSD difference after the treatment was similar in both groups. However, the amount of administered fluid for 2 h was 1786 ± 165 mL in patients with DKA and HHS and 1684 ± 215 mL in patients with isolated hyperglycemic status. The similar difference in ONSD after the treatment can be attributed to that of the close amount of fluid given to both patient groups.
The metabolic state of patients is in a continuous state of change during the treatment. In a study investigating the effect of this change on ONSD in children, a negative correlation was reported between ONSD and the levels of pH, base excess, and
Conclusion
In conclusion, ONSD values of the patients having one of the acute hyperglycemic complications of DM are not different from those measured in healthy adults. Furthermore, ONSD values do not change with the severity of the disease. However, ONSD values change with treatment. The reduction in glucose levels is effectively involved in this change.
Limitations
The limitation of our study is that ONSD was measured only at the 0th and second hour of the treatment in the patients with one of the acute hyperglycemic complications of DM, but it was not performed throughout the treatment process. The reason for this is due to the fact that the patients were transferred from the emergency department to the other departments in the hospital for the maintenance of the follow-up and treatment. Furthermore, treatment-related ONSD alteration may be different in the pediatric age group. Pediatric patients were excluded from the study because our study was performed in adult emergency department. This is the limitation of our study.
Footnotes
Author contributions
E.D. and N.K. contributed to the study concept and design. E.D., N.K., and M.A. contributed to the acquisition of the data. N.K. contributed to the analysis and interpretation of the data. E.D., N.K., and M.A. contributed to the drafting of the manuscript and the critical revision of the manuscript for important intellectual content. N.K. contributed to the statistical expertise.
Declaration of conflicting interests
The author(s) declared no potential conflicts of interest with respect to the research, authorship, and/or publication of this article.
Funding
The author(s) received no financial support for the research, authorship, and/or publication of this article.
Availability of data and materials
All materials were taken from other sources (including our own published writing) and were clearly cited.
Informed consent
Written consent was obtained from all patients who participated in the study and from their relatives.
Ethical approval
This study was initiated in the ED of a tertiary hospital following ethics committee approval.
Human rights
Our work does not infringe on any rights of others, including privacy rights and intellectual property rights. There is no human rights violation in our manuscript.