
Abstract
Background and objectives:
To date, no study has investigated the ability of optic nerve sheath diameter calculated from non-contrast brain computed tomography to predict acute cerebellar infarction in patients with acute vertigo. The aim of our study was to evaluate the predictive utility of optic nerve sheath diameter for diagnosing acute cerebellar infarction in patients with acute vertigo without computed tomography abnormalities.
Methods:
We retrospectively enrolled patients with acute vertigo without computed tomography abnormalities who underwent magnetic resonance imaging including diffusion-weighted imaging at our emergency department between January 2016 and December 2017. Two emergency physicians independently measured optic nerve sheath diameter at 3 mm (ONSD3) and 10 mm (ONSD10) behind the globe in each patient. Final magnetic resonance imaging reports with clinical progress notes were used as the reference standard. A multivariate logistic regression analysis, receiver operating characteristic curves, and intra-class correlation coefficients were calculated to estimate predictive value.
Results:
A total of 34 patients (16.1%) were diagnosed with acute infarction and 177 patients (83.9%) were diagnosed with peripheral vertigo. Mean ONSD3 (p < 0.001) and ONSD10 (p < 0.001) were independent predictive factors for distinguishing acute infarction and peripheral vertigo. ONSD3 (cut-off = 4.22 mm) had 100% (95% confidence interval = 89.7–100.0) sensitivity and 97.7% (95% confidence interval = 95.1–99.6) specificity with area under the receiver operating characteristic curve of 0.988 (95% confidence interval = 0.978–1.0), while ONSD10 (cut-off = 3.63 mm) had 100% (95% confidence interval = 89.7–100.0) sensitivity and 87.6% (95% confidence interval = 81.8–92.0) specificity with area under the receiver operating characteristic curve of 0.976 (95% confidence interval = 0.959–0.997). There were good inter- and intra-observer agreements for both sides of ONSD3 and ONSD10 (intra-class correlation coefficient range = 0.652–0.773).
Conclusion:
Optic nerve sheath diameter, in particular OSND3, is a feasible predictive marker for acute infarction in patients with acute vertigo without computed tomography abnormalities. This information can assist decision-making in ordering brain magnetic resonance imaging for the assessment of acute vertigo.
Introduction
Vertigo is a common complaint in emergency departments (EDs), affecting approximately 7.5 million patients with a cost burden of 1.6 billion dollars annually in the United States.1–3 Vertigo is subdivided into central vertigo including acute infarction (especially in the cerebellar area) and peripheral vertigo including benign paroxysmal peripheral vertigo and vestibular neuritis. 4 Previous studies estimate that almost 25% of acute vertigo is associated with posterior fossa infarction.5,6 Because acute infarction causes significant morbidity in affected patients, the differential diagnosis of central versus peripheral vertigo is essential in the ED; the misdiagnosis of central vertigo can have devastating patient effects including permanent neurological deficits and death. 7
The diagnosis of central versus peripheral vertigo requires a thorough physical examination including a neurological examination; however, emergency physicians often have difficulty discriminating central and peripheral vertigo, especially in cases of small infarctions involving the cerebellum or brainstem combined with the absence of definite neurologic symptoms or signs.8–11 Accordingly, radiological evaluations are highly useful in patients with acute vertigo. Brain magnetic resonance imaging (MRI) is the gold standard for diagnosing acute cerebellar infarction in patients with acute vertigo; however, MRI is not readily available in many EDs and can be costly to patients.12–14
Optic nerve sheath diameter (ONSD) was recently identified as a useful indicator of intracranial pressure (ICP) based on its connection to the dura mater.15,16 ONSD has been used to predict poor prognosis and mortality after traumatic brain injury (TBI) and ischemic or hemorrhagic stroke.17–19 ONSD is easily measured on brain computed tomography (CT). 20 Yet, no study to date has investigated the ability of ONSD calculated from brain CT to predict acute cerebellar infarction in patients with acute vertigo. In this study, we hypothesized that high ONSD would be useful for predicting acute cerebellar infarction. Therefore, we evaluated ONSD as a predictor of acute infarction in patients presenting to the ED with acute vertigo without CT abnormalities.
Methods
Study design
We conducted a retrospective study using electronic medical record (EMR) data from patients presenting to our hospital’s ED complaining of acute vertigo. The study was approved by the institutional review board and the requirement for written informed consent was waived.
Study setting and population
The study was conducted at a tertiary university teaching hospital with 65,000 annual ED visits. We screened patients who presented to the ED between January 2016 and December 2017. MRI including diffusion-weighted imaging (DWI) was performed in patients with abnormal neurological findings; patients with visible abnormalities on non-enhanced brain CT including mass-like lesions or hypodensity; and patients exhibiting persistent vertigo symptoms or worsening vertigo after prompt treatment including conservative treatment. The inclusion criteria were as follows: age ⩾ 18 years; presentation to the ED for acute new-onset vertigo in the absence of CT abnormalities; persistent vertigo despite conservative treatment; and completion of non-contrast brain CT and MRI to exclude acute infarction. The exclusion criteria were as follows: patients with dizziness after head trauma; patients with definite CT abnormalities; patients with a previous diagnosis of vertigo and known cranial structural disease or cranial pathology; and patients with insufficient medical records of a neurological examination. Physiologic calcification and age-related changes such as leukoaraiosis were not classified as CT abnormalities. The flow of patient enrollment is provided in Figure 1.
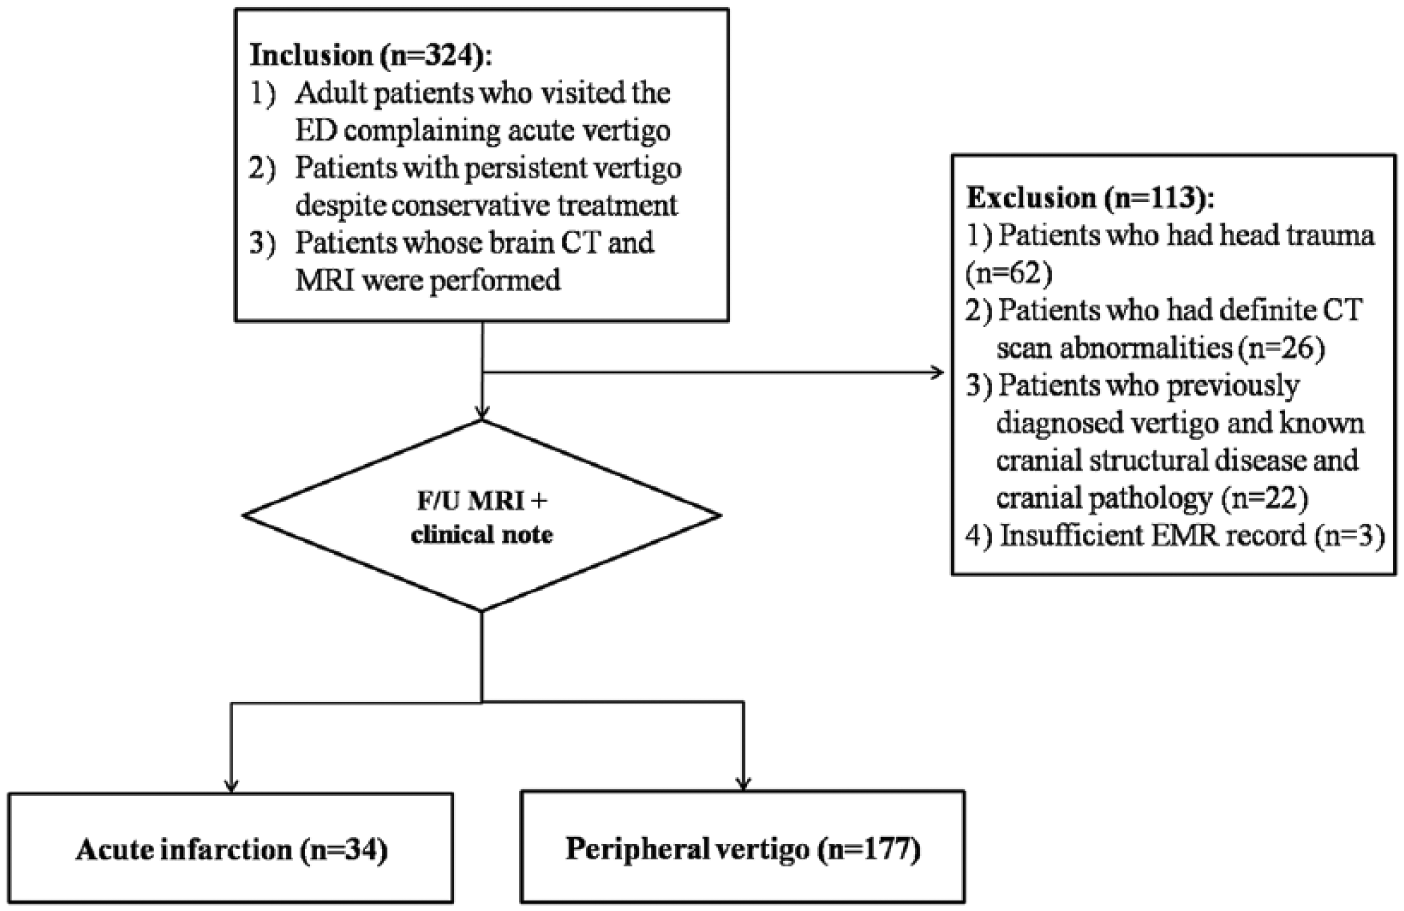
Patient selection.
Data collection and outcome measurement (reference standard)
One emergency physician collected EMR data for eligible patients, including patient demographics such as sex, age, symptom duration, history of atrial fibrillation, stroke, brain hemorrhage, diabetes mellitus, hypertension, dyslipidemia, and the intervals between the ED visit and initial CT and between the initial CT and MRI.
The diagnosis reference standard was made in the form of a final radiological MRI report by a senior neuro-radiologist with clinical progress notes. A diagnosis of peripheral vertigo was confirmed when the final radiologic report demonstrated the absence of diffusion restriction DWIs and symptoms of vertigo abated without the development of new neurological symptoms.
ONSD measurement on brain CT
ONSD was measured on axial CT images using Picture Archiving and Communication Software (Maroview). Two board-certified emergency physicians who were not involved in patient selection and were blinded to the final diagnosis and outcome reviewed each patient’s brain CT images. CT was performed with a series slice thickness of 5 mm. ONSD was measured bilaterally at a distance of 3 mm (ONSD3) and 10 mm (ONSD10) behind the globe where the ophthalmic artery crossed the optic nerve (Figure 2). The diameters of the left and right eyes were averaged for each patient. In order to improve the accuracy and reliability of ONSD measurements, window parameters were fixed as follows: spine window, middle third; WW60, WL 360, and accuracy of 1 pixel with a 200% enlarged plane. All measurements were made using the same window, contrast, and brightness. Both reviewers agreed to measurement points and methods prior to image review.
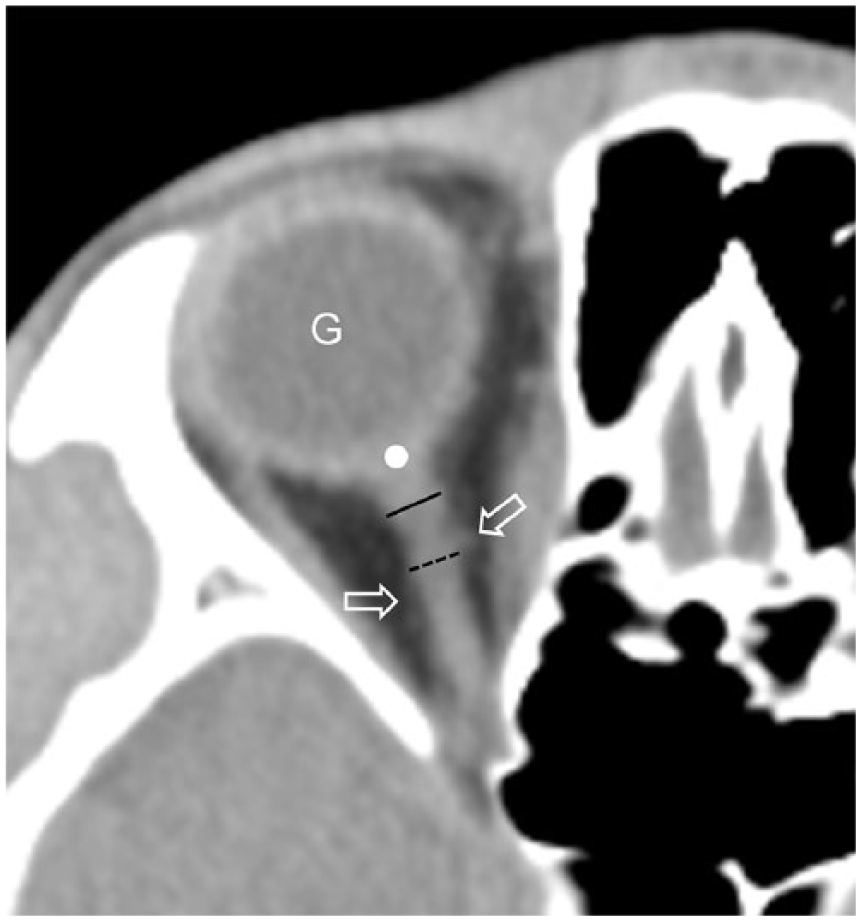
Axial non-contrast computed tomography is used to measure the optic nerve sheath diameter (ONSD). ONSD3 (solid line) is the transverse diameter of the ONSD 3 mm behind the globe (white point). ONSD10 (dotted line) is the transverse diameter of the ONSD 10 mm behind the globe (white point). Arrows indicate the ophthalmic artery, which crosses the optic nerve. G is the globe.
Statistical analysis
Independent t-tests or Mann–Whitney’s U-tests were performed for continuous variables, and Pearson’s chi-square test or Fisher’s exact test was performed for nominal variables. A multivariate logistic regression analysis of variables significant in a univariate analysis was used to identify independent predictive factors for the differential diagnosis of acute infarction versus peripheral vertigo. Adjusted odds ratios (ORs) and 95% confidence intervals (CIs) were generated from multivariate analyses. Thereafter, a receiver operating characteristic (ROC) curve analysis was used to determine the diagnostic performance of significant variables for differentiation between acute infarction and peripheral vertigo including cut-off values for optimal area under the curve (AUC), sensitivity, and specificity. Intra-class correlation coefficients (ICCs) with 95% CIs were calculated to determine the agreement between the reviewers. ICCs of 0–0.20 indicated poor agreement, 0.21–0.40 fair agreement, 0.41–0.60 moderate agreement, 0.61–0.80 good agreement, and 0.81–1.00 excellent agreement. The significance level was p < 0.05. Statistical analyses were conducted with SPSS 18.0 (SPSS Inc., Chicago, IL, USA).
Results
Baseline characteristics
A total of 211 patients were enrolled in the study. Baseline characteristics are presented in Table 1. The mean age of the enrolled patients was 62.7 (range = 35–94) years and 42.7% of patients were male. The mean ONSD3 and ONSD10 values were 4.0 (range = 3.6–4.9) mm and 3.5 (range = 3.0–4.3) mm, respectively. A total of 34 patients (16.1%) were diagnosed with acute cerebellar infarction (central vertigo) as per the reference standard; the remaining 177 patients (83.9%) were diagnosed with peripheral vertigo. There were no central vertigo patients with hemorrhage or intracranial masses as these patients were excluded from the study based on CT abnormalities. Two cases of brainstem infarction were also excluded because low attenuation lesions on the pons were noted on the brain CT scan. The mean time from symptom onset was 1.6 (0–30) h. The mean time interval between the ED visit and CT was 1.2 (range = 0–3) h and the mean interval between CT and MRI was 1.5 (range = 0–4) h.
Patient demographic characteristics and univariate analysis results.
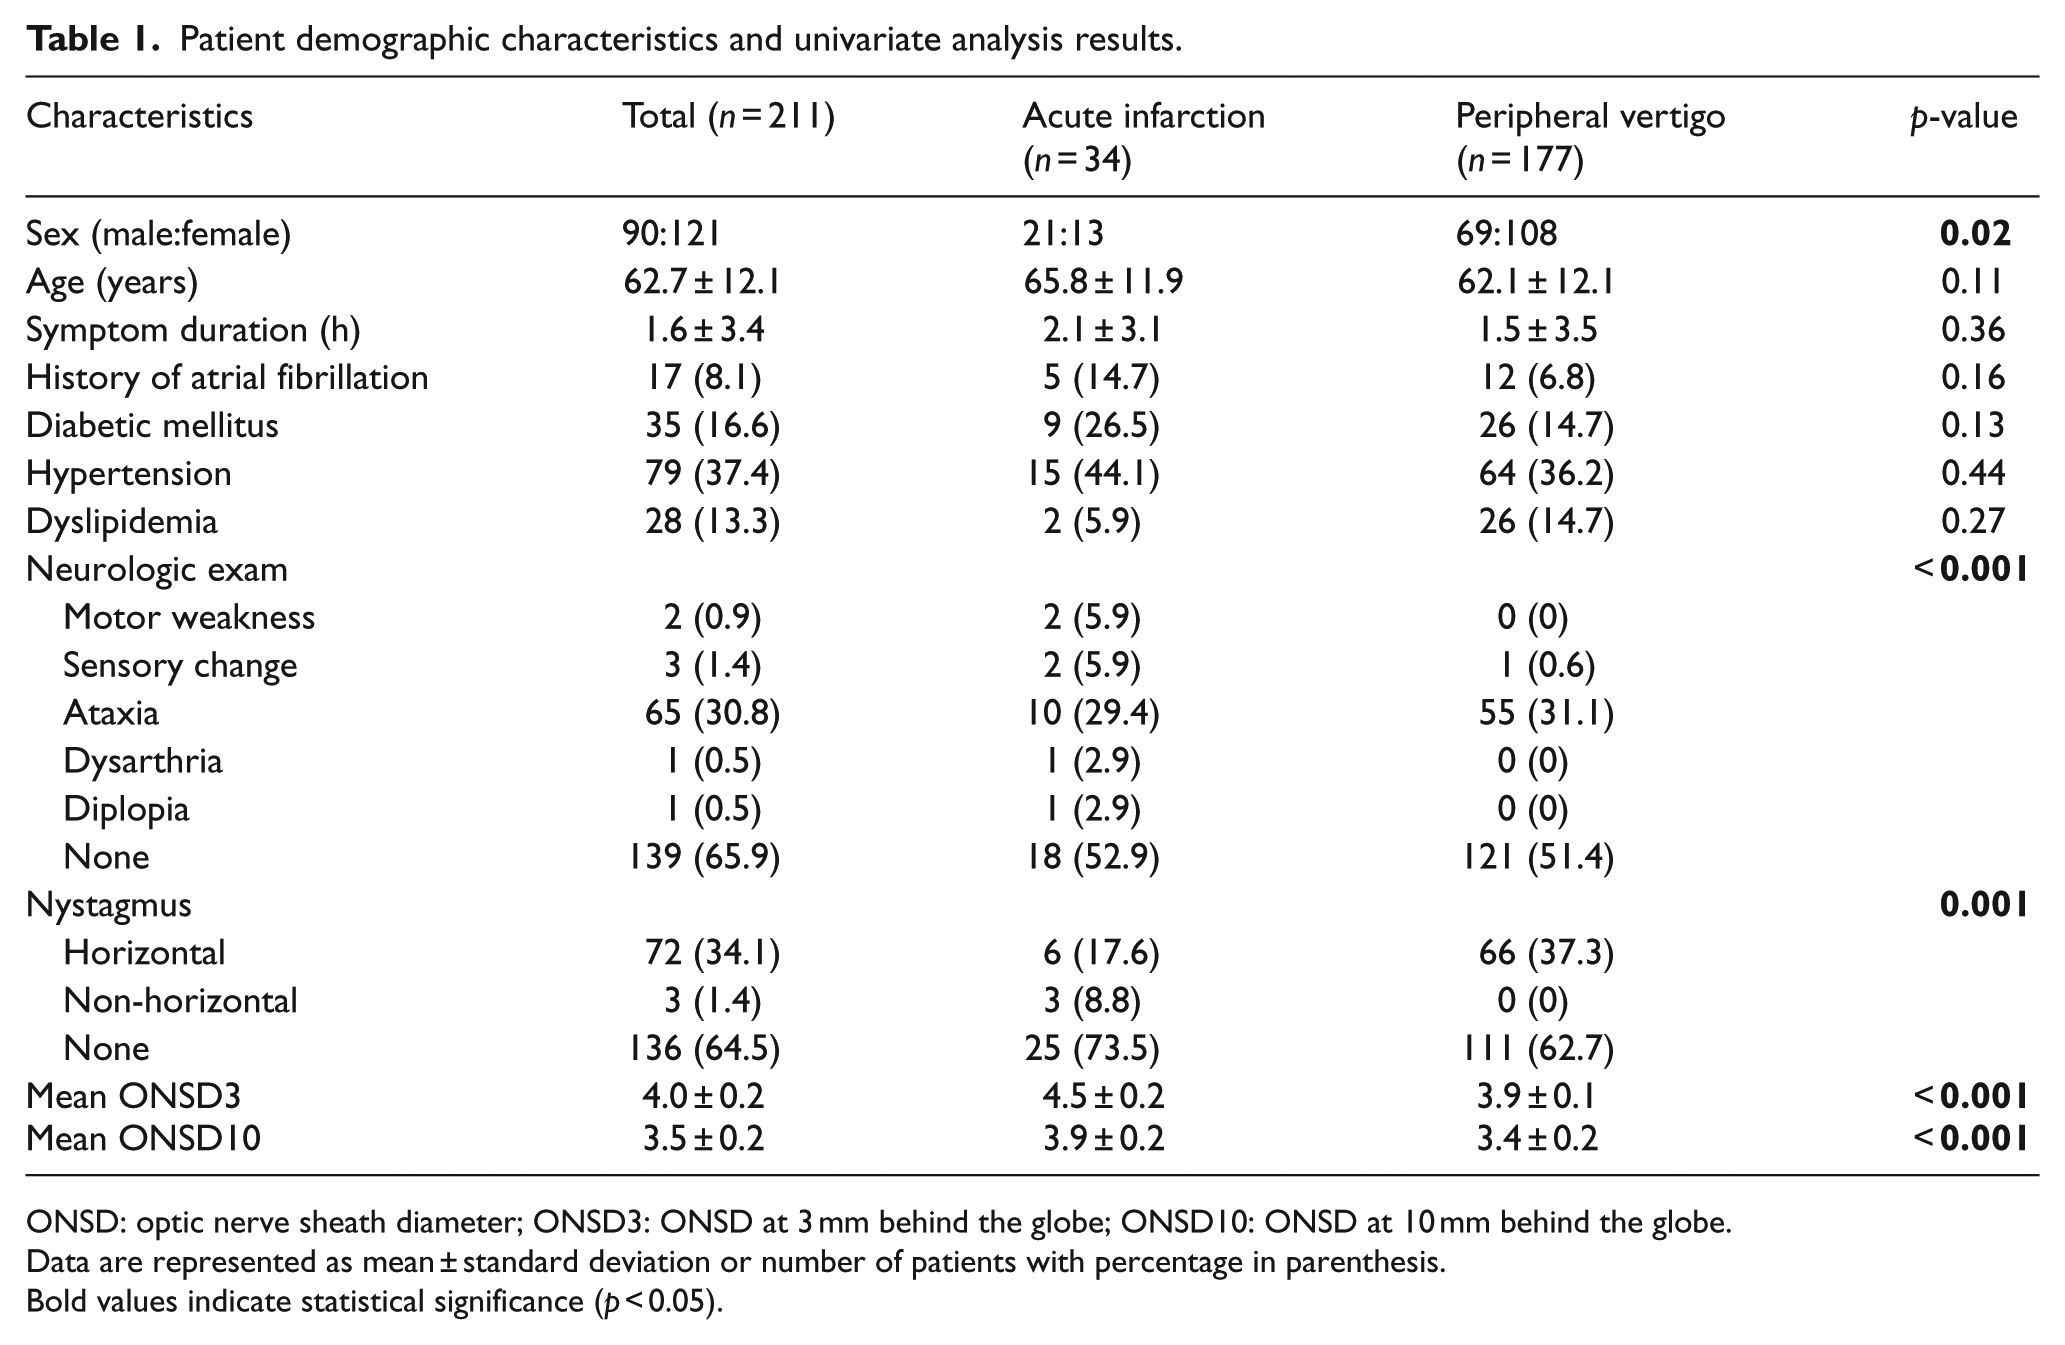
ONSD: optic nerve sheath diameter; ONSD3: ONSD at 3 mm behind the globe; ONSD10: ONSD at 10 mm behind the globe.
Data are represented as mean ± standard deviation or number of patients with percentage in parenthesis.
Bold values indicate statistical significance (p < 0.05).
Clinical factors associated with the differential diagnosis of acute infarction or peripheral vertigo
Among clinical variables, sex (p = 0.02), neurological exam findings (p < 0.001), and horizontal nystagmus (p = 0.001) were significantly different between the acute infarction and peripheral vertigo populations. The percentage of male, frequencies of positive neurologic exam except ataxia, and non-horizontal nystagmus were significantly higher in acute infarction. Mean ONSD3 (p < 0.001) and ONSD10 (p < 0.001) were also significantly different between the patient groups. Mean ONSD3 and ONSD10 were significantly higher in acute infarction (Table 1).
A multivariate logistic regression analysis revealed that mean ONSD3 (p = 0.04) and ONSD10 (p = 0.01) were significant factors for differentiating acute infarction and peripheral vertigo; as mean ONSD3 and ONSD10 increased, the risk of acute infarction increased by 10.7-fold and 7.3-fold, respectively (Table 2).
Multivariate analysis of variables differentiating acute infarction from peripheral vertigo.
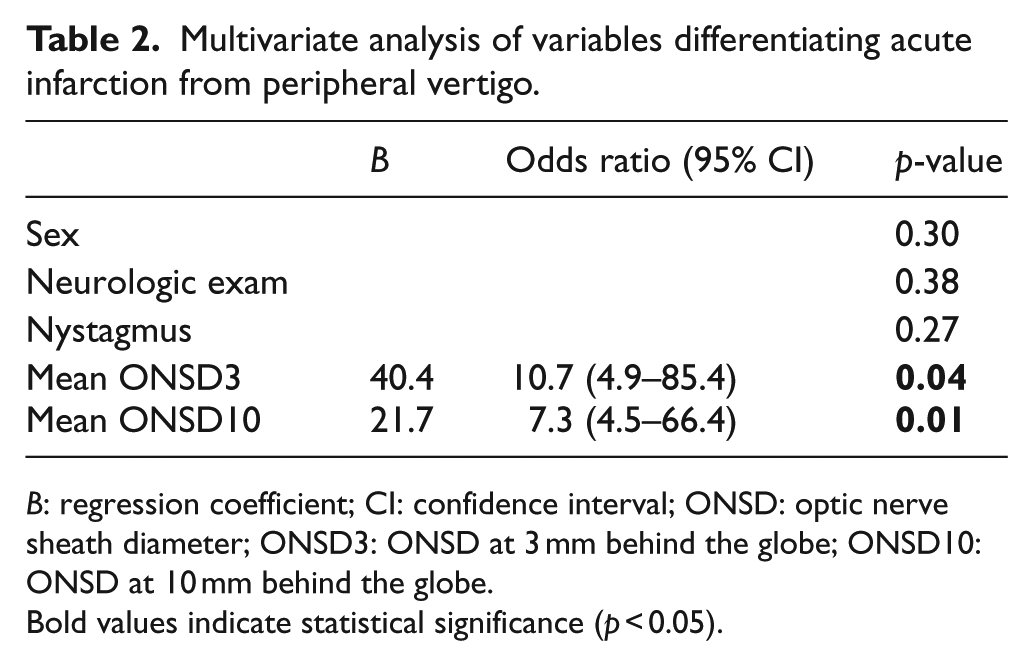
B: regression coefficient; CI: confidence interval; ONSD: optic nerve sheath diameter; ONSD3: ONSD at 3 mm behind the globe; ONSD10: ONSD at 10 mm behind the globe.
Bold values indicate statistical significance (p < 0.05).
Diagnostic value for distinguishing acute infarction from peripheral vertigo
Cut-off values for optimal sensitivity and specificity are summarized in Table 3. When the cut-off value of ONSD3 was 4.22 mm, the AUC was 0.988 (95% CI = 0.978–1.0), sensitivity was 100% (95% CI = 89.7–100.0), and specificity was 97.7% (95% CI = 95.1–99.6). When the cut-off value of ONSD10 was 3.63 mm, the AUC was 0.976 (95% CI = 0.959–0.997), sensitivity was 100% (95% CI = 89.7–100.0), and specificity was 87.6% (95% CI = 81.8–92.0) (Figure 3).
Predictive values of independent factors for differentiating acute infarction from peripheral vertigo.
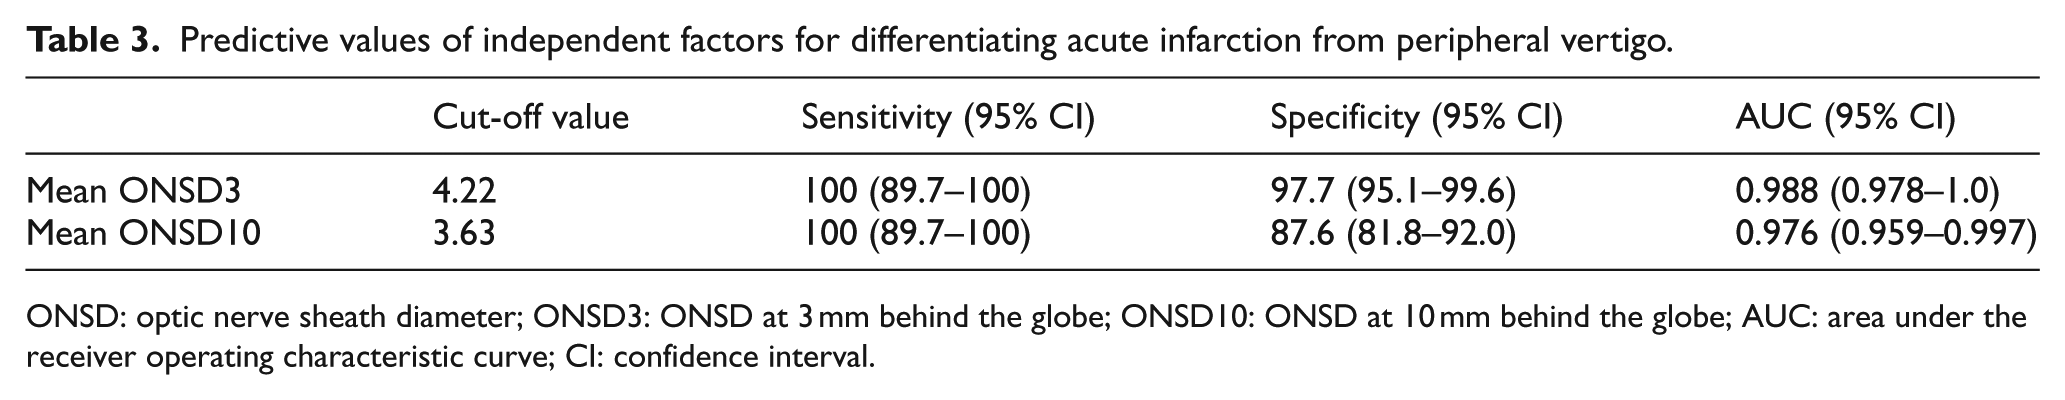
ONSD: optic nerve sheath diameter; ONSD3: ONSD at 3 mm behind the globe; ONSD10: ONSD at 10 mm behind the globe; AUC: area under the receiver operating characteristic curve; CI: confidence interval.
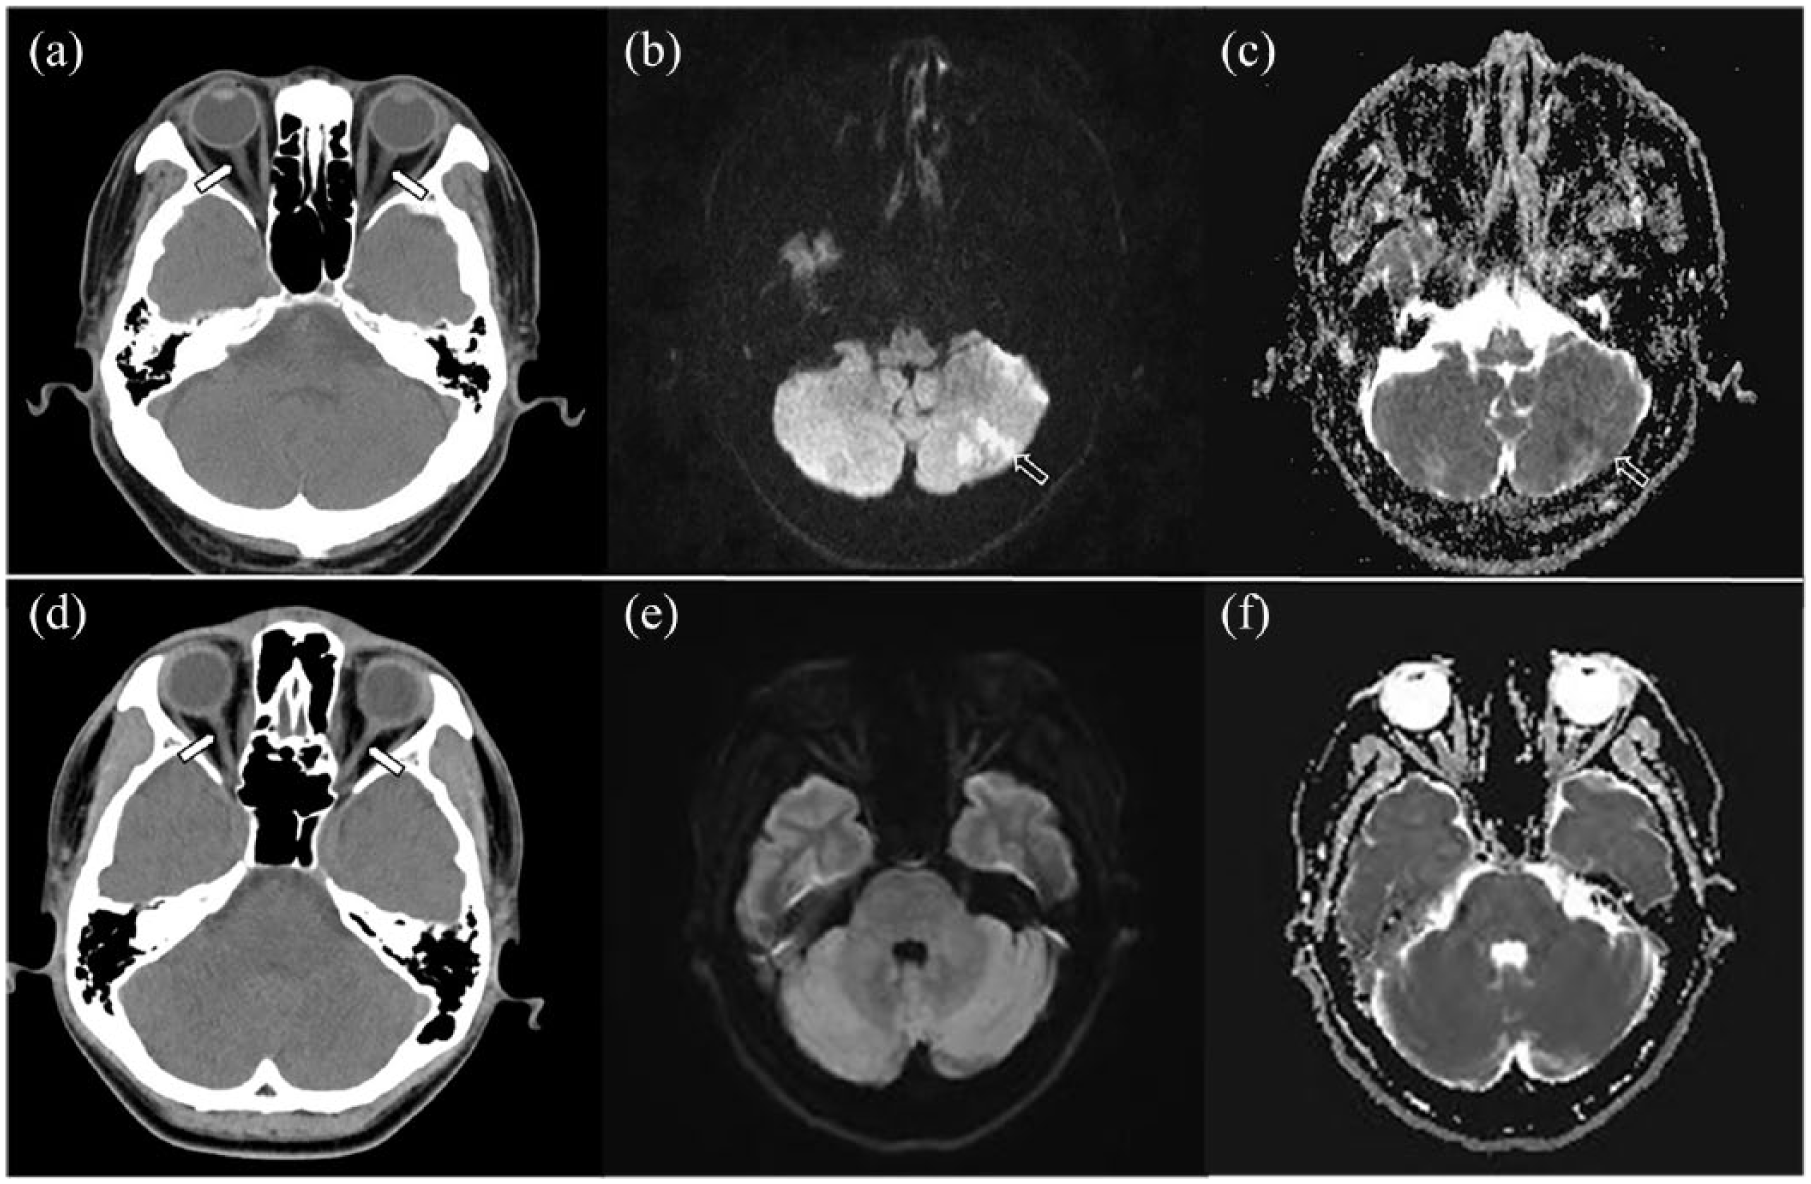
Prediction of patient with acute infarction and peripheral vertigo using optic nerve sheath diameter. (a–c) A 71-year-old male patient with acute infarction. Neurological examination findings were negative. The time interval between computed tomography (CT) and diffusion-weighted imaging (DWI) was 30 min. Axial CT image (a) showing no abnormal hypodense or hyperdense lesions in either cerebellar hemispheres. However, symmetric dilatation of the optic nerve sheath is seen (arrows). The mean optic nerve sheath diameter 3 mm behind the globe (ONSD3) was 4.9 mm (left = 5.2 mm; right = 4.6 mm) and that 10 mm behind the globe (ONSD10) was 4.1 mm (left = 4.4 mm; right = 3.8 mm). Axial DWI (b value = 1000) (b) and apparent diffusion coefficient maps (c) showing restricted diffusion in the left cerebellar hemisphere (arrows). This patient was diagnosed with acute cerebellar infarction. (d–f) A 65-year-old female with acute vertigo and ataxia. Time interval between CT and DWI is 1 h. Axial CT image (d) shows no abnormal hypodense or hyperdense lesions in the posterior circulation. Also, dilatation of the optic nerve sheath is not seen (arrows). The mean ONSD3 was 3.6 mm (left = 3.4 mm; right = 3.8 mm) and that ONSD10 was 3.3 mm (left = 3.2 mm; right = 3.4 mm). Axial DWI (b value = 1000) (e) and same level of the apparent diffusion coefficient map (f) show no diffusion restriction in the posterior circulation. This patient was diagnosed with peripheral vertigo (benign paroxysmal positional vertigo).
The agreements for both sides (left and right) for ONSD3 and ONSD10 were good between reviewers 1 and 2; the ICC for right ONSD3 was 0.773 (95% CI = 0.702–0.827) and that for right ONSD10 was 0.722 (95% CI = 0.604–0.812). The ICC for left ONSD3 was 0.702 (95% CI = 0.578–0.797) and that for left ONSD10 was 0.652 (95% CI = 0.544–0.735).
False-positive and false-negative rates
False-negatives were not identified when ONSD3 > 4.22 mm or ONSD10 > 3.63 mm. The false-positive rates of ONSD3 and ONSD10 were 2.3% (4 of 177) and 12.4% (22 of 177), respectively. The mean ONSD3 and ONSD10 values of false-positive patients were 4.29 (range = 4.28–4.30) mm and 3.69 (range = 3.64–3.86) mm, respectively.
Discussion
This study found that ONSD3 and ONSD10 values were independent predictors of acute infarction in patients presenting with acute vertigo at the ED. Mean ONSD3 and ONSD10 values were also useful for predicting central vertigo. Among them, ONSD3 showed the most feasibility (cut-off = 4.22 mm) with 100% sensitivity and 98.3% specificity. Higher ONSD values were associated with an increased risk of acute infarction. In addition, more than half (52.9%) of acute infarction patients without CT abnormality did not show neurologic abnormalities. Therefore, we speculate that ONSD3 measurement can predict acute infarction and assist ED physicians in the prompt ordering of MRI.
Acute vertigo of central origin related to an infarct can be associated with rapid swelling, compression of the posterior fossa structures, and life-threatening conditions. Clinical deterioration can occur within hours or days of stroke and is usually the result of brainstem compression from post-infarct edema and/or the development of hydrocephalus. If left untreated, these conditions can lead to irreversible neurological deficits or death. 21 Previous reports suggest that many patients with acute vertigo are discharged from the ED without a definite diagnosis, whereas 3–4% of patients visiting the ED with a primary complaint of acute vertigo were diagnosed with stroke during follow-up evaluation. 11 MRI is the gold standard for diagnosing acute stroke, but it is not readily available in most EDs and is often avoided as an expensive medical cost.12–15 Use of a radiological screening tool may therefore be helpful in this patient population.
The optic nerve sheath is part of the central nervous system and is surrounded by cerebrospinal fluid (CSF). If the CSF circulation is not blocked, increases in ICP are transmitted through the subarachnoid space surrounding the optic nerve, especially around the retrobulbar segment. Increased ICP can lead to enlargement of the ONSD.15,16 Several pathophysiological mechanisms have been proposed to mediate an increased risk of ICP elevation after stroke. Cerebellar infarction and particularly infarction affecting the posterior inferior cerebellar artery can be accompanied by brain swelling due to the loss of membrane transporter function, leading to sodium and water influx into necrotic or ischemic cells and cytotoxic edema. Persistent swelling disrupts the blood–brain barrier, potentially mediating coexistent vasogenic edema. 7 Traditionally, ICP is measured by invasive methods such as lumbar puncture and ventricular catheterization. However, invasive procedures have limitations including post-procedure hemorrhage or infection and technical difficulties. 22
In this study, we selected distances of 3 and 10 mm behind the globe for measuring ONSD on CT. ONSD measurement has been used has a clinical assessment for almost 20 years; while several protocols have been described, there is no standard method for ONSD measurement. 23 Yet, a recent study suggested that ONSD3 and ONSD10 were useful for identifying elevated ICP. 24 ONSD can also be measured on ultrasound, although this technique is associated with a higher risk of bias related to patient position, compliance, and the observer. 25
In previous studies,26–28 serum calcium binding protein S100B > 30 pg/mL indicated a high probability of MRI positivity including acute ischemia, hemorrhage, and intracranial masses (83.9% sensitivity, 51.0% specificity); however, much like MRI, S100B quantification is not readily available in most EDs and ordering additional laboratory tests can be costly. Unlike serum S100B measurement, ONSD measurement is simple, economically feasible, and readily available in ED contexts. In addition, ONSD measurement for the detection of elevated ICP only takes 5 min per patient. 15 Accordingly, ONSD may be a highly useful tool for determining whether patients with acute vertigo require MRI assessment to confirm stroke in ED settings.
The cut-off value of ONSD for detection of elevated ICP was lower in our study (4.22 mm) than in previous studies (cut-off value = 4.5–6 mm),29,30 which may have been caused by the differences in our patients group and the duration of the symptom. Our study was focused on patients with cerebellar infarction and early-onset vertigo without brain CT abnormalities; however, previous studies29,30 focused on patients with severe TBI/low Glasgow Coma Scale score and brain CT abnormalities (implying that some time has passed since the disease onset). However, our study has clinical implications as it shows that ONSD is also useful for acute early-onset cerebellar infarction even though brain CT abnormalities were not observed.
This study had some limitations. First, the study was subjected to selection bias as a single-centered study with a retrospective design, such that our results may have limited generalizability. Second, this study retrospectively evaluated EMR data; different physicians may have had varying experience with the diagnosis of acute vertigo, leading to additional problems with result generalization. Third, as the difference of mean ONSD value between central vertigo and peripheral vertigo patients are not very large, improper placement of the cursors on the CT image alone could result in false-positive or false-negative findings. The potential for measurement error may decrease if a thin slice thickness CT image is used, as ONSD is more clearly delineated. Fourth, ONSD measurements do exhibit variance across physicians; although we showed good agreement in this study, several reports have indicated mean intra-observer variance of 0.1–0.2 mm and mean inter-observer variance of 0.2–0.3 mm.31,32 Finally, we evaluated the patients for restrictive inclusion criteria (in an overfitting model); thus, the diagnostic performance of ONSD may vary when applied to all patients with vertigo. The rate of central vertigo was particularly high in the study (16.1%) compared to the largest previous ED population-based study (3.2%); 3 this may have been a result of the enrollment criteria, which required patients to have completed at least initial CT and follow-up MRI. Future studies are required to confirm our findings in more generalizable contexts. Despite these limitations, we suggest that ONSD is a feasible and reliable predictor for guiding the diagnosis and treatment of patients with acute vertigo without CT abnormalities.
Conclusion
In conclusion, ONSD measurement is a feasible predictive marker of acute infarction in patients with acute vertigo without CT abnormalities. In particular, ONSD3 larger than 4.22 mm showed good sensitivity and specificity for predicting infarction. This measurement can assist physicians with the decision to order MRI in patients with acute vertigo.
Footnotes
Authors’ note
Sun Hwa Lee is now addressed in Department of Emergency Medicine, Ewha Womans University Mokdong Hospital, College of Medicine, Ewha Womans University, Seoul, Republic of Korea.
Author contributions
S.H.L. and S.J.Y. designed the study and the literature search; M.S.Y., S.R., and S.W.C. collected and analyzed data; M.S.Y. S.H.L., and S.J.Y. wrote the manuscript; and S.R., S.W.C., H.J.K., T.K.K., S.C.O., and S.J.C. made the critical revision of this manuscript. All authors read and approved the final manuscript.
Declaration of conflicting interests
The author(s) declared no potential conflicts of interest with respect to the research, authorship, and/or publication of this article.
Funding
The author(s) received no financial support for the research, authorship, and/or publication of this article.
Availability of data and materials
The materials described in the manuscript will be freely available to any scientist wishing to use them for non-commercial purposes, without breaching participant confidentiality.
Ethical approval
This study was approved by the local ethics committee. To maintain patient confidentiality, the forms did not include any data that would have enabled identification of any patients. The procedures performed in this study followed the ethical standards in the Helsinki Declaration of 1964, as revised in 2008, as well as the national law.
Human rights
This study was conducted according to the World Medical Association Declaration of Helsinki.
Informed consent
Since the study was a retrospective design, informed consent was not obtained.