
Abstract
Background:
Stroke is the third leading cause of death and the first cause of disability in the world. It holds an important place in hospital admissions and health expenses in the industrialized world.
Objective:
The aim of the study was to evaluate the relationship between optic nerve sheath diameter and the findings of brain computerized tomography scans and brain diffusion-weighted imaging and investigate the variability of optic nerve sheath diameter measured by ultrasonography in acute ischemic stroke.
Methods:
Patients who had acute ischemic stroke were included in Group A. Healthy adults were included in Group B as the control group. In addition, according to computerized tomography scans and diffusion-weighted imaging findings, Group A was divided into three subgroups. Patients with normal computerized tomography and diffusion-weighted imaging were included in Group 1, patients with normal computerized tomography and ischemic area on diffusion-weighted imaging were included in Group 2, and patients with ischemic area on computerized tomography and diffusion-weighted imaging were included in Group 3.
Results:
A total of 100 patients were included in Group A and 100 healthy adults included in Group B. The optic nerve sheath diameter values of Groups A and B were 5.4 ± 0.6 and 4.2 ± 0.4 mm (p < 0.001), respectively. The optic nerve sheath diameter cutoff value for detection of acute ischemic stroke was determined as 4.7 mm. The sensitivity and specificity at this cutoff value were determined as 89% and 90%, respectively. According to computerized tomography scans and diffusion-weighted imaging findings, there were 18 patients in Group 1, 56 patients in Group 2, and 26 patients in Group 3. Time from onset of symptoms to presentation to emergency department was shortest in Group 1 (3.0 ± 1.8 h). The widest optic nerve sheath diameter was calculated in Group 3 (optic nerve sheath diameter: 5.7 ± 0.6 mm).
Conclusion:
This study demonstrates that the optic nerve sheath diameter increases in acute ischemic stroke and it increases earlier than computerized tomography and diffusion-weighted imaging alteration occur. Therefore, optic nerve sheath diameter can be applied to assist the diagnosis of acute ischemic stroke with other imaging techniques with equivocal/negative results and determination of appropriate treatment, especially in cases with normal computerized tomography scan and diffusion-weighted imaging.
Keywords
Introduction
Stroke is the third leading cause of death and the first cause of disability in the world. It holds an important place in hospital admissions and health expenses in the industrialized world. 1 More than 80% of the strokes are ischemic. The commonest causes of acute ischemic stroke (AIS) are thromboembolic due to large artery atherosclerosis, cardioembolic, and small vessel occlusion. The other causes of stroke include intracerebral hemorrhage and subarachnoid hemorrhage. 2
Imaging studies play a critical role in evaluating patients suspected of acute stroke especially before initiating treatment. The primary goal of imaging in patients having acute stroke symptoms is to distinguish between the presence of hemorrhagic and ischemic stroke. In ischemic stroke patients, secondary goals of imaging include identification of the location and extent of intravascular clot before initiating revascularization interventions with intravenous thrombolysis or endovascular therapies. Therefore, over the last years, the major focus of imaging researches has been the AIS evaluation, aiming better, and faster diagnosis.3–5
In AIS, computerized tomography (CT) and magnetic resonance imaging (MRI) enable prompt diagnosis, identify treatable underlying causes of stroke, enhance selection of candidates for reperfusion therapy within or outside of standard windows, and predict outcomes. However, acute ischemic changes are usually unclear in the early period in CT. Diffusion-weighted imaging (DWI) is approximately 4 to 5 times more sensitive in detecting AIS than CT. DWI can detect acute brain infarction within 1–2 h, while CT may be negative for the first 24–36 h.2–4 However, MRI is not always possible in the emergency department (ED).
Ischemia causes brain damage by activating the ischemic cascade and results in brain edema (BE). BE is a fatal pathological state in which brain volume increases as a result of abnormal accumulation of fluid within the cerebral parenchyma. The abnormal accumulation of fluid causes an increase in brain volume and elevation of intracranial pressure (ICP) because of an enclosed rigid skull. The increase in brain volume results from an increase in brain components including cerebral tissue, blood, and cerebrospinal fluid (CSF) compartments and is observed prior to elevation of ICP.6–9 The elevation of ICP in the brain induces adverse conditions including reduction of cerebral blood, hypoxia, and pressure of the cerebral tissue and hernia. Several reference tests are used for the diagnosis of increased ICP which may include CT scan, MRI, invasive ICP monitoring, or lumbar puncture (LP).8,9 However, these tests can be invasive, associated with radiation exposure, contraindicated, or not readily available. In a clinical setting, a non-invasive approach to measure ICP is by ocular ultrasound. From the ocular ultrasound image, the physician manually measures the diameter of optic nerve sheath at a location 3 mm behind the retina. A diameter of the optic nerve greater than 5 mm indicates increased ICP.10–13
The objective of the study was to evaluate the relationship between optic nerve sheath diameter (ONSD) and the findings of brain CT scans and brain DWI and investigate the variability of ONSD measured by ultrasonography in AIS.
Materials and method
This prospectively designed study was initiated following ethics committee approval and was conducted in the ED of a tertiary hospital between 16 March 2018 and 12 September 2018. Patients were diagnosed as having acute stroke based on medical history obtained from patients or relatives and physical examination findings. The patients with a diagnosis of AIS based on physical and neurologic examination, laboratory tests, CT, and brain DWI scans were included in the study. National Institutes of Health Stroke Scale was used as a stroke severity rating scale.
The exclusion criteria were as follows: the presence of hemorrhage and mass lesion on brain CT; being younger than 18 years of age; history of glaucoma or current medications that might have affected ICP; ophthalmic diseases, such as tumors or traumas; poisoning by drugs or substances that cause impaired consciousness; electrolyte disorders (such as hyponatremia or hypernatremia and hypocalcemia or hypercalcemia); and endocrine disorders (such as hypoglycemia or hyperglycemia and hypothyroidism or hyperthyroidism). Written consent was obtained from all the patients included in the study or their relatives.
Patients who had AIS were included in Group A. In addition to the above exclusion criteria, healthy adults without cerebrovascular disease were included in Group B as the control group. In addition, Group A was divided into three subgroups. Patients with normal CT and DWI were included in Group 1, patients with normal CT and ischemic area on DWI were included in Group 2, and patients with ischemic area on CT and DWI were included in Group 3.
ONSD measurement
ONSD measurement was performed by an emergency physician using a 7.5 MHz linear ultrasound probe (ESAOTE/Firenze/ITALIA) in the ED. Patients were examined in the supine position with a closed eyelid. Ultrasound gel was applied on the surface of each eyelid and the measurements were made in the axial and sagittal planes of the widest diameter visible 3 mm behind the retina in both eyes (Figure 1).
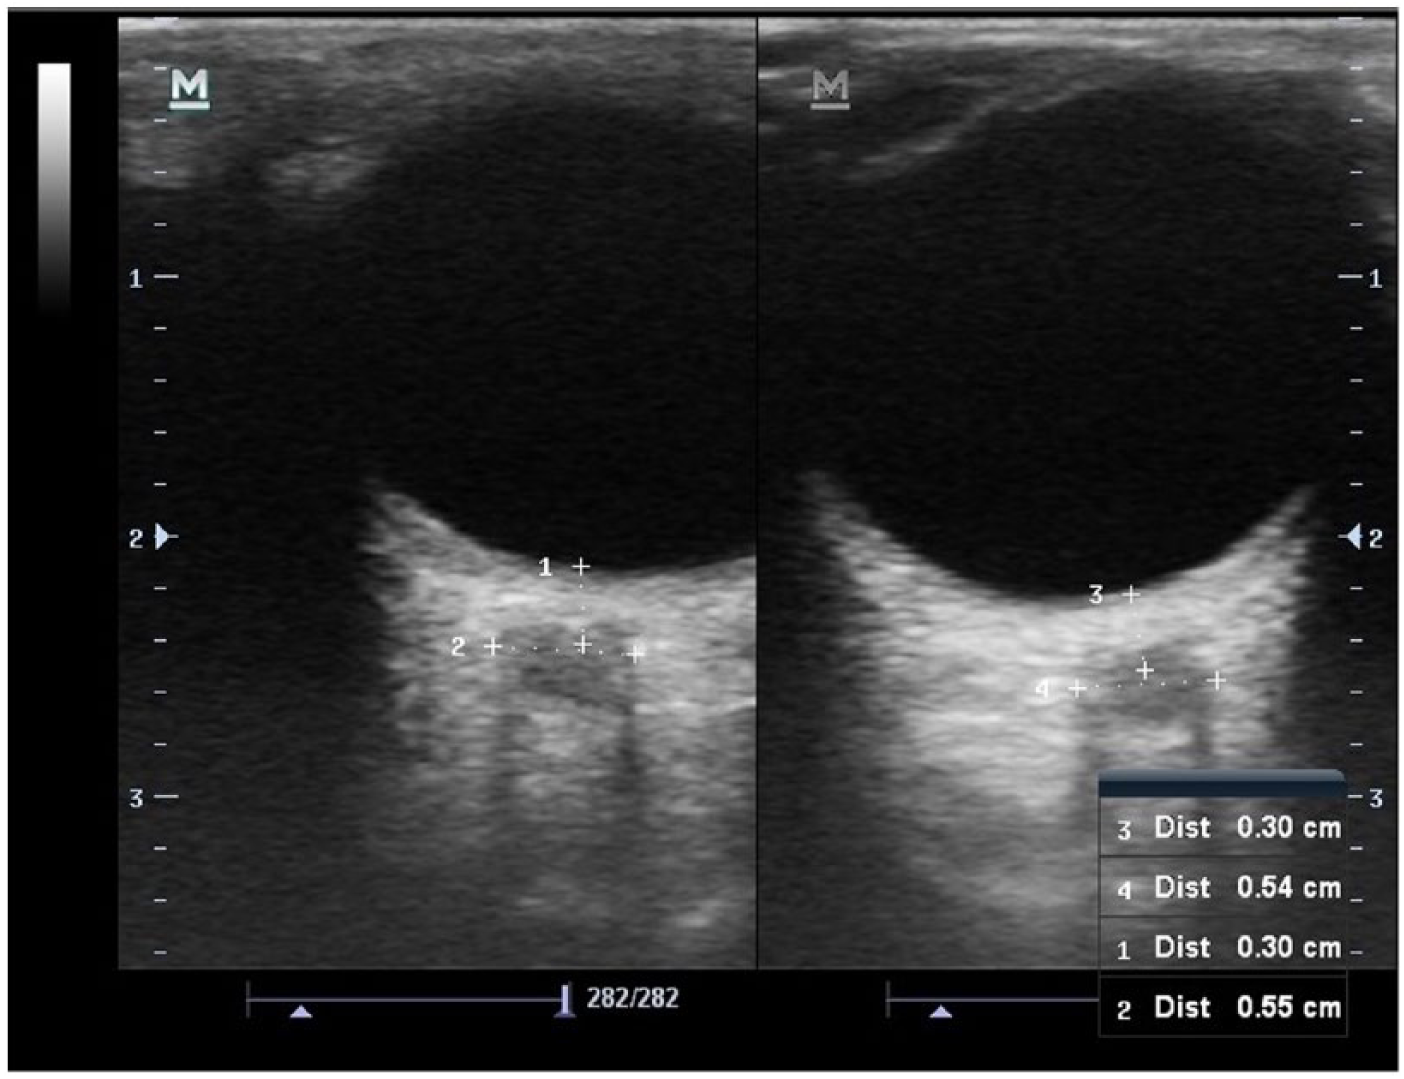
Ultrasonographic simultaneous measurement technique of right and left ONSDs. The ONSD is measured 3 mm behind the retina.
Brain CT (HITACHI-ECLOS multi-slice 16-ch, Japanese) scan was performed with the patients in the supine position with a CT scanner in the ED, after completing the ultrasonography examination. After that, all the patients were imaged with DWI (Philips Achieva 1.5T-MRI Scanner). Brain CT scans were obtained within 15–20 min and DWI 45–60 min. The brain CT and the brain DWI were interpreted by radiologist. All patients were evaluated and hospitalized by neurologists.
Statistical analysis
All data were analyzed using the software SPSS Statistics Version 21.0 for Windows. Categorical data were presented as percentages. Numerical data were presented as mean ± standard deviation as well as median (min–max), and the assumption of normality was tested using the Kolmogorov–Smirnov test. Categorical variables were analyzed using χ2 test; parametric data were analyzed using Student’s t test, and nonparametric data were analyzed using Mann–Whitney and Kruskal–Wallis tests.
The higher ONSD values of left and right eyes were used for statistical analysis. Age, sex, ONSD values, and the difference between ONSD values of both eyes of patients in Groups A and B were compared. In Group A, ONSD values of patients with and without ischemic findings on CT scans and on DWI were compared. Time from onset of symptoms to presentation to ED and the ONSD values of Group 1, Group 2 and Group 3 were compared.
Results
A total of 100 patients were included in Group A and 100 healthy adults included in Group B. In Group A, 42 patients were males and 58 were females. In Group B, 49 patients were males and 51 patients were females. The mean age of the patients included in Groups A and Group B were found to be 68.6 ± 13.5 and 66.9 ± 16.2 years, respectively. There were no significant differences regarding age (p = 0.446) and sex (p = 0.394) between patient groups.
Time from onset of symptoms to presentation to ED was calculated as 4.6 ± 2.7 h (minimum: 1 h; maximum: 24 h) after AIS. In Group A, Glascow Coma Score (GCS) in 77 patients were mild (14 and 15), in 19 patients were moderate (9–13), and in 4 patients were severe (⩽8).
When comparing Group A and Group B, ONSD value was significantly higher in Group A than Group B (p < 0.05; Table 1). The difference between ONSD of both eyes was significantly higher in Group A than Group B (p < 0.05; Table 1).
Comparison of ONSD values of Group A and Group B.
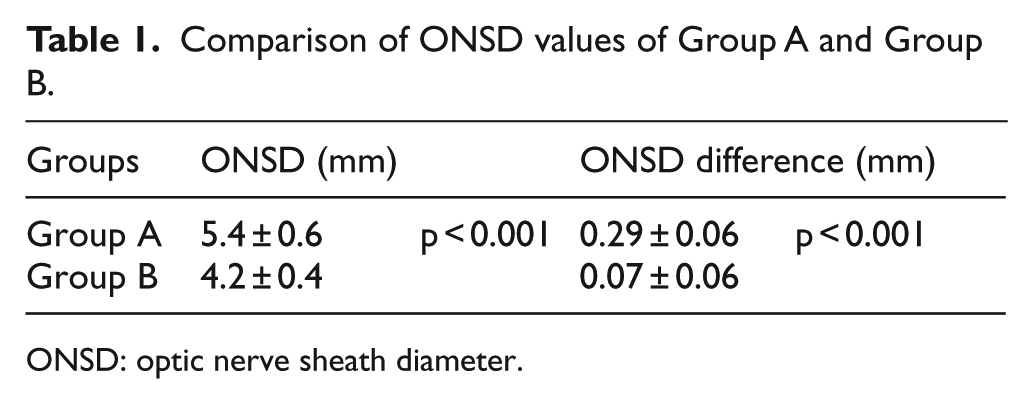
ONSD: optic nerve sheath diameter.
When the ONSDs of Group A and Group B are evaluated together, the cutoff value for detection of AIS was determined as 4.7 mm (the area under the curve: 0.936; 95% confidence interval: 0.902–0.970). The sensitivity and specificity at this cutoff value were determined as 89% and 90%, respectively (Figure 2).
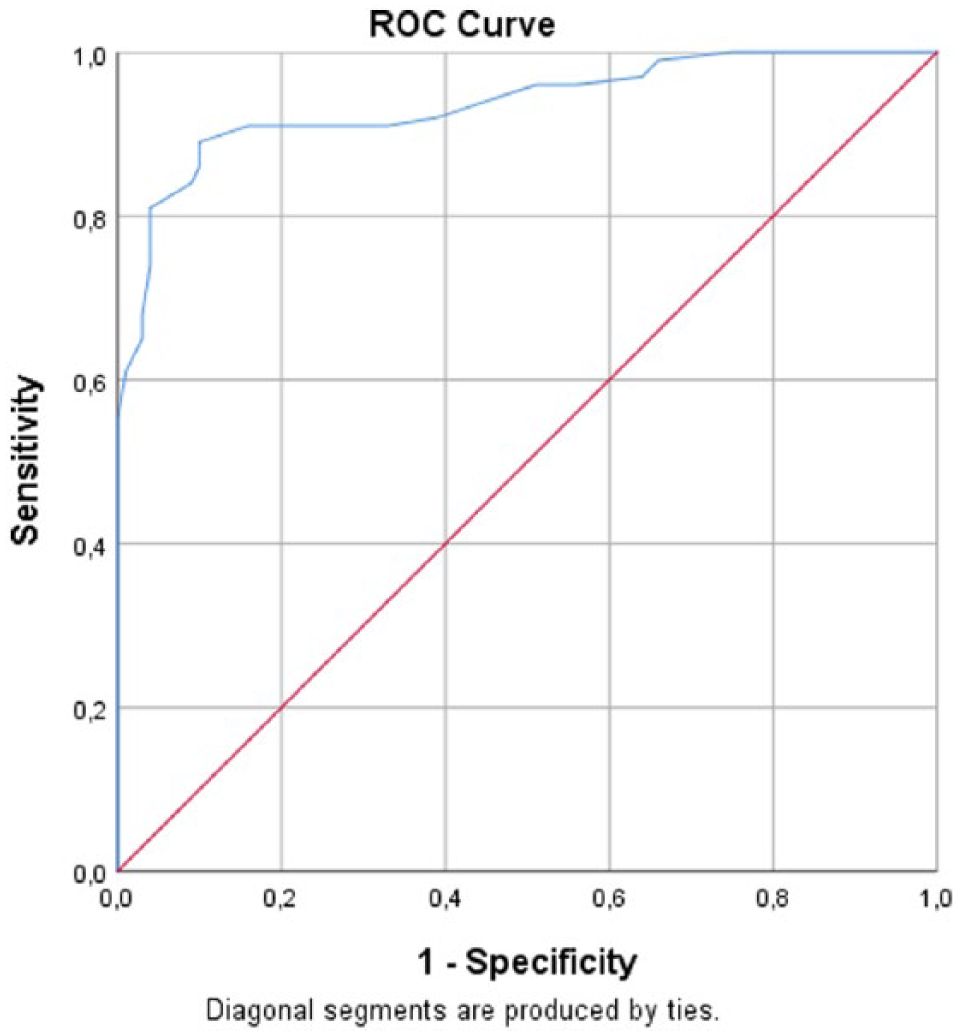
Receiver operating characteristic (ROC) curve of ONSD in acute ischemic stroke.
All patients in Group A were visualized by brain CT. In 26 patients, ischemic area was detected in brain CT. In 74 patients, brain CT was normal. There was a significant difference between ONSD of healthy adults and patients with and without ischemia on brain CT. ONSD values of patients who had ischemic findings on CT were larger than the patients who had normal CT (p < 0.001; Table 2).
Comparison of ONSD of healthy adults and the patients with and without CT findings.
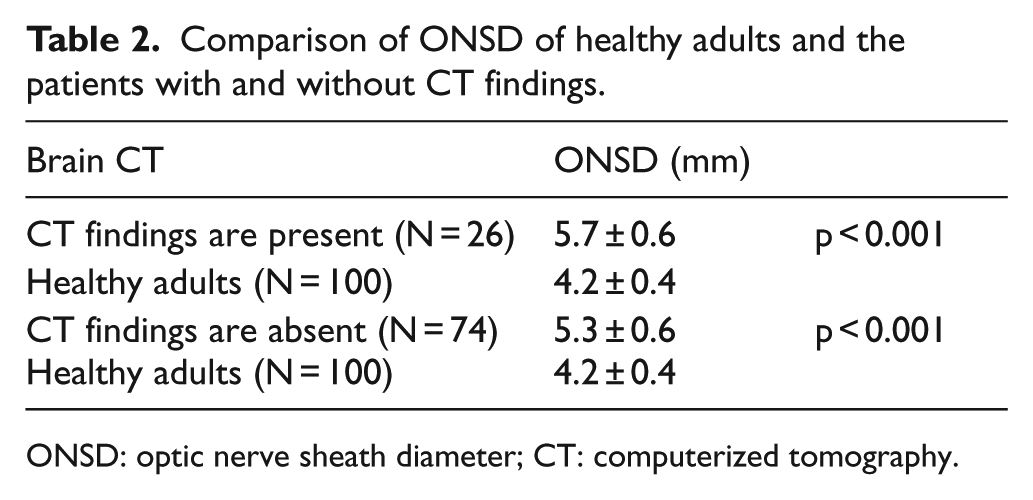
ONSD: optic nerve sheath diameter; CT: computerized tomography.
All patients in Group A were visualized by DWI. In 82 patients, ischemic area was detected on DWI. In 18 patients, DWI was normal. There was a difference between the ONSDs of healthy adults and patients with and without ischemia findings on DWI (p < 0.001). There was no difference in the ONSD values of the patients who have an ischemic area on DWI and who have normal DWI (Table 3).
Comparison of ONSD of healthy adults and the patients with and without DWI findings.
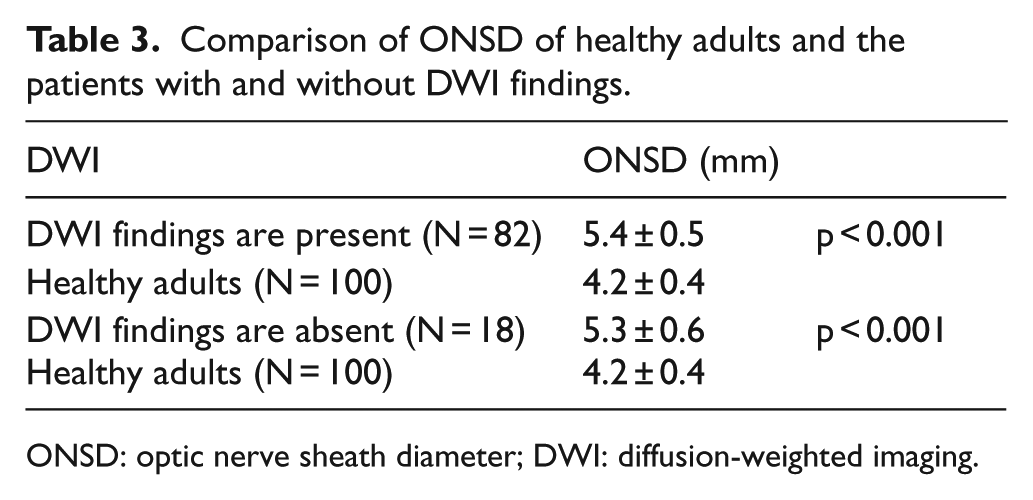
ONSD: optic nerve sheath diameter; DWI: diffusion-weighted imaging.
According to CT scans and DWI findings, there were 18 patients in Group 1, 56 patients in Group 2, and 26 patients in Group 3. Time from onset of symptoms to presentation to ED was shortest in Group 1. The widest ONSD was calculated in Group 3 (Table 4).
Comparison of the time from onset of symptoms to presentation to emergency department and ONSD of groups.
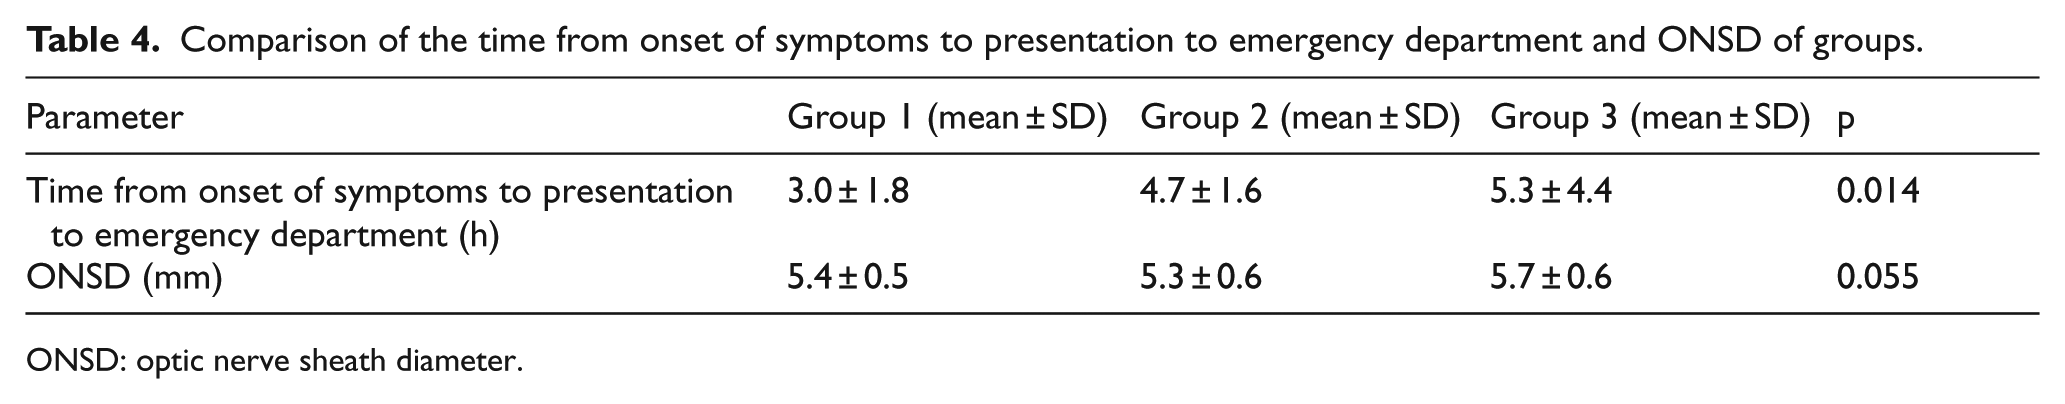
ONSD: optic nerve sheath diameter.
Overall, 76 (76%) patients were hospitalized to the neurology clinic and 24 (24%) patients were hospitalized to the neurology intensive care unit.
Discussion
Ultrasonography measurement of the ONSD is proposed as a non-invasive and quick measure to identify high ICP.8,10 In a study, the mean ICP of the patients whose ICP measured via LP was 215.3 ± 81.2 mmH2O, while ONSD had been calculated as 5.70 ± 0.80 mm in the right eye and 5.80 ± 0.77 mm in the left eye. In this study, a significant correlation had been found between ICP and the mean ONSD. 14 In other study, ONSD of the patients who had hemorrhage, mass lesion, acute infarction, edema, and shift on cranial CT had been calculated significantly higher than the patients who had normal CT. In this study, ONSD of the patients with pathological CT was 5.4 ± 1.1 mm, while that for the patients with normal CT was 4.1 ± 0.5 mm. 10 In a study in Chinese adults, normal range for ONSD found from 3.7 to 4.7 mm with a mean of 4.05 mm and standard deviation of 0.19 mm. 12 In other study, normal ONSD in healthy volunteers in Bangladesh has been found as 4.41 mm (4.25–4.75) with 95% of subjects. In this population, ONSD greater than 4.75 mm was reported as abnormal. 15 In a study researching alterations in ONSD according to cerebrovascular disease (CVD) subgroups, the comparison of the right and left ONSDs of CVD group and control group, the obtained results were found to be statistically significant. Besides, the highest right–-left ONSDs were detected to be in total anterior circulation infarction group. 16 In our study, the ONSD was observed to be dilated in patients with AIS than healthy adults. The ONSD of healthy adults was measured 4.2 ± 0.4 mm, whereas it was found to be 5.4 ± 0.6 mm in patients with AIS. In addition, in our study, according to CT findings, patients with AIS were compared with healthy adults. The ONSD of the patients with and without ischemic area on CT was larger than healthy adults. Likewise, according to DWI findings, patients with AIS were compared with healthy adults. Similarly, in all patients with and without ischemic area on DWI, ONSD was larger than healthy adults. These results suggest that the BE and ICP develop with the onset of ischemia. For this reason, ONSD increases with ICP. Therefore, in our study, we determined the cutoff value of ONSD indicating increased ICP due to ischemia. When the cutoff value for ONSD was determined as 4.7 mm, the sensitivity and specificity of this value were found 89% and 90%, respectively.
BE occurs in the ischemic area. In this case, ONSD may be expected to be larger on the side of the BE. As a result, the ONSD difference between both eyes will occur. In a study evaluating the ONSD difference between both eyes, in patients with a detected unilateral structural lesion on CT scans, the ONSD difference was measured 0.97 mm, while in patients without pathology on CT scans, it was measured 0.45 mm. 10 Based on this information, we compared the ONSD difference of both eyes. Interestingly, the ONSD difference of both eyes was found to increase in AIS patients. The ONSD difference was calculated as 0.07 ± 0.06 mm in healthy adults, whereas it was calculated as 0.29 ± 0.06 mm in AIS patients. Our results are different from other study because the patients with AIS were compared with healthy adults in our study. Also, patients with hemorrhage and mass lesion on CT were not included in our study. Therefore, the ONSD difference of both eyes can be used in the early diagnosis of AIS.
Advanced imaging technologies have dramatically changed the approach to AIS management. Noncontrast CT scan is used to assess for early signs of infarction.3,17,18 However, detection of early signs of ischemia on CT varies among experienced observers, depending on the size of the infarction, the time between symptom onset and imaging, and the CT window and level settings used. DWI is more sensitive for detecting ischemic changes compared with CT. Therefore, DWI may be reserved for selected patients in whom the clinical diagnosis is uncertain.1–3,18,19 In our study, the patients with AIS were divided into three subgroups according to CT scans and DWI findings. Time from onset of symptoms to presentation to ED of the patients who had normal CT and DWI were calculated as 3.0 ± 1.8 h, while 5.3 ± 4.4 h in patients who had ischemic findings on CT and DWI. The ONSD values of the patients with normal CT and DWI were 5.4 ± 0.5 mm, whereas the patients with ischemic finding on CT and DWI were 5.7 ± 0.6 mm. Besides, there was no difference in the ONSD values of the patients who had an ischemic area on DWI and who had normal DWI. However, time from onset of symptoms to presentation to ED of the patients who had ischemic area on DWI was longer than the patients who had normal DWI. These results suggested that the ONSD may change before CT/DWI. For this reason, ONSD can be applied to assist the diagnosis of AIS with other imaging techniques with negative results, especially in cases with normal CT scan and DWI. First three hours are important for thrombolytic therapy. This finding is important in terms of determining the patients to whom thrombolytic treatment will be applied. Therefore, ONSD can be applied to assist the diagnosis of AIS with other imaging techniques with equivocal/negative results, especially in potential thrombolytic therapy candidates.
Conclusion
In AIS, time is brain. For this reason, early diagnosis and treatment are important in AIS, as soon as possible. This study demonstrates that the ONSD increases in AIS and it increases earlier than CT and DWI alterations occur. Therefore, ONSD can be applied to assist the diagnosis of AIS with other imaging techniques with equivocal/negative results and treatment selection, especially in cases with normal CT scan and DWI.
Limitations
In our study, the ONSD of the patients was measured once in emergency department. The ONSD measurement could not be repeated in the clinical follow-up of the patients as there was no ultrasound device in the clinics.
Footnotes
Author contributions (Authorship)
N.K. and M.A. contributed to the study concept and design; G.C. and S.Y. contributed to acquisition of the data; N.K., M.A., and G.C. analyzed and interpreted the data; N.K., M.A., and S.Y. drafted the manuscript; N.K. and M.A. have done critical revision of the manuscript for important intellectual content; and N.K., M.A., G.C., and S.Y. have provided their statistical expertise.
Declaration of conflicting interests
The author(s) declared no potential conflicts of interest with respect to the research, authorship, and/or publication of this article.
Funding
The author(s) received no financial support for the research, authorship, and/or publication of this article.
Availability of data and materials
All materials were taken from other sources (including our own published writing), which were clearly cited.
Ethical approval
This study was initiated in the ED of a tertiary hospital following ethics committee approval.
Human rights
Our work does not infringe on any rights of others, including privacy rights and intellectual property rights. There is no human rights violation in our manuscript.
Informed consent
Written consent was obtained from all patients who participated in the study and their relatives.