
Abstract
Background:
Information on cardiac contractility is very important in resuscitation of critically ill patients. However, the measurement of ejection fractions by echocardiography is very difficult to perform for non-cardiologists. We developed a video clip to train emergency medicine residents to measure visual ejection fraction and compared the improvement in their interpretation ability with that following the conventional training method.
Objectives:
Improvement of interpreting ability of vEF in short period.
Methods:
A total of 27 multicentre emergency medicine residents were recruited and divided into conventional training group (N = 13) and video clip training group (N = 14). Self-training was done for 1 week. Pre-test and post-test comprising 20 questions were used for evaluation, and scores and interpretation time were recorded.
Results:
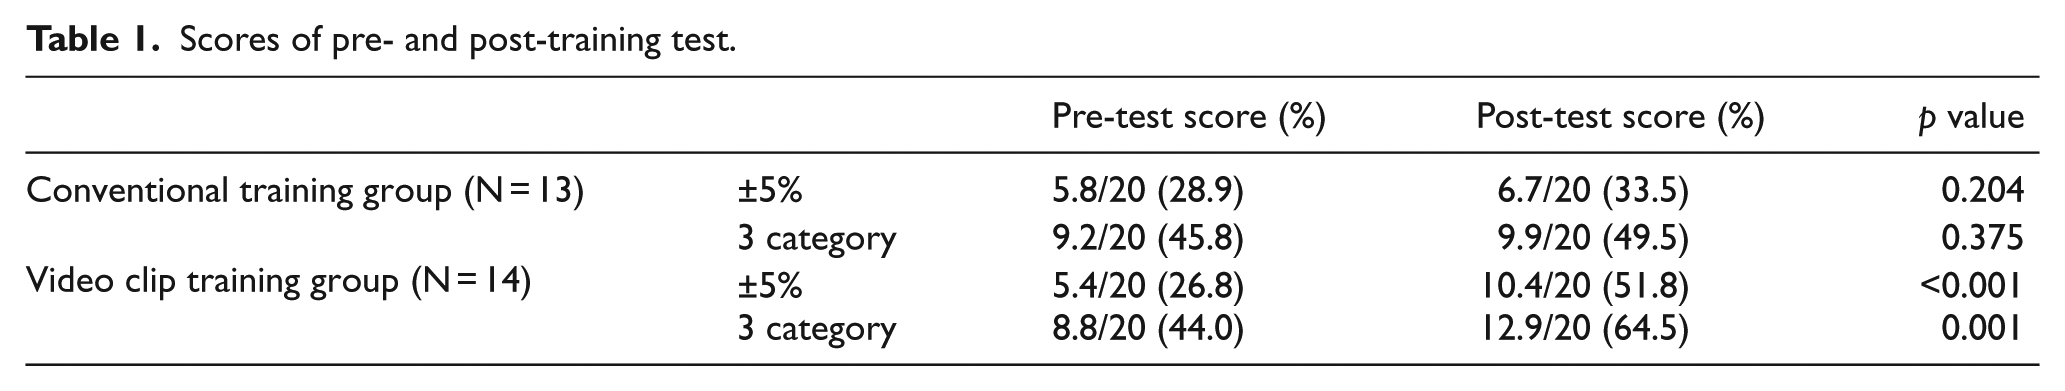
The score of the video clip training group showed a statistically significant improvement in contrast to the conventional training group (the score of pre- and post-test, ±5% scoring method: correct answer; video clip training group, 5.4/20 to 10.4/20 (p < 0.001) versus conventional training group, 5.8/20 to 6.7/20 (p = 0.204)). Furthermore, there was a statistically significant reduction in the interpretation time (interpretation time of video clip training group, 417.7–358.8 s (p = 0.005) versus conventional training group, 416.8–411.5 s (p = 0. 497)).
Conclusion:
In the video clip training group, interpretation accuracy improved, and the interpretation time was shorter than that of the conventional training group. Based on these results, we conclude that improvement in the visual ejection fraction interpretation ability by emergency medicine residents can be expected.
Introduction
To perform resuscitation of critically ill patients, clinicians need to interpret the patient’s information obtained through various monitoring devices along with physical examinations. To understand the causes of the shock, clinicians perform a comprehensive analysis of each piece of information about the patient’s condition. The more clinical information, the better it is to understand the patient’s condition. Cardiac output consists of the heart rate and stroke volume. Information on preload, afterload, and cardiac contractility is needed to determine the stroke volume. 1 To identify cardiac contractility, history taking, physical examination, and basic monitoring devices alone are inadequate, whereas invasive methods can lead to complications; moreover, cardiovascular magnetic resonance imaging is costly and time-consuming.2–6 The contractility of the left ventricle (LV) is mainly quantitatively measured by the ejection fraction (EF) of LV through echocardiography.7–10 However, the 2008 American College of Cardiology Foundation (ACCF)/American Society of Echocardiography (ASE) guidelines for echocardiographic training require a 3-month training period, 75 trials, and a total of 150 interpretations to reach a minimum level of expertise; such rigorous training is not feasible for non-cardiologists.11,12 Therefore, many clinical settings still depend solely on cardiologists to measure EF. However, there are many situations in which a cardiologist may be unavailable to evaluate in real-time the condition of hemodynamically unstable patients; furthermore, there is often a time limitation for the acquisition of clinical information regarding myocardial performance in a clinical setting. 3 In recent years, the use of ultrasound in clinical application by non-specialist groups has increased.13,14 The concept of “focus cardiac ultrasound” (FoCUS) has been introduced by simply training clinicians to evaluate the global LV, right ventricle (RV) function and size, presence of pericardial effusion, and intravascular volume. This test is not cost intensive, and the portable form of the device has become popular; furthermore, utilization rate by the non-specialist group is gradually increasing.13,15–17 Although FoCUS allows clinicians to monitor additional patients in real-time, the reliability of interpretation of the echocardiography results by these non-cardiologists is controversial. 16 Recently, various standardized FoCUS lectures have been developed, but there are no studies suggesting ways to improve FoCUS performance. 13 To improve the eye-balling technique used to perform FoCUS, we created a video clip, which is different from the quantitative measurement method that is currently used to train cardiologists and trained emergency medicine residents. The study presents a comparison between both of these methods.
Methods
Study design and populations
A total of 28 emergency medicine residents in the academic emergency department of five general hospitals participated from October 2017 to March 2018. One emergency medicine resident who was certified for echocardiography training program was excluded. We conducted a pre- and post-test to evaluate the effect of video clip training in comparison to that with conventional training. This study was approved by the institutional review board of National Medical Center in 19 October 2017 (IRB No. H-1709-082-005).
Making of the video clip
1. Video clip extraction
The video clip used in the study was developed by extracting formal ultrasound images from the echocardiography room. The systolic function of the heart, measured by regular ultrasound, was selected to be less than 5% between the Teichholz and biplane Simpson’s methods. Among these images, we extracted images taken over duration of more than two beats for continuous playing of moving images. For slide production, 120 formal echocardiography videos were extracted. Of these, 13 images with poor video quality were excluded. All video clips do not include any identifying patient information.
2. Video clip slide making
Each image was inserted into a Microsoft® Power Point™ 2010 slide, with each image having four views: parasternal long axis, parasternal short axis (papillary muscle level), apical four chamber, and subcostal (Figure 1 and supplementary data). The slides were provided to the video clip training group, and the EF values were revealed after a second mouse click at the bottom of the screen. The EF of the image was determined by the final EF value obtained using the biplane Simpson’s method. However, we applied the value obtained using the Teichholz method in cases where there were no data.
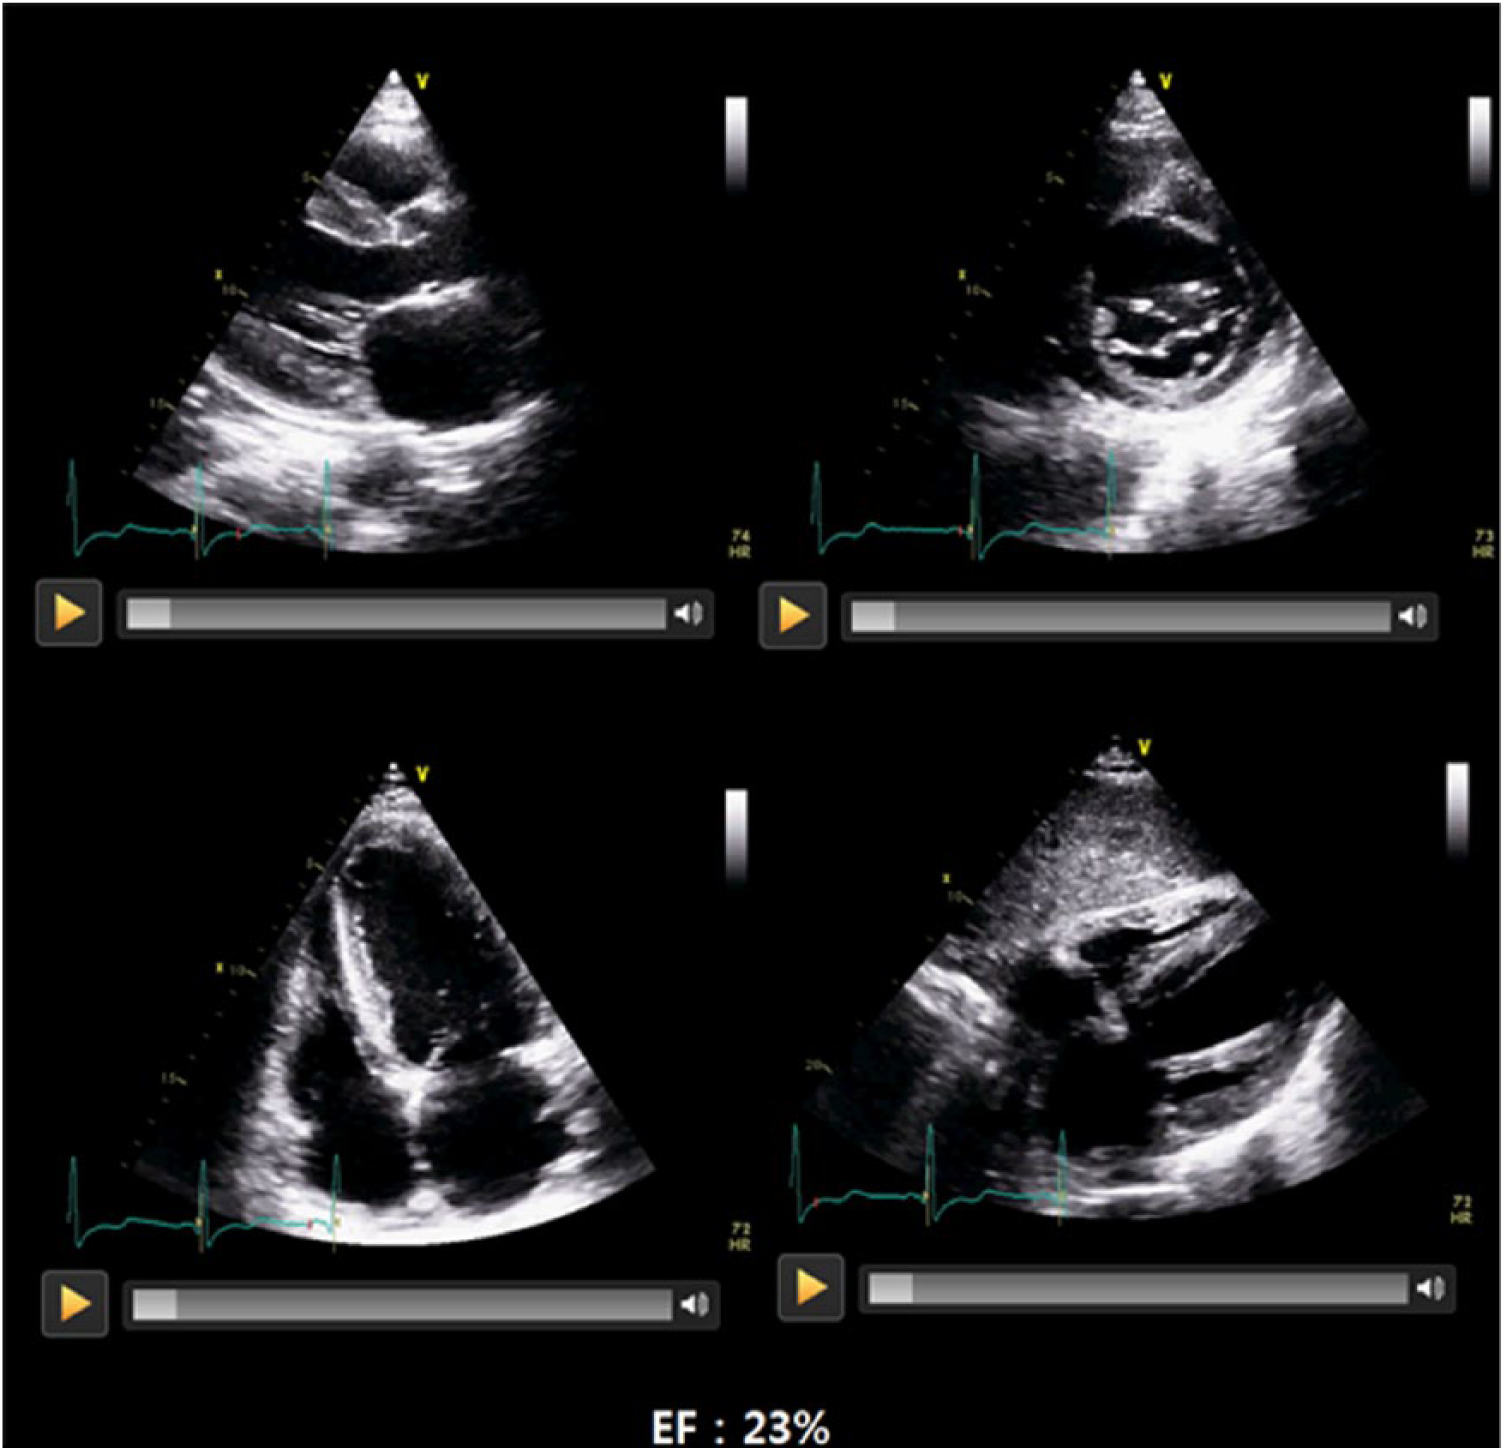
Video clips of the captured images. The parasternal long axis, short axis, apical four chamber and subcostal views are displayed simultaneously on the slide. Quantitatively measured ejection fraction appears at the bottom of the PowerPoint slide provided in the video clip training group after a second click of the mouse.
3. Evaluation of the video clip
To verify the slide, two cardiologists evaluated each video clip. (1) If the difference between the measured value and the vEF value exceeded ±5% of the cardiologist’s answer and (2) if the video clip had borderline vEF values (e.g. 35 ± 5%, 55 ± 5%), we assumed that the image could be evaluated in different categories depending on the evaluator and was excluded. Finally, 96 images with a reading difference of within ±5% were used in this study. We randomly selected 20 videos for pre-test, 40 videos for self-training, and 20 videos for post-test.
Experimental process
1. Pre-test
A recruitment notice was sent to 10 Emergency Medicine and Training Hospitals. From five hospitals, 27 emergency medicine residents voluntarily participated in the experiment; they were explained the purpose and method of the experiment, and they participated in the pre-test after providing written consent (Figure 2). In the pre-test, 20 slide shows were presented to estimate vEF. Next slide was showed following a mouse click after their interpretation was completed. The interpretation time was measured. The answer sheets were self-reported.
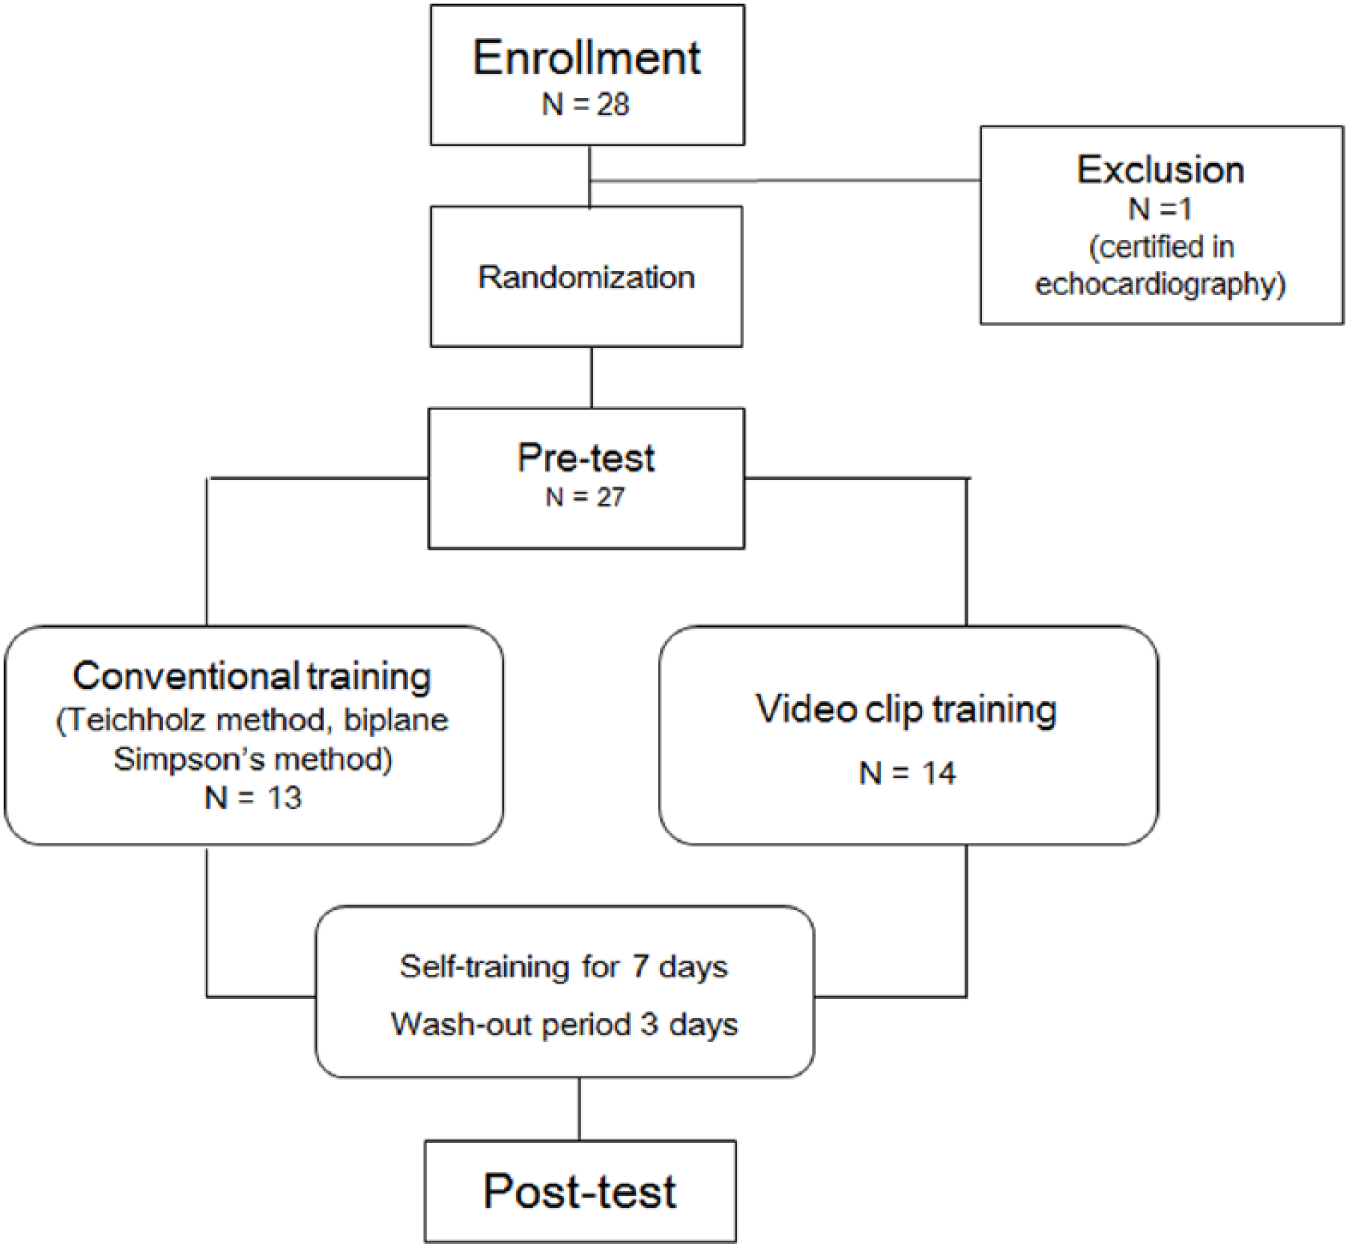
Study flowchart.
2. Randomization and self-training
Experimental subjects were randomized and divided into two groups: a conventional quantitative measuring group (13 participants) and a video clip training group (14 participants). For the conventional training group, training was provided in ultrasonic handling, Teichholz method, and biplane Simpson’s methods for 1 h, and EF of the patients was measured at the clinical site. The video clip training group was provided 40 slides (four views per slide) separate from the pre-test and post-test, so that they could learn on their own. Each group was assigned a self-training period of 1 week, following which they participated in the final experiment with a wash-out period of 3 days.
Each group was required to perform self-training in the given period, and the following minimum requests were made for active participation. In the conventional group, they were requested to evaluate three cases per their duty time under guidance of their staff. In the video clip group, they were requested to review at least once a day.
3. Post-test
Post-test was performed with 20 video clip slides not provided in the pre-test.
4. Scoring method
In each test, the scores were evaluated for correct answers and wrong answers in two ways. First, if the EF evaluated by the participant was within ±5% of the actual value, it was evaluated as the correct answer. Second, we evaluated whether the numerical category evaluated by the participant corresponds to the actual image category. The criteria were normal (>55%), mild to moderate dysfunction (35%–55%), and severe dysfunction (<35%).
Statistical analysis
The sample size calculation was based on our preliminary study with effect size between 0.65 and 0.80. For such effect sizes to achieve a power of at least 80% using the independent samples t-test, at least 24 participants were needed. The data were analyzed using the SPSS software (IBM SPSS statistics for Windows, version 20.0, Armonk, NY: IBM Corp). Difference between pre-test and post-test results in the conventional training and video clip training groups were analyzed using Wilcoxon signed-rank test. Pearson’s correlation coefficient (R) was used to assess correlation between the cardiologist-measured EF and the emergency medicine resident–measured EF. A value of p < 0.05 was considered significant.
Results
Change in interpretation ability
The conventional training group performed 16.8 cases and the video clip training group reviewed slides for self-training 3.8 times on average. The correct answer rate according to the ±5% criterion and the three categorical criteria in the pre- and post-test are shown in Table 1. There was no difference between the two groups in the pre-test scores. A statistically significant improvement was noted in the video clip training group. When the ±5% criterion was evaluated, in video clip group, 10.4 out of 20 questions were correct. The correct answer rate was 51.8%, increased by 5.0 points (25%; p < 0.001). When the three categorical criteria were evaluated, in video clip group, 12.9 of 20 questions were correct. The correct answer rate was 64.5%, increased by 4.1 points (20.5%; p = 0.001; Figure 3).
Scores of pre- and post-training test.
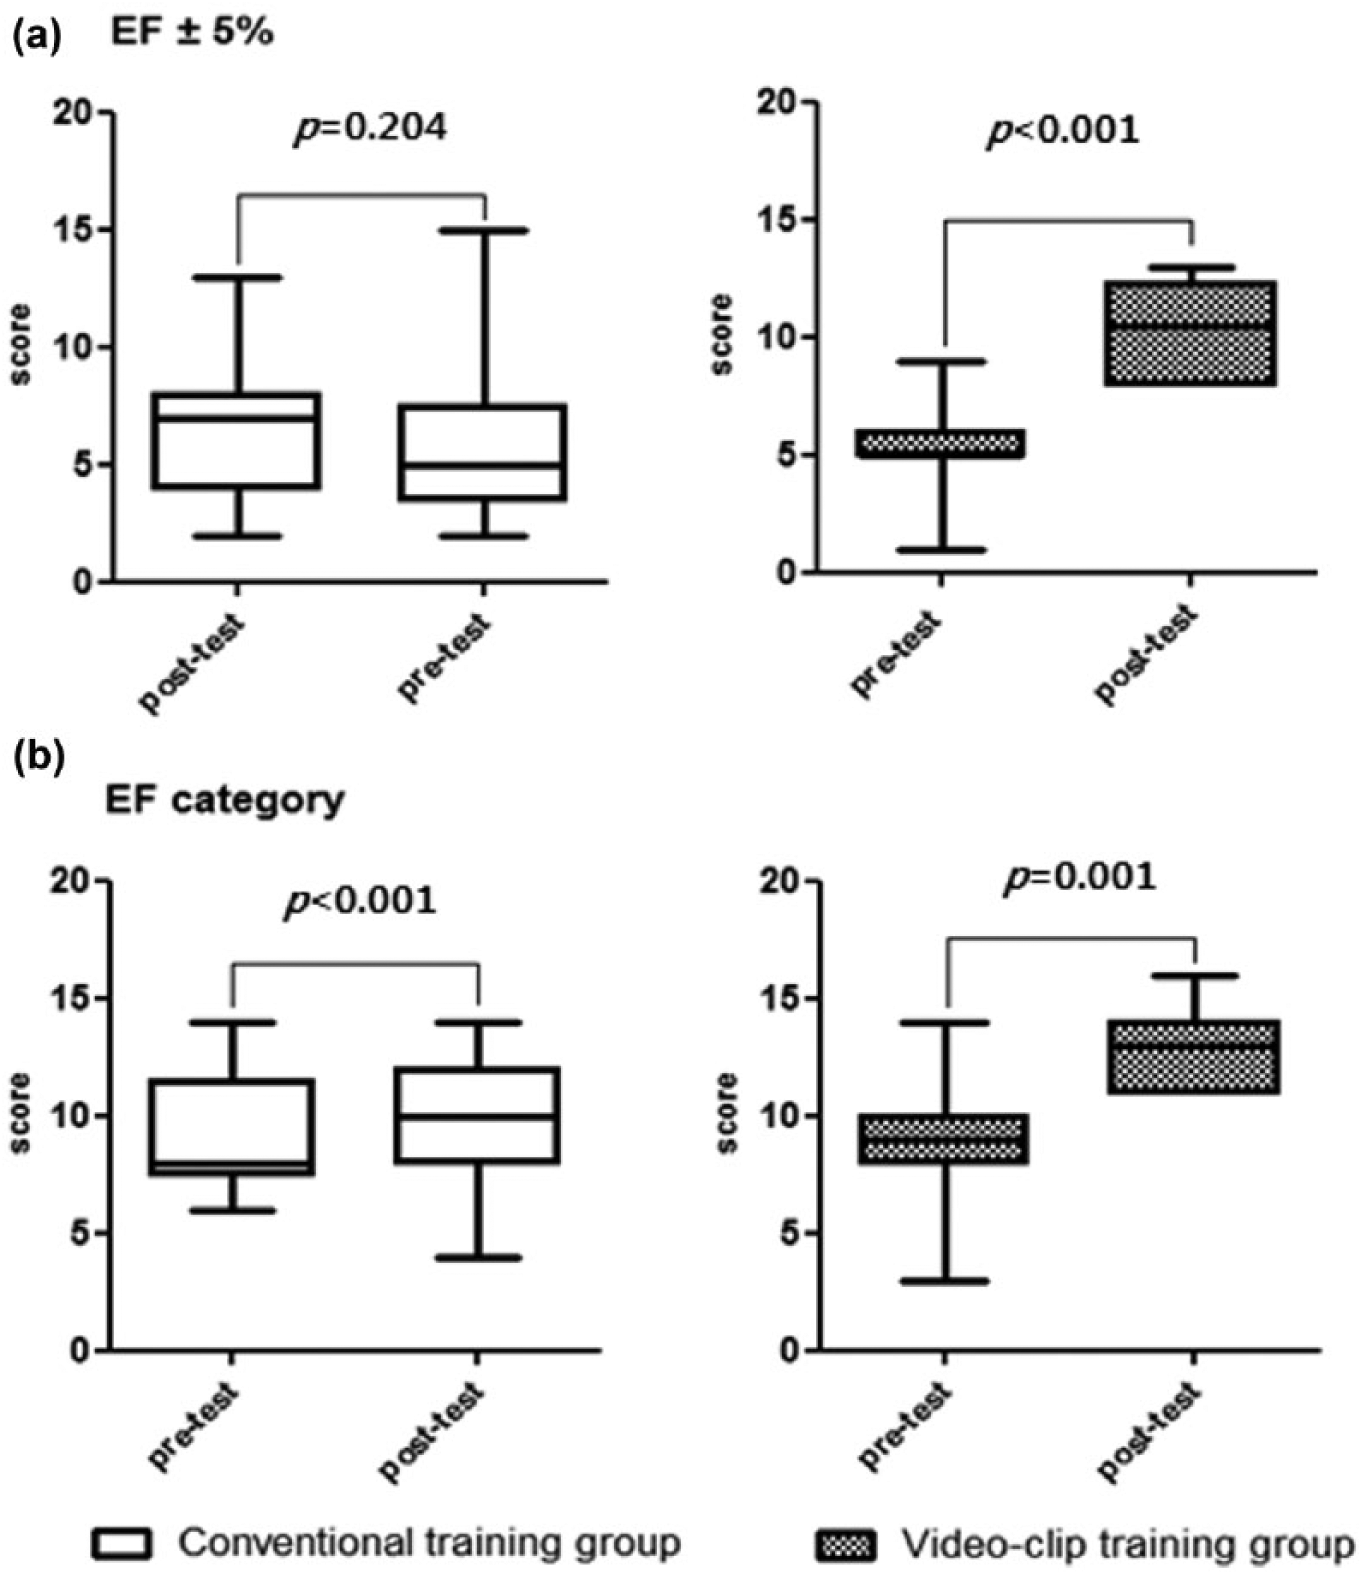
Scores of pre- and post-training tests: (a) the scores difference in each group when the correct answer is defined within 5% and (b) the changes in score if the quantitatively measured EF category is equal to the participants’ answers.
Correlation analysis was performed to evaluate the correlation between the vEF value measured by the emergency medicine residents and the EF value measured by the cardiologist. The correlation between the vEF value measured after video clip training and the actual measured EF value was the best (excellent correlation, R = 0.751; Figure 4).
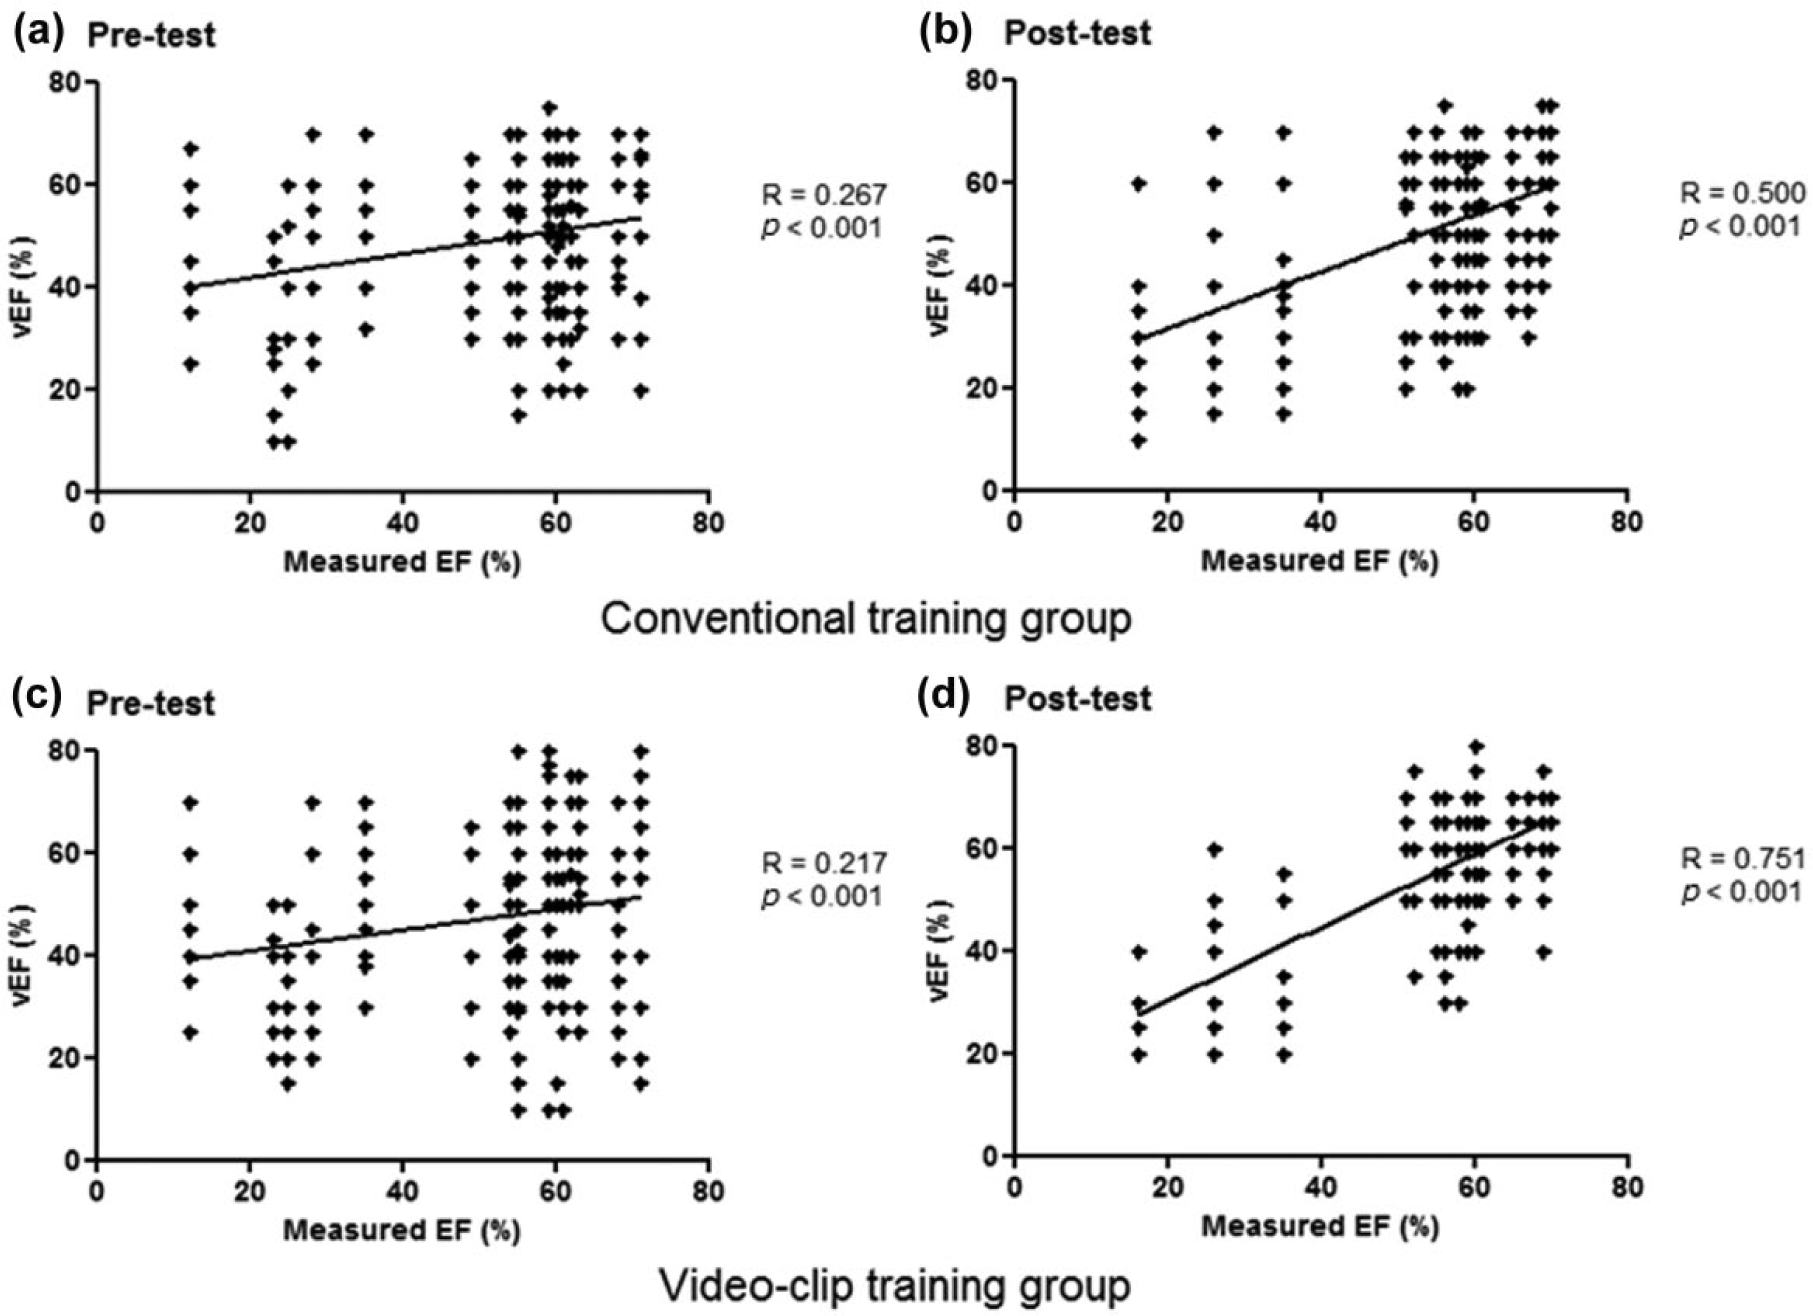
The scatter plot shows the correlation between the cardiologist-measured EF (x-axis) and the emergency resident’s vEF (y-axis). The correlation coefficient (R) increased after training in both groups. Pre-test R in both groups are similar, but there is significant increase in the post-test R of the video clip training group in contrast to that in the conventional training group. vEF: visual ejection fraction.
Change in interpretation time
In the comparison of reading time between the two groups, the reading time of the video clip training group decreased significantly from 417.7 to 358.8 s (p = 0.005), and the reading time of the conventional training group did not change significantly from 416.8 to 411.5 s (Figure 5).
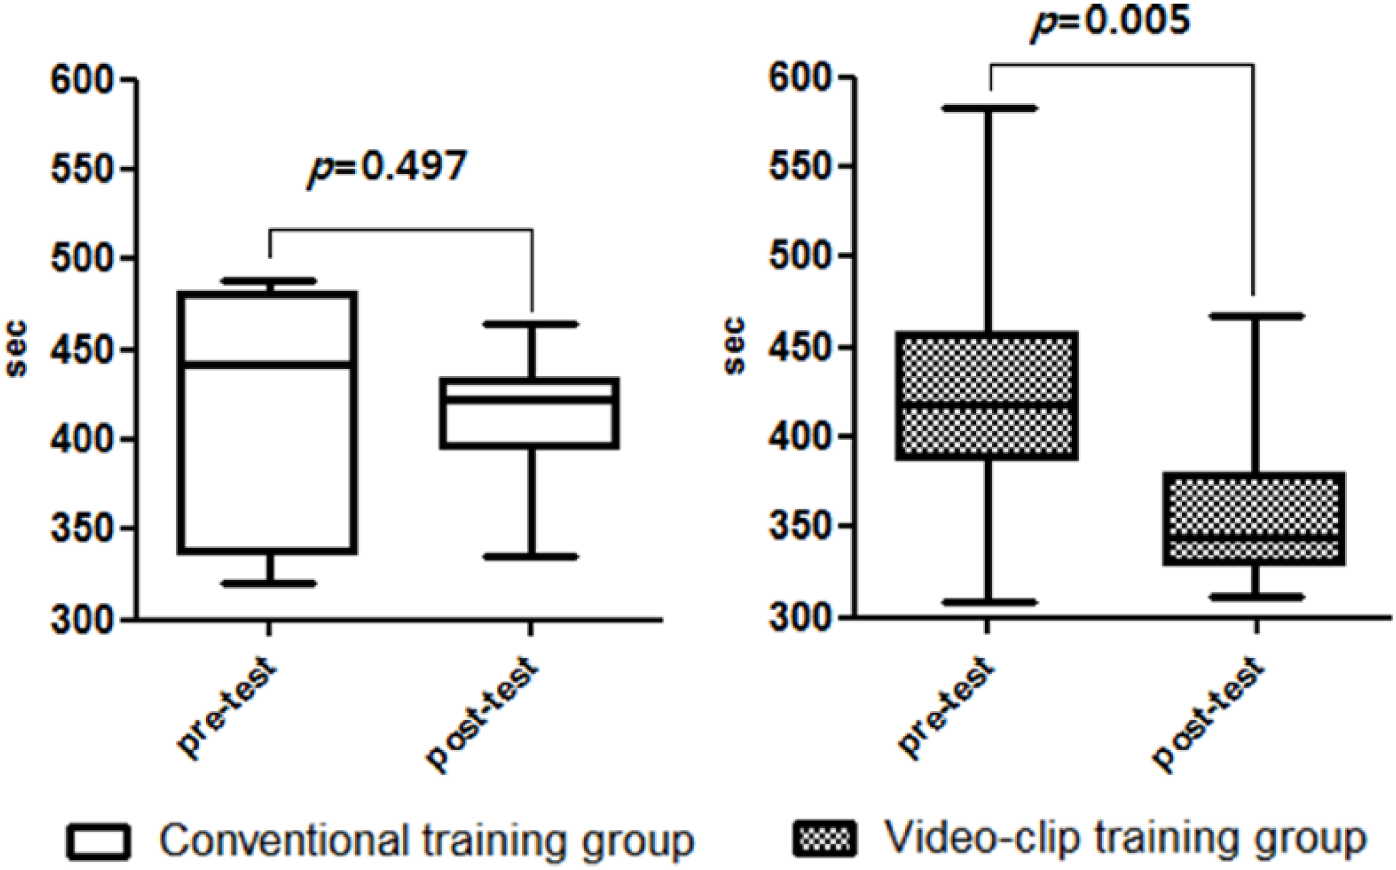
Interpretation time in pre- and post-test.
Discussion
In the emergency department or intensive care unit (ICU) where resuscitation is performed for critically ill patients, the clinician should be able to identify the cause of the shock based on the clinical information of the patient. However, physical examinations and invasive or non-invasive monitoring devices alone may not be sufficient to identify whether the cause of the shock is due to heart dysfunction. 18
Evaluation of cardiac contractility by echocardiography is quantitatively assessed primarily through the Teichholz and the Simpson methods. However, it is difficult for non-cardiologists to train to this level of quantitative evaluation expertise.
Since the early 1990s, the concept of FoCUS has been introduced and known to non-cardiologists (especially intensivists and emergency physicians); it has also been applied in various clinical settings.15,17 FoCUS is defined as an echocardiography technique that is limited to immediate decision-making at the bedside according to the patient’s chief complaint, unlike diagnostic echocardiography (so-called formal echocardiography). It is also referred to as a point-of-care cardiac echocardiography or limited echocardiography. 18 FoCUS has recently been known to be useful for non-cardiologists. A study for surgical intensivists found that the reasons for shock were identified for 87% of the patients, and the management strategy was changed for 54% of the patients according to FoCUS. 19 In addition, in a study for medical intensivist, LV function, presence of pericardial effusion, and inferior vena cava size were evaluated by FoCUS for 90 critical patients, and the treatment was changed in 37% of the patients. 20
In FoCUS, the systolic function is evaluated as a visually estimated EF (the eyeball method). It is known that the EF measured by this method does not show any significant difference from quantitative methods. In a previous study, two emergency physicians measured the vEF of 133 patients and assessed the systolic function as normal or decreased levels. Then, they compared the results to the quantitative method measured by a formal echocardiography performed by a cardiologist. The sensitivity and specificity of the decreased cardiac function measurement by the vEF of the emergency physician were reported as 98% and 86%, respectively. 4 Similarly, in another study, intensivists reviewed 44 formal echocardiography performed in medical ICUs after minimal training, and they were interpreted as normal, mild to moderately, and severely decreased in systolic function with an accuracy of 82%. 3
The results of the above studies suggest that we can use FoCUS without training to perform formal echocardiography to manage critically ill patients in the clinical field, and the evaluation achieved using FoCUS is comparable to that using quantitative evaluation methods performed by a cardiologist. However, although many studies commonly reported that the interpretation of cardiac systolic function was accurate and that FoCUS was helpful in the management of critically ill patients, they did not provide precise recommendations on the training approach. The European Association of Cardiovascular Imaging emphasized a standardized training system for the safety and efficacy of focused echocardiography for emergency care in view of an increasing number of FoCUS being performed by non-cardiologists without professional training. 13
Through this study, we suggested video clip training as a learning tool for evaluating systolic function in FoCUS that has proven to have clinical efficacy and accuracy even when performed by non-cardiologists. In previous studies regarding FoCUS, a skilled cardiologist trained unskilled physicians directly for a short period or provided immediate feedback; in contrast, we developed a video clip training program to improve the interpretation ability20–22 so that the cardiologist is practically unable to intervene to train the non-cardiologists’ reading ability. To assess the improvements in the interpretation ability of vEF, we compared the accuracy of interpretation and the reading time between the two groups. Conventional training for 1 week did not improve the interpretation ability; in contrast, video training resulted in marked improvement. According to the ACCF/ASE recommendations, the low performance in the conventional training group could be attributable to the short training period, which was much below the minimum required level of 3 months. In addition, because the feedback was not given promptly by the expert, the participants were considered to have limited training. Conversely, the iterative learning approach of the video clip can be applied alone and the feedback is provided through an immediate answer following a mouse click. Therefore, it was possible to observe a noticeable improvement in the interpretation ability of the participants in the video training group even after a short period of time. Based on our observations, the accuracy of vEF interpretation (64.5%) was lower than that in previous studies (80% or more), 3 which may be attributable to the fact that these studies enrolled specialists of emergency medicine and intensive care medicine unlike in our study. Therefore, the difference in the degree of improvement after training was based on basic knowledge and the prior experience of the participants. Because we intended to confirm the training effect of video clips in unskilled participants, specialists, and those who had passed the echocardiography certification examination in advance were excluded. After randomization, pre-test scores of each group were not statistically different. In addition, our study applied two different scoring criteria than that used in the previous study. Previous studies have categorized the accuracy of interpretation in two patterns ((normal vs decreased) or (normal vs mild to moderately decreased vs severely decreased)).
In addition, the measured EF ± 5% was considered the correct answer to confirm the accuracy of the vEF value as a continuous variable. This was possible because the measured video clip was visually estimated by two cardiologists within the error range. In addition to the two scoring methods, we analyzed the tendency to approach the correct answer through the correlation analysis between the measured EF and the responded vEF.
Our study has three limitations. First, this study included multicentre emergency medicine residents. Therefore, it was difficult to control the quality and quantity of learning during the self-learning period. To overcome this limitation, we encouraged their participation during the pre-test. However, the degree of self-training of the participants could not be uniformly adjusted. Second, the video clip training group was limited by the echocardiography probe not being performed directly on the patient; however, our focus was to only improve the interpretation ability. Therefore, improvement in the probe-handling technique, one of the difficult parts of echocardiography, cannot be expected through video clip training. Third, because of experimental design, it was impossible to perform the test on standard patients; this is because a sufficient number of patients with the same systolic function could not be enrolled at the same time.
Conclusion
In this study, the video clip training group showed improvement in vEF reading ability, and the reading time was reduced in comparison to that of the training group that underwent training using the existing quantitative measurement method. We intend to develop more simple and rapid vEF training programs for non-cardiologists who can be used immediately in the clinical field.
Footnotes
Acknowledgements
E.Y. conceived the study, designed the trial, and wrote the manuscript with support from T.P. W.Y. provided statistical advice on study design and analyzed the data. J.-I.K investigated and supervised the findings of this work. S.C. and J.C. contributed to data selection and verified the trial. J.K., Y.J.L., and G.C.C. performed the experiments and data collection. All authors discussed the results and contributed to the final manuscript. Each video clip does not include any patient’s private information.
Declaration of conflicting interests
The author(s) declared no potential conflicts of interest with respect to the research, authorship, and/or publication of this article.
Funding
The author(s) received no financial support for the research, authorship, and/or publication of this article.
Availability of data and materials
The data are attached at the time of the submission.
Ethical approval
This study was approved by the institutional review board of the National Medical Center in 19 October 2017 (IRB No. H-1709-082-005).
Informed consent
From five hospitals, 27 emergency medicine residents voluntarily participated in the experiment; they were explained the purpose and method of the experiment, and they participated in the pre-test after providing written consent.
References
Supplementary Material
Please find the following supplemental material available below.
For Open Access articles published under a Creative Commons License, all supplemental material carries the same license as the article it is associated with.
For non-Open Access articles published, all supplemental material carries a non-exclusive license, and permission requests for re-use of supplemental material or any part of supplemental material shall be sent directly to the copyright owner as specified in the copyright notice associated with the article.