
Abstract
The existing literature on finance, debt, and inequality depicts economic elites as a creditor class. According to a popular thesis, over the past four decades, the rich and ultra-rich households have experienced a saving glut (excess income), which they have invested in the debts of the poor and their governments. While it is undeniable that the rich have expanded their income share at the expenses of the poor, to refer to them as ‘creditors’ or ‘lenders’ is a misrepresentation of how they actually expand their wealth and income shares by financial means. For it conceals the fact that a great deal of their investments is leveraged, that is, carried out with borrowed money. This article shows that the debts generated for the sake of affluent households easily surpass those of all other households. However, these debts are not accounted for in statistics on household debt. This is because affluent households, particularly multi-millionaires and billionaires inside the top 1%, do not simply borrow from banks, like normal households do, but they are instead absentee debtors who borrow through corporate structures of which they are dominant shareholders and ultimate beneficiaries. To gain an insight into their invisible leverage, the article looks at how much hedge funds borrow and why their leverage matters.
Introducing absentee debtors
Over the last two decades, critical social theorists and mainstream economists alike have come to share a common sense on the relationship between debt and inequality: since the 1980s, impoverished households have borrowed part of the extra income that enriched households – the top 1 to 5% of the wealth and income distribution – have been able to save due to a variety of reasons. 1 This has been recently referred to as the ‘saving glut of the rich’ (Mian et al., 2021). More specifically, the current received wisdom is that excess saving by higher-income households has progressively pushed interest rates down and eased access to credit starting from the mid-1980s. Lower-income households have taken advantage of cheap credit to compensate for stagnant or declining income and access housing ownership – whence the early 2000s subprime mortgage bubble. 2 While for some the saving glut has contributed to greater financial inclusion, for others, credit has served as an apparatus of predation and capture on the indebted poor (e.g. Lazzarato, 2015). Others still have seen it as a trade-off where the poor were offered cheap credit in lieu of higher wages and more progressive income taxation systems (e.g. Rajan, 2010). Either way, scholars agree that this new social compromise has caused greater financial instability: on the one hand, as the poor became addicted to cheap credit, they increased their family debt burdens; on the other hand, as the rich struggled to generate returns on their capital, they were incentivized to take on more speculative, high-yield strategies (a ‘search for yield’). Altogether, these twin dynamics have led to an environment of risk, moral hazard, and economic sluggishness.
Notably, the idea that a saving glut of the rich is bound to lead to a doom loop of leverage and financial instability is not at all incongruent with early Marxist analyses of financialization as an offshoot of the ‘overaccumulation of capital’ or else the persistent emergence of ‘surplus capital’ (Lapavitsas 2013). The latter is a pool of excess saving that cannot be profitably reinvested in production or, to use the language of proponents of the saving glut, the manifestation of a ‘chronic tendency of private investment to be insufficient to absorb private saving’ (Lukasz and Summers, 2019: p. 1). Taking the shape of ‘fictitious capital’, ‘interest-bearing capital’, and ‘money-capital’, surplus capital (which is often simply referred to as ‘finance capital’) becomes the matrix for the mass production of financial claims on the income generated by an already sluggish economy – claims that function as a private tax that syphons value off industries and further stifles growth in the long term. In this process, financial intermediaries and markets take the centre stage as the primary drivers of both money-making and secular stagnation. Financial expansion, or financialization, is therefore the sign of the Autumn, as Braudel (1984) famously put it: a Belle Epoque for creditor-rentier elites that nevertheless preludes to the breakdown of a maladapted capitalist system plagued by a cancerous proliferation of debt, permanent financial instability, and recurring crises.
The saving glut argument is also compatible with the Post-Keynesian ‘functional income distribution’ literature. The latter relies on a ‘stock-flow consistent modelling’ (SFCM) framework that, similarly to the saving glut argument, rests on a dichotomous division of the household sector into ‘creditor’ capitalists and ‘debtor’ workers (Szymborska, 2022). To be clear, the parallels between the mainstream scholarship on the saving glut and the heterodox traditions should not be overstated, as the theories, methodologies, and policy recommendations informing these literature studies may vary dramatically. However, they all convey an image of present-day capitalism as a struggle between creditor elites and mass debtors: a fragile compromise whereby the rich and ultra-rich have come to lend money to everyone else as a temporary fix to an inequality crisis they refuse to address. Alas, this consensus view is missing a crucial point: over the past 40 years, and especially in the last quarter century, rich and ultra-rich households have been generating more debt than anyone else, as they have greatly leveraged their investments in both property and financial markets. Crucially, they have done so through a combination of direct borrowing from banks and indirect borrowing via corporate structures of which they are dominant beneficial owners.
In this article, I will refer to the levered-up rich as absentee debtors (see also Sgambati, 2022), an original take on Veblen’s famous notion of ‘absentee ownership’. The latter is sometimes used as synonymous with ‘rentierism’, ‘shareholderism’, and ‘patrimonialism’ (e.g. Christophers, 2020; Mazzucato, 2018; Piketty, 2014). All these notions point to a passive role for economic elites who are thought to extract value from society by merely owning assets (directly or through the asset management complex). Veblen, however, did not think of absentee owners as mere rentiers, shareholders, or patrimonial capitalists. Instead, they were businesspeople, both owners and managers of ‘going concerns’ which they treated as ‘investments of funds’. While they had lost a technical understanding of the industrial processes their businesses superseded, absentee owners were nevertheless active on the financial end of things, as their ‘attention and energies were taken up more and more exclusively with the run of the market, with margins of cost and profit, and especially with ever-increased exactions and opportunities of credit investment’ (Veblen, 1997: p. 257). Their being absent (from the industrial process) did not make them any passive or ‘functionless’ (to say it a la Keynes) but on the contrary allowed them to take the lead as ‘captains’ and ‘lieutenants’ of finance, focussing on money-making through the ‘larger use of credit’ (Veblen, 1997: p. 326). 3
It goes without saying, as prescient as Veblen’s vision of 20th century capitalism might have been, things have changed since the time of J. Piermont Morgan. The financial sector has grown bigger and is far less leverage constrained. In the wake of institutional transformations in banking – innovations in asset and liability management, leading to the institutionalization of ‘shadow banking’ and ‘market-based banking’ – big banks 4 have vastly increased their infrastructural capacity to expand their balance sheets through capital market leveraging and money market funding, to accommodate the ever-growing demand for credit by governments, households, corporations, and, not last, the financial sector itself (Knafo, 2021; Sgambati, 2019). The plethora of alternative investment funds available to ‘high net worth individuals’ (HNWIs) 5 that have sprouted out over the past two or three decades have generated tremendous pressures for higher levels of leverage within the financial sector, both on- and off-balance sheet (through derivatives and shadow banking). It is estimated that between 10 and 14% of the wealth of global HNWIs is invested in highly levered alternative investment firms – for example, hedge funds, private equity, and structured products – while another 20–30% is invested in equity shares of both financial and non-financial corporations (Capgemini, 2023: p. 10), which have increased their leverage ratios over the past decades as part of shareholder value maximization strategies (Baines and Hager, 2021).
On this ground, to call the global rich ‘creditors’ or ‘lenders’ is to mystify the fact that when they invest, they do so through the agency of highly levered-up funds, trusts, and corporations of which they are dominant shareholders and beneficiaries. For this very reason, the debts of the rich are invisible for the most part, legally separated from them, unaccounted for by statistics on household finances, even brushed off the balance sheets of both the big banks and the corporate structures to which big banks lend. Except for a minority of owners-managers, absentee debtors lack a technical understanding of how the corporate structures they are invested in make use of leverage to generate profits, and thus prefer to leave the business of storing and growing their wealth to their family offices, personal trusts – for example, the Bill and Melinda Gates Foundation Trust – and other legal proxies, including endowments, charities, and philanthropies, which are often structured as for-profit limited liabilities companies (LLCs) – for example, the Chan Zuckerberg Initiative. For absentee debtors, leverage is at once a technology of debt finance, money-making, and, not least, tax avoidance, as it enables novel forms of shielding against creditors, including the fisc.
In this respect, the article makes a conceptual-theoretical contribution to current debates on finance and inequality by bringing to the fore the much under-theorized problem of how and why the most affluent households in society borrow, rather than lend. Alas, a comprehensive analysis of how absentee debtors leverage their investments in property, business, and financial markets is beyond the scopes of this article, as this would require an in-depth analysis of the whole of financial and non-financial corporate sectors’ leverage. Instead, its key objectives are (a) to provide a methodological-theoretical critique of the saving glut or the rich (in section two) and (b) to show that a sizeable amount of financial sector debt is the outcome of leverage strategies that are mandated by, or are anyway for the benefit of, affluent households (in section three). This is achieved through an original empirical investigation of hedge fund leverage (in sections three and four) that relies on a combination of primary and secondary sources. 6 The case of hedge funds is in turn used to illustrate why the leverage of the rich matters and how it affects power dynamics within global financial markets and the asset management complex (in section four).
The problem with the saving glut of the rich
The ‘saving glut of the rich’ thesis (Mian et al., 2021) points to a secular increase in the share of savings by top 1% households in the US that has not been accompanied by a rise in net domestic investment but has instead gone along with substantial dissaving by the US federal government and the rest of the household sector (particularly the bottom 90%, or the ‘non-rich’). The authors conclude that the growing debt of both government and non-rich households has been financed by rich households. They thus clarify that the rich do not directly lend to the non-rich and the government. Instead, ‘they hold a variety of assets which ultimately finance borrowing by others’ (Mian et al., 2021: p. 25). In particular, the rich own money market and mutual fund shares, which in turn own portfolios of public debt and agency securities (which fund mortgages). Significantly, they also finance the borrowing of others indirectly, through their shareholdings of nonfinancial corporations, which ‘have increased their holdings of money market funds and time deposits substantially since the mid-1990s, and these time deposits and money market funds are claims on debt through the financial system’ (Mian et al., 2021: p. 2). 7 To operationalize their argument, the authors develop a methodology that purports to ‘unveil’ the financial sector through a detailed decomposition of the Financial Accounts of the United States (the ‘Flow of Funds’). Their ‘basic idea is to remove the veil of financial intermediation to see who ultimately holds claims on financial assets such as household and government debt’ (Mian et al., 2021: p. 2). This unveiling exercise ‘allows for a calculation of net household debt positions across the wealth distribution’, defined as ‘household debt held as a financial asset minus household debt owed as a liability’ (Mian et al., 2021: p.2).
The problem with this accounting methodology is that it only focuses on net financial flows. The study’s starting point is national disposable income, and its goal is to determine the income ‘contribution to aggregate savings from different parts of the distribution of US households’ (Mian et al., 2021: p. 5). Finance, however, is not limited by the availability of disposable income but is instead the total volume of gross lending and borrowing, which are always a multiple of disposable income. As Borio and Disyatat (2015: pp.1-2) have pointed out, Saving, a national accounts concept, is simply income (output) not consumed; financing, a cash flow concept, is access to purchasing power in the form of an accepted settlement medium (money), including through borrowing. Investment, and expenditures more generally, require financing, not saving. And financing is a gross, not a net, concept: financing is necessary for all sorts of purchases, well beyond those associated with income flows, including those of existing financial and real assets.
To post-Keynesian economists, this is nothing new. As they have long argued, 8 and as mainstream economists have finally acknowledged in recent years (e.g. Jakab and Kumhof, 2015; McLeay et al., 2014), investment is dependent on credit, not saving, and credit is a function of the money-creating capacity of banks to meet the demand for loans. The saving glut, by contrast, is aligned with an outdated yet persistent notion that finance is a complex of intermediaries constrained by the availability of loanable funds. In other words, it works on the assumption that one’s saving is a determining factor of another’s borrowing. In this connection, it conceives of capital in neo-classical terms as a fund of saving and, in so doing, it confuses saving with financing: within its net-only accounting framework, having a net worth is analytically equivalent to being at once a saver and a creditor. Its underlying logic is simple: the rich save therefore they lend; the poor dissave therefore they borrow (from the rich).
The problem with this logic is twofold: first, it assumes that debt is equivalent to negative saving or dissaving. This is in line with the mainstream notion that household debt is a ‘consumption-smoothing’ device articulating a trade-off between spending more income today and saving less income tomorrow (due to interest payments). However, in the real world, most household debt is generated, not for consumption purposes, but to finance the acquisition of property and financial assets (Mason, 2018). In other words, taking on debt is predominantly a strategy by which households leverage their investments to acquire, rather than squander, wealth. This is linked to a second issue: insofar as the saving glut argument conceives of one’s borrowing as a function of another’s saving, it excludes in principle the rather obvious fact that one’s borrowing may be a positive determinant of one’s own saving. In effect, while savings and wealth are not determinants of bank lending, they are certainly determining factors of debtors’ borrowing, as bank loans are normally issued against eligible collateral (i.e. wealth) and they require a down payment or margin (i.e. excess income saved for the purpose of borrowing). Stated otherwise, in a financial system where purchasing power and leverage can be generated ex nihilo by the banking system, the significance of disposable income and wealth is not that they can be loaned out at interest but that they can be posted as collateral and/or margin to leverage one’s investments in property and financial assets. In such a system, leverage allows for incremental wealth gains over time due to its procyclicality. 9
Consider the following hypothetical example: Jones has zero assets and $1000 debt. Gates has $1.2 billion assets and $1 billion liabilities. Within the net-only methodological framework of the saving glut, Jones is a debtor while Gates is a creditor. More importantly, the saving glut assumes that the $1000 debt owed by Jones is financed out of the $200 million net worth owned by Gates. However, it says nothing as to who or what financed Gates’ $1 billion debt. Since proponents of the saving glut are only concerned with net financial flows, this question never surfaces, even though it is clear that Gates’ liability is far more consequential than Jones’ as it suggests that the assets held by the ‘creditor’ have been acquired through borrowing. This is, for instance, what hedge funds do on a regular basis. The net worth of a hedge fund is called ‘net asset value’ (NAV). This value practically corresponds to the hedge fund’s ‘assets under management’ (AUM) or else the overall value of the equity claims held by investors in the fund (IOSCO, 2020). The fact that a hedge fund typically enjoys a positive NAV does not make it a lender or creditor. On the contrary, a hedge fund is by definition a leveraged fund that uses its investors’ equity capital as a margin against which it can borrow several times the value of its NAV to multiply its ‘gross asset value’ (GAV) as well as its ‘gross notional exposure’ (GNE) 10 with a view to magnifying ‘return on equity’ (ROE).
Alas, proponents of the saving glut of the rich are not the only scholars who confuse wealth and credit and equate savers with lenders. This theme runs deep in today’s characterizations of contemporary finance and the power struggles it arouses. Creditor–debtor relations are usually understood from a net-only perspective. Creditors are thought to be individuals who have more assets than liabilities, while debtors are just the opposite. The two cancel each other out, and ‘[t]he difference between these two analytical categories is that some – the net creditors – receive more income from capital than they pay out, while others – the net debtors – pay out more interest than they receive’ (Di Muzio and Robbins, 2016: p. 13). This net-only view is narrowly focused on income and overlooks the significance of leverage as a mechanism by which borrowers empower themselves. In so doing, it inadvertently delivers an upside-down image of the function that today’s finance is called upon to perform, which is not to lend the excess money of the rich to the poor and their governments but to generate leverage for the rich themselves.
An affluent society of borrowers
A historical analysis of the rise of US household debt from 1949 to 2013 found that the share of total debt owed by richer American households has increased since the 1950s and ‘[t]his increase is mainly driven by the top 5 percent’; stated otherwise, ‘on a household level, the correlation between debt and income has become more positive over time’ (Kuhn et al., 2017: p.8). 11 Another study of US household debt and income distribution over the 1983–2013 period shows that ‘the absolute level of debt rises monotonically with income’ to then ‘fall somewhat at the very top of the distribution’ (Mason, 2018: p. 32). The positive correlation between debt and income also applies to the UK and EU, where most households in the top quintiles owe the largest shares of household debt in absolute terms and are relatively more levered up than households in the bottom quintiles, many of which have no debt at all (Harari, 2018; ECB, 2020: pp. 17-23).
Recent studies have drawn upon US Survey of Consumer Finances (SFC) data to revisit earlier characterizations of household inequality and incorporate leverage as a function of wealth and income inequality. Szymborska (2022), for instance, proposes a new conceptualization of households in financialized economies using an SFCM model that allows for the indebtedness of the rich. Her model includes ‘the working poor’ or the lower class, the ‘leveraged owners’ or middle class, and, finally, ‘the working rich’ or upper class, which roughly corresponds to the top income decile. As she points out, the top income decile constitutes ‘the most indebted income group’ but debt is not a problem for the working rich as they mostly ‘take on debt as an investment strategy to accumulate more assets’ (Szymborska, 2022: p. 42). In fact, the working rich have historically enjoyed the highest levels of leverage (debt-to-income ratios) at the lowest interest rates because of their collateral assets and capital, resulting in the lowest debt-service-to-income and debt-to-asset ratios across the income distribution (Szymborska, 2022: p. 31). In a similar vein, Costantini and D’Ippoliti (2023) divide up households into three main classes: the ‘propertyless’ at the bottom of the income distribution; the ‘homeowners’ in the middle deciles; the ‘wealth and business owners’ at the top end. While all these classes borrow for a variety of reasons, the wealth and business owners predominantly borrow to invest and enjoy the highest debt-to-income (or leverage) ratios, particularly starting from the 2000s (Costantini and D’Ippoliti, 2023: p. 11). These economic models are broadly compatible with the main sociological findings from the ‘finance culture’ and ‘asset economy’ literature studies (Adkins et al., 2020; Fligstein and Goldstein, 2015), which have similarly highlighted the role of leverage in upper and upper-to-middle class households’ investment strategies.
The missing data on hedge fund liabilities
While emerging economic models and sociological analyses of household finances are contributing to a novel understanding of the relationship between debt and inequality, they continue to underestimate the significance of leverage beyond the realm of housing finance. One reason is that many of the complex leverage strategies mandated by affluent households are not accounted for in statistics on household debt, where mortgages stand prominent over all other forms of indebtedness. Take, for instance, balance-sheet data on hedge funds from the Flow of Funds, the main dataset used by proponents of the saving glut of the rich. 12 According to the Flow of Funds, the total AUM of US hedge funds stand at $2.75 trillion in 2021 while their overall liabilities only amount to a mere $0.83 trillion. 13 These are mostly in the form of repurchase agreements and broker-dealer loans (the Flow of Funds also reports $1 trillion derivatives) (Financial Accounts of the United States, 2022: p. 147). To be clear, the Flow of Funds grossly underestimates and effectively misrepresents the true magnitude of hedge fund liabilities (on- and off-balance sheet), for even if one were to include the $1 trillion derivatives exposure, the total liabilities of US hedge funds would still be a fraction of their NAV. In contrast, most analyses of hedge fund leverage suggest that hedge fund gross exposure far exceeds their equity: GAV and GNE normally range between 1 and 10 times the value of NAV. In some cases, hedge fund gross leverage may reach astronomical heights as layers of debt can build both on- and off-balance sheet through derivatives exposure. The invisible leverage implied in derivatives contracts is also referred to as ‘synthetic leverage’, ‘embedded leverage’, and ‘instrument leverage’ (Ang et al., 2011; Barth et al., 2020; Breuer, 2000; McGuire and Tsatsaronis, 2008).
A 2015 survey by the Financial Conduct Authority (FCA) found that 52 large hedge funds that collectively managed the equivalent of $623 billion AUM in the UK had an average mean leverage of 27.9; this was mostly in the form of synthetic leverage, as balance-sheet leverage alone was only 2.3 (FCA, 2015: p. 19). A 2020 hedge fund survey by the International Organization of Securities Commissions (IOSCO), based on a large sample of 2139 hedge funds operating in nine major jurisdictions (France, Germany, Hong Kong, Ireland, Luxembourg, Singapore, Switzerland, the United Kingdom, and the United States) and managing a total of $3.84 trillion AUM, found that hedge fund GNE was on average 7.8 times the fund’s NAV (IOSCO, 2020: p. 13). The gross exposure of sampled hedge funds operating in the US was by far the largest: in absolute terms, it amounted to a total of $22.7 trillion. 14
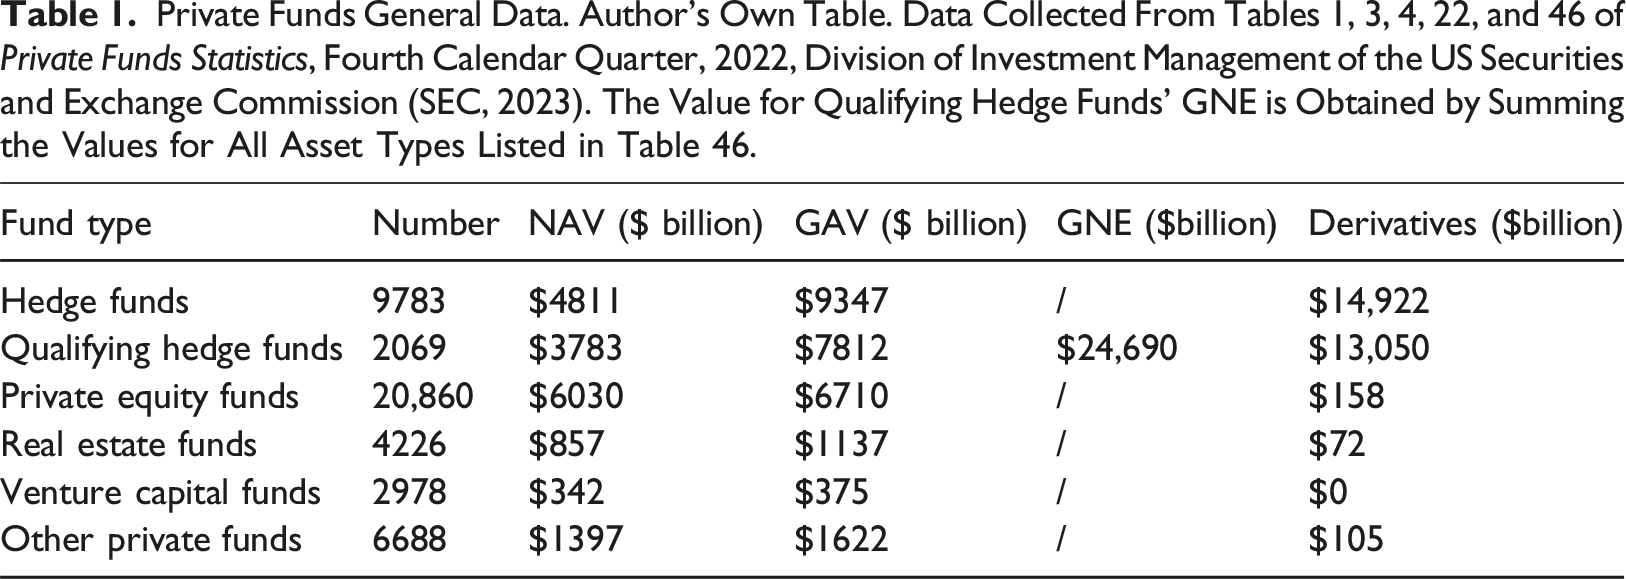
These statistics are compatible with those offered by the US Financial Stability Report (FSR) which, just like the Flow of Funds, is released by the Board of Governors of the Federal Reserve. According to the October 2023 report, hedge funds’ gross leverage was on average 6–8 times their NAV over the 2013–2023 period (FSR, 2023: p. 32). FSR statistics on hedge fund leverage are based on hedge fund filings to the Securities and Exchange Commission (SEC) – more specifically Form PF, which investment advisers to private funds are required to file on a regular basis. In its 2022 (fourth quarter) statistical report on private funds operating in the US, the SEC reports a total of 9783 hedge funds, of which 2069 (21.14%) are ‘qualifying hedge funds’, defined as ‘any hedge fund advised by a Large Hedge Fund Adviser that had a NAV (individually or in combination with any feeder funds, parallel funds, and/or dependent parallel managed accounts) of at least $500 million’ (SEC, 2023: p. 61). 15
Private Funds General Data. Author’s Own Table. Data Collected From Tables 1, 3, 4, 22, and 46 of Private Funds Statistics, Fourth Calendar Quarter, 2022, Division of Investment Management of the US Securities and Exchange Commission (SEC, 2023). The Value for Qualifying Hedge Funds’ GNE is Obtained by Summing the Values for All Asset Types Listed in Table 46.
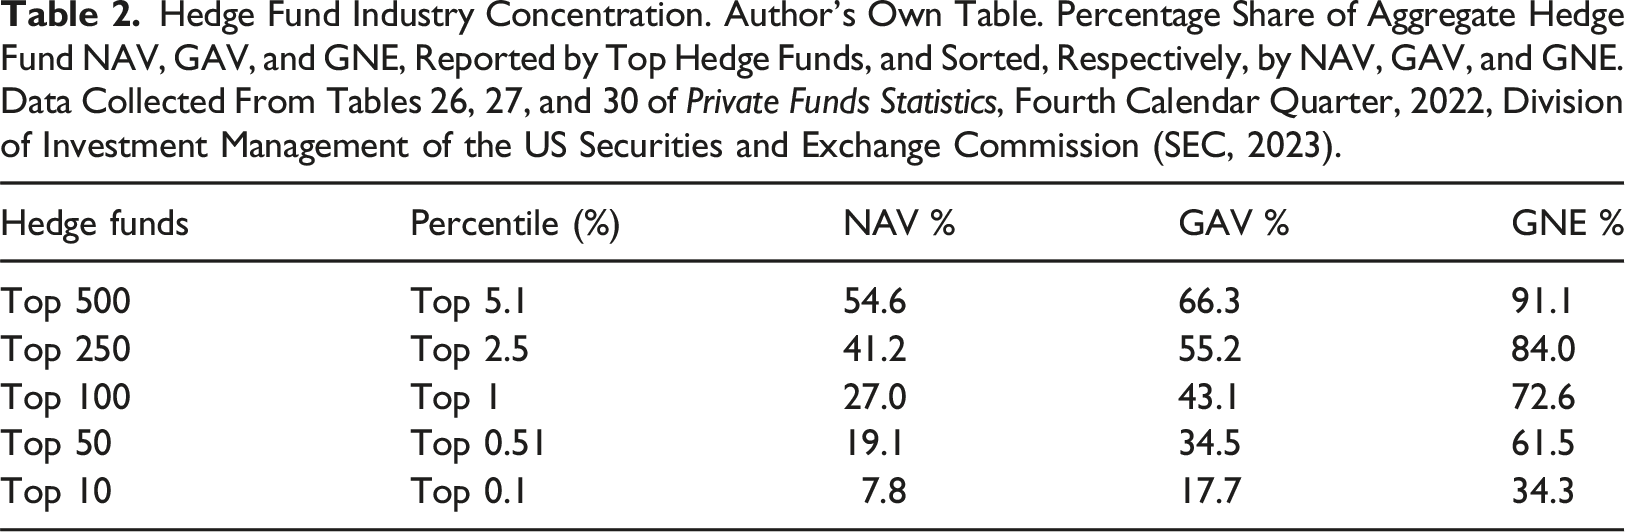
Hedge Fund Industry Concentration. Author’s Own Table. Percentage Share of Aggregate Hedge Fund NAV, GAV, and GNE, Reported by Top Hedge Funds, and Sorted, Respectively, by NAV, GAV, and GNE. Data Collected From Tables 26, 27, and 30 of Private Funds Statistics, Fourth Calendar Quarter, 2022, Division of Investment Management of the US Securities and Exchange Commission (SEC, 2023).
Absentee debts
SEC data likely provide a conservative estimate of hedge funds’ aggregate GNE. This is for two main reasons: one is that the SEC does not necessarily have the capacity to verify what hedge fund managers declare in the Form PF (for each form submitted by private funds and their advisers, the SEC specifies that ‘The Securities and Exchange Commission has not necessarily reviewed the information in this filing and has not determined if it is accurate and complete’). The other reason is that top hedge funds do not provide full data about their GNE. For instance, barely any meaningful information is provided by the several legal vehicles that make up two of the largest hedge funds in the world – Bridgewater Associated and Citadel – neither of which have submitted a Form PF in recent years, where advisers are required to provide the gross notional value of derivatives exposure. Instead, they have filed a Form 13F, which only contains information about institutional investment manager holdings calculated at fair market value. 16 Needless to say, the difference between notional and market value of a derivatives contract is significant. According to the latest BIS statistical release for 2021–22, 17 the global ‘over the counter’ (OTC) derivatives market has a market value of $20 trillion and a staggering notional value of $600 trillion. Although Citadel refuses to disclose the true magnitude of its gross notional exposure, one can still gather from the Form 13F filed by one of its main vehicles (Citadel Advisors LLC) that Citadel controls institutional investment manager holdings of $500 billion at the end of 2023, 18 in the face of an estimated $59.5 billion AUM in the same year. 19
There is a further reason why it is difficult to obtain reliable information about hedge fund derivatives exposure: only a minority of derivatives contracts are ‘exchange-traded’, that is, standardized, regulated, and cleared via third-party agencies. The BIS estimates the notional value of exchange-traded derivatives to be around $90 trillion globally at the end of 2022 20 – a remarkable amount, but nothing like the estimated $600 trillion OTC derivatives market, which is far less regulated and transparent. Thus, it comes as no surprise that a 2000 IMF study acknowledged that ‘empirical measures of off-balance-sheet leverage are difficult to implement’ (Breuer, 2000: p. 11). Likewise, a 2008 BIS working paper claimed that estimates of leverage for certain types of hedge funds ‘are implausibly low even when the synthetic options factors are included’ (McGuire and Tsatsaronis, 2008: p. 2). More recently, a 2016 study authored by economists in the Board of Governors of the Fed pointed out that ‘because of the growth of the derivatives market, leverage has become more difficult to measure’ (Aikman et al., 2016: p. 5).
More generally, hedge funds have historically faced little legislative and regulatory restrictions on their use of borrowed funds and securities (Eichengreen and Park, 2002: p. 3), and even if legislation has become more stringent over time, they can easily go around rules (for instance, the Federal Reserve Board’s Regulation T which allows stock investors to only borrow up to a maximum 50% of a position on margin) as they can establish offshore investment vehicles and obtain leverage on margins as low as 1% of the borrowed funds. Prime broker-dealer banks have offshore facilities that provide for OTC derivatives contracts (Ang et al., 2011: p. 104). As a matter of fact, while 90% of qualifying hedge funds’ main offices are located in the US (which is where hedge funds incur debt and invest for the most part), only 35.6% are domiciled in the US, while the remaining are domiciled in notorious tax heavens – Cayman Islands, Ireland, Virgin Islands, Luxembourg, and Bermuda (SEC, 2023: p. 13) – contributing to the offshoring and absenteeism of hedge funds’ synthetic debts.
Why hedge fund leverage matters
Hedge funds are part of an asset management complex that comprises different kinds of money-managers. Broadly speaking, one can distinguish between money-managers that fall under the umbrella of ‘traditional finance’ and those that make up the largely unchartered domain of ‘alternative finance’ (see also Benquet and Bourgeron, 2022). Giant asset managers broadly belong with the former group. They are for the most part passive managers of unlevered index funds that do not aim to ‘beat the market’ but are more than happy to just ‘follow/buy the market’, and charge very low fees to millions of institutional and retail investors in exchange for ensuring average market returns. Passive index fund managers have been rightfully described as the Goliaths of 21st-century ‘asset manager capitalism’ (Braun, 2022): universal owners of ‘an immense collection of funds’ (Christophers 2023: p. 23) and large sections of financial markets, including the near totality of exchange-traded funds (yet Goliath was slain by David).
Hedge funds are the epitome of alternative finance. They operate according to a logic that is in many ways opposite to that of giant asset managers. While the latter cannot exit their investments at will (Braun, 2022), hedge funds are active traders responsible for 30 to 60 percent of financial market turnovers, constantly moving in and out of markets. Instead of targeting average market returns, they aim to generate above-benchmark returns (indeed ‘absolute returns’). To that purpose, they routinely employ complex short-term investment strategies entailing both long and short positions as well as the use of derivatives. Interestingly, while the long arm of their leverage has been found behind virtually every financial crisis of the last quarter century (e.g. Brunnermeier and Nagel, 2004; Eichengreen and Park, 2002; Erturk et al., 2010; Lysandrou, 2011), only a few scholars have paid sufficient attention to their activities (an exception is Fichtner, 2013). One reason for this oversight is their relative small size (by AUM) vis-à-vis giant asset managers: at the end of 2022, after experiencing a major decline in AUM from a peak of $10 trillion assets at the height of the pandemic, the largest index-fund and ETF manager in the world, BlackRock, still commanded $8.9 trillion assets, which is almost twice the amount of total AUM for the entire hedge fund industry globally, estimated at $5 trillion in 2023. 21
This said, asset ownership alone is neither the best indicator of power in finance nor is it a predictor of one’s ability to generate profits through financial market investing. While BlackRock’s operating income in 2022 was $6.7 billion and the company was able to return $4.9 billion to shareholders plus $1.9 billion of share repurchases, 22 in the same year, Citadel Investment Group, one of the largest hedge funds in the world with $62.3 billion AUM in 2022 (142 times smaller than BlackRock’s AUM), posted a $16 billion profit. 23 Even more tellingly, Millennium Capital Partners LLP (UK branch of Millennium Capital, a top 20 global hedge fund) reported £175 million NAV and £215.5 million in profits in 2021, for a hefty 123% ROE. Capula Investment Management LLP (UK branch of another top 20 global hedge fund) had an even better performance in the same year, reporting £98.5 million profits against £38.1 million NAV (256% ROE). 24 The point is: though they appear to have far less assets under management, top hedge funds may wield tremendous power over markets because of their gross notional exposure, which is why they typically generate higher returns than the largest (passive) asset managers on earth. As a result, their CEOs get paid several times more (see also Fichtner and Morgan, 2023, 21).
Institutionalization and polarization in the hedge fund sector
Top hedge funds’ astounding capacity for money-making hardly makes any sense unless we factor leverage in. To fully appreciate this point, it is important to premise that, from an investor perspective, while hedge funds constitute an alternative to traditional asset management, they are not in competition with giant asset managers or other institutional investors. Instead, they fulfil a different function. Traditional finance is about storing wealth (at going rates); alternative finance is about growing it. Oftentimes, the former requires the latter – particularly as procyclical leverage depresses interest rates and, in a reinforcing loop, contributes to an ever more fragile and unstable financial environment whereby wealth-storing must rely on more leverage to counter the threat of asset deflation. Unsurprisingly, the growth of the hedge fund industry in the past quarter century has gone hand in hand with its ‘institutionalization’, as large institutional investors (most prominently US pension funds) have increased their equity stakes in alternative finance in an era of depressed yields.
The institutionalization of the hedge fund industry, however, should not be overstated, nor should it be intended as an indicator that hedge funds have become somehow inclusive. As a matter of fact, hedge funds remain money-managers of the elites. According to the SEC (2023, p. 16), in 2022 US public pension plans only account for 11.8% beneficial ownership while private pension plans account for another 10.8% – altogether nearly one-quarter of aggregate ownership. The single largest beneficial owners of qualifying hedge funds are ‘private funds’ (18.2%), followed by ‘other’ (14.8%), ‘non-profits’ (13.9%), and ‘US individuals’ (11.2%). ‘Private funds’, ‘non-profits’, and ‘other’ (which likely comprises family offices, personal trusts, and other investment vehicles of the elites) are all legal proxies of affluent households. Altogether, they make up 58.1% of the beneficial ownership of qualifying hedge funds operating in the US. This is without mentioning the fact that, as the ‘working rich’ (Szymborska, 2022), affluent households are also the dominant beneficiaries of the US retirement plans invested in hedge funds. According to the latest US Survey of Consumer Finances (SFC, 2023), households in the top 10% hold on average more pooled investment funds (which include retirement accounts, cash value in life insurance, and other managed assets) than all other income groups combined. 25 This is very significant, given that US pension funds account for two-thirds of global pension assets (OECD, 2023).
Granted that (a) hedge funds are elite funds that are not really in competition with giant asset managers or large institutional investors and, reciprocally, that (b) the ‘alternative versus traditional finance’ heuristic is not an ‘elite versus mass finance’ dichotomy as affluent households are the largest investors and beneficiaries of both financial domains, it is important to stress that (c) hedge funds are aggressively competing with one another. The hedge fund sector is one of extreme polarization and concentration of power, where a few winners take all. While a handful of funds are able to achieve absolute returns, most hedge funds make average returns, if not losses. Crucially, leverage is positively associated with profits. A study by Kruttli et al. (2022) shows that hedge fund leverage is not evenly spread out across the sector but is heavily concentrated at the top, where above-benchmark returns are made. 26 In particular, top 10% hedge funds (by NAV) tend to be among the most levered up and are part of a highly concentrated credit network, ‘with a few players dominating the hedge fund-prime broker lending market’ (Kruttli et al., 2022: p. 16). Likewise, a 2020 study authored by economists from the US Office of Financial Research (Barth et al., 2020) presents disaggregated statistics that draw on SEC data on both balance-sheet and synthetic leverage over the 2013–2019 period and shows that the leverage of top 1% funds is much higher than the leverage of all other funds, including those in the 95th percentile (Barth et al., 2020: p. 52). This is unsurprising as top 1% funds alone account for nearly three-quarters of aggregate GNE (see Table 2).
Making money out of safe assets, or the leverage premium
What is perhaps even more significant about the largest and most profitable hedge funds is that, in addition to being the most levered up, they likely enjoy the most liquid and least risky portfolios. Indeed, from an investor perspective, leverage and risk are known to be negatively associated. In the extant literature, this paradox is known as the ‘low-beta anomaly’, or else the strange phenomenon of low-beta assets yielding high alpha (Boguth and Simutin, 2018; Frazzini and Pedersen, 2014; Gonzales-Urteaga and Rubio, 2021). In financial jargon, ‘alpha’ is a measure of the profitability of an investment, while ‘beta’ measures the volatility and overall riskiness of an investment. A typical low-beta asset is a G10 sovereign bond, which naturally yields a low alpha (low return). In theory, only a high-beta asset should yield a high alpha (high return). In practice, when a position in a low-beta asset is levered-up, it is possible for the investment to generate high alpha. In other words, all other things being equal, leverage gives investors more ‘bang for the buck’.
This means that, while funds that use little or no leverage are likely to tilt their portfolios towards higher-risk assets in order to generate above-benchmark returns, ‘funds that use the most leverage invest in securities with the lowest market betas’ and these ‘low market-beta assets have high alphas’ (Barth et al., 2020: p. 32). As a result, ‘[a] leveraged portfolio of highly rated corporate bonds outperforms a de-leveraged portfolio of low-rated bonds’ (Frazzini and Pedersen, 2014: p. 3). We may call ‘leverage premium’ this ability to generate high returns out of portfolios of low-risk, short-term, and highly liquid assets. The premium can be substantial. A recent study of US treasuries trading during the COVID-19 pandemic (Kruttli et al., 2021) presents disaggregated data on relative-value hedge funds with at least $1 million invested in US Treasuries. The study found that quarterly rates of return for hedge funds in the 90th percentile are 8.2% on average or 37.05% annualized (Kruttli et al., 2021: p.38). This is quite the feat considering that, between 2013 and 2020, the annual return of the highest-yield US treasury security (the 30-year bond) was around 3%. 27
Because of the leverage premium it yields, relative-value trading is a most popular strategy among hedge funds. Fixed-income funds, which typically pursue relative-value strategies in bond markets, are reported to have reached $973.1 billion AUM in 2023. 28 A relative-value fund would take a long position in an undervalued security and sell short an overvalued security of the same or similar kind (Dikaranov et al., 2017: pp. 242-3). For example, fixed-income funds would go long ‘off-the-run’ (OFFR) securities and short ‘on-the-run’ (ONR) securities. 29 Ceteris paribus, OFFR securities have a relatively shorter maturity date and therefore a lower beta. Conversely, ONR securities are relatively more sought-after and therefore have a marginally higher cost. 30 Crucially, for relative-value strategies that seek to exploit minimal price discrepancies among securities, fund managers must use extremely high levels of leverage. Together with ‘macro’, ‘relative value’ are the most levered strategies among hedge funds: GNE is 33.7 times NAV for ‘macro’ and 21.3 times NAV for ‘relative value’ strategies; by comparison, average leverage for ‘equity’, ‘credit’, and ‘event-driven’ strategies is, respectively, 3.5, 3.2, and 1.8 (SEC, 2023: p. 38).
The leverage nexus within global finance
The leverage premium forces us to reconsider the significance of safe assets and, in turn, brings to the fore what we may call the ‘leverage nexus’ at the heart of global finance. Safe assets have been described as a means to store value in normal times and, especially, in times of stress, when investors ‘fly to safety’. However, this is only partly true. For while in normal times safe assets do serve as collateral security for money market funds and are indeed a means by which investors save/store money as liquidity, they are also a major source of yield for top hedge funds. For this very reason, they become a major factor of instability for the wider financial system in times of stress. As a March 2020 BIS bulletin pointed out, during periods of heightened volatility, broker-dealer banks have limited balance-sheet capacity due to tighter risk constraints. To mitigate risk, they call or raise margins on the loans they have made to hedge funds (Schrimpf et al., 2020: p. 2). To meet the margin calls, hedge funds can use their free cash, liquidate their short positions, and, if this is not enough, unwind their long positions (Gerasimova and Jondeau, 2018). In this case, liquidation is achieved at a higher cost because securities trade at a higher-than-usual discount or haircut. As safe assets are the least affected by the scythe of haircuts during a crisis, they are the first ones to go when hedge funds and other levered-up financial market investors are forced to unwind their long positions and deleverage. For example, in March 2020, relative-value funds invested in US treasuries suddenly reduced their exposures by some 20% (Kruttli et al., 2021). Crucially, fire sales of safe assets during a crisis feed a cycle of generalized market illiquidity, price dislocation, and tighter margin requirements, also known as a ‘margin spiral’ (Brunnermeier and Pedersen, 2009). This is, for instance, what happened during the UK gilt panic of September 2022, when UK pension funds found themselves heavily exposed in levered-up ‘liability-driven investments’, or during the US banking crisis of early 2023, when Silicon Valley Bank and Signature Bank could not avoid collapse after liquidating their portfolios of US treasuries.
The example of safe assets and margin spirals helps us shed light on some of the wider politics of leverage. First of all, it suggests that, in the ebbs and flows of the leveraged economy, the (insider) traders that actively manage their portfolios via short-term borrowing from broker-dealer banks are always a step ahead of the (outsider) investors that passively manage other people’s money without resorting to leverage. This is because levered-up firms initiate both asset bubbles and margin spirals: relative to unlevered firms, they are first to buy (go long) when assets have not substantially appreciated yet (asset inflation being a product of leverage’s procyclicality); in turn, they are also first to sell (short) assets before they have already lost considerable value (asset deflation being a consequence of margin spirals). Their being ‘first’ allows levered-up firms to maximize their capital gains relative to unlevered firms in the upturn of the leverage cycle whilst minimizing capital losses in the downturn – partly shifting the costs of their leverage strategies onto lesser debtors and ‘herds’ invested in the same asset classes. Secondly, the example of safe assets and margin spirals highlights how top hedge funds are further advantaged vis-à-vis unlevered firms because of their close proximity to market-makers, which may be part beneficial owners of the hedge funds, or anyway exposed to their liabilities. 31 As a result, market-makers (including central banks, as market-makers of last resort) might have a strong interest in ensuring their liquidity in times of stress. Finally, the leverage nexus that binds hedge funds and market-makers extends to giant asset managers, for these do not simply ‘buy the market’: they also lend it out for a fee via ETF securities lending programmes to the market-makers and the hedge funds speculating in securities and derivatives markets. More generally, passive (traditional) investors may partly benefit from the hype in financial markets generated by active (alternative) traders, not least because they might be invested in the traders’ funds (and funds of funds), and therefore should be seen as the recipients of a trickle-down effect of leverage. Even so, their profits are no match to those of the largest hedge funds and big banks that actively make the market and effectively leverage it on behalf of absentee debtors at large.
Conclusion
Leverage is a factor of wealth and income inequality, not because the rich and ultra-rich lend at interest to the rest of the world, but because they themselves take advantage of highly leveraged corporate structures that generate financial sector debt both on- and off-balance sheet. In this respect, the notion of ‘absentee debtor’ has been used to describe a peculiar type of borrower: one whose debts are conspicuously marked by their absence from statistics on household debt as they are separated from both principals and agents (i.e. both fund beneficiaries and managers) by legal fictions, brushed off balance sheet, offshored. Absentee debtors thrive on low interest rates: while a substantial part of their portfolios is entrusted with traditional wealth management, the lion’s share of their profits comes from active trading in secondary and derivatives markets via alternative investment funds. In this connection, it is worth mentioning that the wealth stock of global HNWIs has grown by an average 5.1% between 2015 and 2022, the only exception being 2018 and 2022, when the global wealth stock of the rich declined by, respectively, 3% and 3.5% and hedge funds posted their worst performances (Capgemini, 2023: pp. 6-11). In both years, interest rate hikes threatened the leverage of the rich. In 2018, a first attempt at quantitative tightening by the Fed ultimately produced marginally positive real rates in the final months of the year (for the first time since 2008), as well as a near stock market crash in December (see Sgambati, 2022: p. 15); in 2022, rapid interest rate hikes resulted in margin spirals, fire sales, and generalized deleveraging across the economy, causing wealth losses for affluent households despite record corporate profits in 2021–2022.
Among other things, the article has endeavoured to demonstrate that the game of money-making is not one of owning and lending money and assets but one of borrowing and trading them. Procyclical leverage fuels property and stock market inflation and at once exerts downward pressures on interest rates, contributing to the liquidity of financial markets, making it all the more advantageous for absentee debtors to make money by leveraging their portfolios, instead of lending to others. To shed light on the leverage of the rich, the article has strategically focused on the hedge fund industry – particularly top hedge funds as these are majorly responsible for the sector’s leverage. However, hedge funds are not the only type of corporate structures exploited by absentee debtors. Other levered-up firms, particularly private equity and real estate, also play a prominent role. To date, the alternative finance complex remains an underdeveloped field of inquiry that warrants further research. This said, it is important to stress that the leverage of absentee debtors extends beyond the domain of alternative finance. It encompasses the leverage of the big banks that provide credit and brokerage services to alternative finance and which earn fees in the process that ultimately accrue to their dominant owners, that is, affluent households. It also includes large portions of non-financial corporate debt, as growing quantities of corporate debt are incurred to finance mergers and acquisitions, leveraged buyouts, and stock repurchase programmes that altogether increase shareholder value and benefit affluent households above all. A comprehensive theory of absentee debtors should therefore encompass a theory of corporate leverage at large.
Footnotes
Acknowledgements
I wish to thank the anonymous reviewers, colleagues from City Political Economy Research Centre (CITYPERC), and the organizers of the DEEP Webinar Series (Digital Technologies and Monetary Policies) for their helpful comments on an earlier version of this article.
Declaration of conflicting interests
The author(s) declared no potential conflicts of interest with respect to the research, authorship, and/or publication of this article.
Funding
The author(s) received no financial support for the research, authorship, and/or publication of this article.