
Abstract
Financialization scholars argue that the growing financial balance sheets of non-financial corporations indicate a “financial turn in accumulation” driven by the rise of shareholder value orientation (SVO). In this paper, I test whether greater shareholder influence or shareholder-aligning managerial incentives can explain the more rapid accumulation of financial assets among US NFCs. I find that shareholder power is associated with some increase in short-term financial assets but only in the case of certain shareholder types, in particular high turnover institutional investors. The magnitudes of the effect are small however, and only pertain to smaller firms. Moreover, ownership concentration by these impatient investor types is declining. The results suggest that changing corporate governance patterns have little capacity to explain balance sheet financialization. I argue that mainstream accounts focused on the precautionary savings of new, research-intensive firms and tax arbitrage amongst multinationals offer a better explanation for growing financial balances than the financial accumulation hypothesis. Neither of these imply a substitution of financial for real investment, which calls into question an important mechanism thought to connect financialization to secular stagnation and rising inequality.
Keywords
Introduction
The reorientation of non-financial corporations (NFCs) toward financial activities is widely seen as a core facet of financialization (Crotty, 2005; Davanzati et al., 2019; Krippner, 2011; Lin and Tomaskovic-Devey, 2013; Orhangazi, 2008; Stockhammer, 2004). A “financial turn in accumulation” is argued to have taken place over the last several decades, with NFCs looking to financial markets to supplement or substitute for profits generated in their ordinary lines of business. In the dominant view, these shifts have been driven by the increasing influence of shareholders over the firm (Davanzati et al., 2019; Davis 2018; Krippner, 2011; Orhangazi, 2008; Stockhammer, 2004). This paper critically evaluates the evidence of a “turn to finance,” and in particular the connection between SVO and the growing financial balance sheets of NFCs.
Financialization as a general term refers to a set of processes involving the encroachment of financial logics and actors over other parts of the economy (Van der Zwan, 2014). The apparent abandonment of production for financial speculation by major corporations has become deeply emblematic of these broader processes. Financial accumulation has been found to have a “crowding out” effect on productive activities, leading to slower investment (Orhangazi, 2008; Stockhammer, 2004; Tori and Onaran, 2020), declining productivity and value added growth (Hein and Truger, 2012; Pariboni et al., 2020; Tomaskovic-Devey et al., 2015), and a weaker labor market (Lin, 2016). It’s argued to have undermined the bargaining power of productive workers (Lin and Tomaskovic-Devey, 2013), while expanding the “exit” options of capitalists (Kohler et al., 2019) and buttressing the income shares of financial agents (Huber et al., 2022). Empirically, it’s thus been connected it to declining labor shares at the firm (Alvarez, 2015; Guschanski and Onaran, 2020), industry (Kristal, 2013; Lin and Tomaskovic-Devey, 2013), and national (Kohler et al., 2019) level, to income dispersion (Davanzati et al., 2019; Huber et al., 2022; Lin and Tomaskovic-Devey, 2013) and to de-unionization (Dupuis et al., 2020; Kollmeyer and Peters, 2019). Some accounts even see financial accumulation as the cornerstone of an entirely distinctive phase of capitalism, marked by an increased tendency for profits to accrue through financial channels rather than productive ones (Krippner, 2011).
Yet despite the enormous importance accorded to it, the evidence of NFCs having undertaken any generalized turn to finance is surprisingly thin. The core problem confronted in empirical work is the non-availability of functionally disaggregated profit data, which would allow us to measure returns specifically from financial activities (Rabinovich, 2019). In practice, this means that the main evidence for the financial turn has come from balance sheets—in particular the increased size of financial portfolios relative to other assets.
If financial accumulation is to be inferred from balance sheet financialization, it becomes particularly important to establish a link between the latter and the main mechanism driving financial profit seeking: SVO. I seek to do this by examining the effect on balance sheet behavior of a wide range of variables intended to capture two things: (1) the extent of shareholder influence over the firm, and (2) the extent which managers have been incentivized to prioritize the interests of shareholders. This method allows me to account for an important point of nuance generally elided in the financialization literature: shareholder heterogeneity. Previous research has linked financial accumulation to the influence of shareholders or institutional investors as a whole, but a different possibility is that only certain types of shareholders encourage financial profit seeking, given that shareholders differ in their preferences and enforcement capacities (Jackson, 2011).
My findings suggest that this is indeed the case. I find evidence that shareholder power can induce firms to accumulate more financial assets, but these effects are confined to certain types of “impatient” investor—who’s overall ownership share has been decreasing in recent years. The effects are small in magnitude and appear to hold only for smaller firms, which have made next to no contribution to the aggregate increase in financial holdings. I find, moreover, that passive index funds, which have dramatically increased their ownership shares in recent years, have a discouraging effect on balance sheet financialization.
Governance dynamics, therefore, offer little in the way of an answer to the puzzle of growing financial portfolios. But far better answers are available from an extensive empirical literature in mainstream economics and corporate finance (Bates et al., 2009; Faulkender et al., 2019; Graham and Leary, 2018). Financialization researchers have generally ignored this work, possibly because of its apparently much narrower subject matter—focused on the stockpiling of liquid assets, or simply “cash” in business jargon. I show, however, cash and short-term investments (Compustat item che) account for almost all of the recent growth in NFC balance sheets. Mainstream explanations of “cash piles” center on two factors. Firstly, increased demand for precautionary savings, driven by smaller, newer, R&D intensive firms (Graham and Leary, 2018). Secondly, the amassing of giant offshore portfolios by tech-intensive multinationals which face tax penalties on repatriated earnings, and which have significant capacities for profit shifting (Faulkender et al., 2019).
Neither of these explanations provides any room for financial profit seeking as a base motive for portfolio expansion, nor do they suggest any likelihood that financial activities will come to have displaced productive ones. Balance sheet growth for smaller firms appears to reflect an engagement with the financial sector on very traditional terms: as means of managing risk and liquidity. For large multinationals, it appears to be motivated primarily by tax arbitrage opportunities (Pozsar, 2018). Investment in financial assets is thus unlikely to have “crowded out” capital expenditure at any significant scale. It’s also unlikely to have had any significant impact on bargaining dynamics, given that most firms seem to have maintained their conventional reliance on producing and selling.
This paper thus adds to a growing skeptical literature (Fiebiger, 2016; Kliman and Williams, 2014; Rabinovich, 2019; Soener, 2020). It argues that financial accumulation is something of a myth. While there are no doubt important instances of NFCs having turned away from their traditional lines of business toward financial activities, there is no evidence of this having occurred at scale. The best indirect indicator of that having happened—balance sheet financialization—is far better explained by other factors that have little to do with a financial profit motive.
A note on terminology: the term “financialization” is used in connection with NFCs to refer to a number of related but distinct phenomena including the adoption of shareholder governance norms, the increased distribution of earnings to shareholders, and deepened engagement in financial activities and markets. In this paper, I use the term exclusively in the latter sense. I define “financial accumulation” motivationally—it refers to attempts by NFCs to generate increased revenue through financial activities. The amassing of financial assets for different motives, such as to increase liquidity, is not financial accumulation.
Background and theory
Shareholder value orientation and financial accumulation
The possibility that financial investment might come to substitute fixed-capital investment was recognized early on, particularly by Marxist economists. As far back as 1929, Henryk Grossman (1929) predicted that when “money capital in search of investment can no longer be applied profitably in production,” it would turn instead to the “stock market.” A similar idea was raised within the mainstream by James Tobin (1965), who speculated that higher rates of return on financial assets may cause firms to divert available funds to financial markets, depleting resources for productive expansion (Orhangazi, 2008: p. 867). Various Marxist writers have argued that a prolonged re-direction of capital toward finance could result from conditions that led to persistently depressed real sector profitability (Arrighi, 1994; Sweezy, 1994).
More recent in interest in financial accumulation was sparked by the work of Krippner (2011) and Crotty (2005). Drawing on aggregated statistics, they identified a sudden and dramatic increase in the demand for financial assets by US NFCs from around 1980. By end of the century, NFC financial portfolios had increased twofold relative to tangible assets, while portfolio income was up fourfold relative to profits. In connecting these trends to changing relative profit opportunities they built on their Marxist precursors, but located financial profiteering in the structural conditions of financialization. High and volatile interest rates acted as a push factor deterring NFCs from productive investment, while higher returns on financial assets drew them into speculative investments. But they added a crucial element to the story: SVO was seen as mediating the response to changing profit stimuli (Davanzati et al., 2019; Krippner, 2011; Orhangazi, 2008; Stockhammer, 2004).
The post-Keynesian literature has hypothesized two main mechanisms linking SVO to financial accumulation. The first is ideational in nature, relating to the shifting cognitive frames through which managers come to understand the nature of the firm and its strategic objectives (Krippner, 2011; Stockhammer, 2004). In the Chandlerian era, the firm was understood to be a stable institution supporting a variety of stakeholders, geared toward its own long-term reproduction. Managers adopt “shareholder conception of the firm,” coming to perceive their companies as simply a bundle of different assets rather than a free-standing institution (Fligstein, 1993). The firm’s productive assets, viewed through this lens, do not hold any inherent importance over other asset classes and hence are regarded as freely interchangeable with financial investments based on narrow profitability criteria.
The second and more frequently cited mechanism is rooted in the imposition of shareholder interests over the firm, rather than managers’ cognitive alignments. Shareholders are thought to have a first order preference for maximizing short-term returns, which means intensified use of buybacks and dividends, both to “disgorge cash” and to pump up share prices. Pressure to sustain short-term payouts in turn translates into a stronger preference for financial investment, because the latter is deemed to be both quicker yielding, more easily reversible, and more predictable than real investment projects (Davanzati et al., 2019; Davis, 2018; Hein and Truger, 2012; Stockhammer, 2004) 1 .
Challenges to the financial accumulation thesis
Despite the macro-causal importance ascribed to it, evidence for the financial accumulation thesis is somewhat limited. Only two papers, to my knowledge, empirically demonstrate any kind of link between SVO and financial orientation. Davis (2018) finds a positive relationship between the average industry level payouts—a proxy for SVO—and higher ratio of cash and short-term assets in a firm’s balance sheet. Adopting a similar method in a cross-Latin American study—Rabinovich and Artica (2019) found a (small) positive association between financial income and short-term investments only in one case (Brazil)—suggesting that other non-profit motives likely explain the build-up of cash holdings in those countries. On the other hand, Baines and Hager (2022, p. 1055) in an industry-specific study of commodity traders challenge the assumption that “shareholder value and the financialization of accumulation run in parallel.”
More troubling for the financial accumulation thesis is the absence of robust descriptive evidence demonstrating a relative increase in the importance of financial channels of profit generation. None of the publicly available datasets so far employed in the financialization literature disaggregate profits operationally in a way that would allow straightforward comparison between real and financial activities. It is generally possible to obtain information on the total income generated from the holding of financial assets as well as some measure of total financial expenditure. However much of this expenditure will relate to the financing of real sector activities which means it cannot be subtracted from financial income to obtain “pure” financial profit. The second-best approach adopted by most authors (Crotty, 2005; Davanzati et al., 2019; Krippner, 2011; Lin and Neely, 2020) is to compare financial income (i.e., gross of costs) to total profit. But as Crotty (2005, p.105) himself warned long ago this method severely biases the importance of financial income in an upwards direction because it compares a revenue stream to a profit (net of cost) stream (Rabinovich, 2019) 2 .
Consider, for example, a situation in which a firm has large interest-bearing items on both sides of its balance sheet. If interest rates were to suddenly go up, the resulting rise in financial incomes would be offset by increases in interest expenses, moderating any growth of financial profit. In Crotty’s measure, however, interest expenditure forms part of total expenditure which is subtracted from total income to form the denominator of the term. Measured this way, financial accumulation would spike every time interest rates increase since financial income would be boosted while the increase in total profit (the denominator) is moderated by the interest expenditure effect. It’s therefore not surprising that Fiebiger (2016) finds the trend in aggregate “financial accumulation” to have closed tracked prevailing monetary conditions, giving it a historical evolution that is very difficult to square with the standard narrative of a “turn to finance” driven by shareholder norms. The Crotty measure suggests that financialization crested in the late 1980s, with high interest rates, and then declined steadily since.
Direct evidence of the growing importance of financial income for US (and other) NFCs is therefore lacking. In practice, this has meant that the existence of financial accumulation as a generalized phenomenon has to be loosely inferred from the growing size of NFC financial portfolios. But early accounts linking balance sheet financialization to financial accumulation relied on macro data and erroneously included intangibles like goodwill in their measure of financial assets (Rabinovich, 2019: p.10). Firm level corporate databases which allow for a more fine-grained disaggregation of balance sheets offer a better vantage from which to study the financial habits of NFCs. However, Compustat, the most widely used dataset for public firms, appears at first glance to confute claims that NFC balance sheets have financialized. The first graph in the top panel of Figure 1 below displays ratios of financial to total assets of all available non-utility NFCs between 1980 and 2018 at different quartile breakpoints and in aggregate. It suggests that the long run trend has been toward less financialization for most firms. Only among the quarter, most financialized firms, by this measure, do we observe a steady increase of financial relative to total assets, occurring almost entirely between 1980 and 2000, whereafter the trend turns downwards. Soener (2020) in fact finds that the same pattern holds for most OECD countries.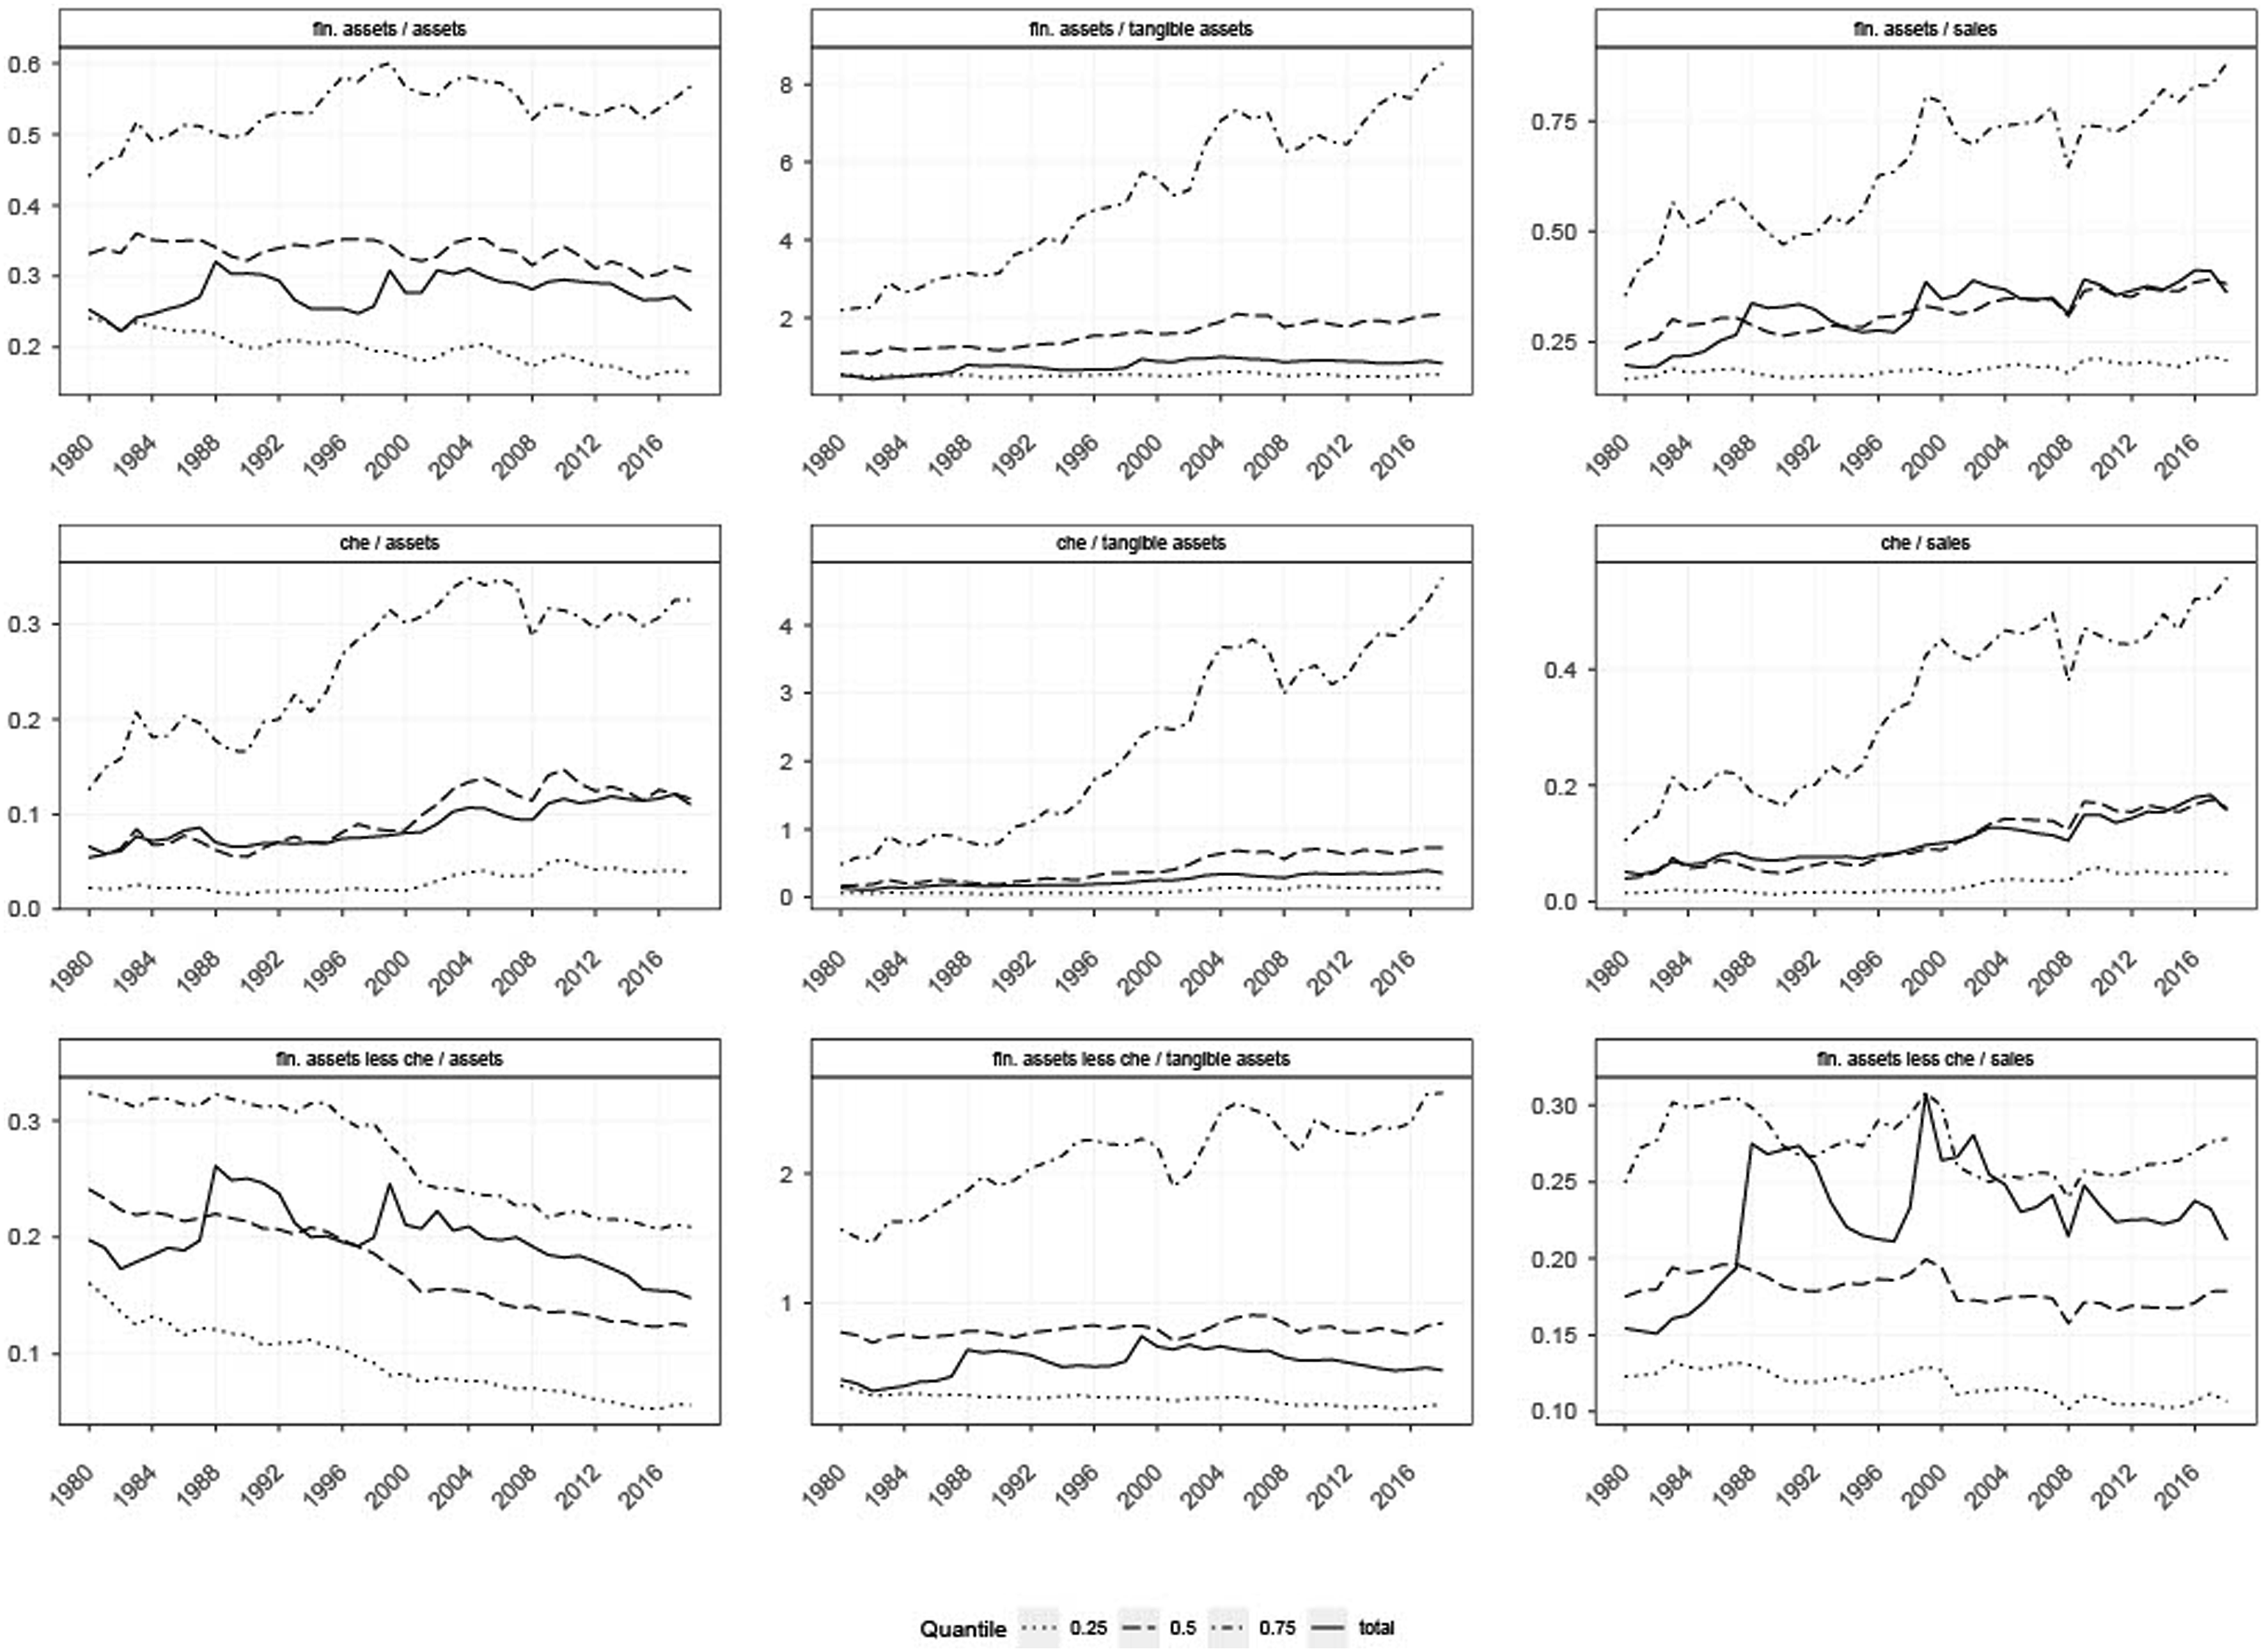
This conclusion is sensitive to the choice of denominator. Certain earlier studies reached stronger conclusions about financial accumulation by deflating financial assets by physical assets or sales. Here we do see more widespread balance sheet financialization and fairly extreme patterns manifesting at the top of the distribution (Figure 1, TOP panel, center & RHS). Financial to tangible assets for the median firm increased from 1.07 in 1980 to 2.08 in 2018. Increases for the top quartile of firms were nearly four times that. Much of the difference in trend from the first series is explained by the substantial increase in the importance of intangible capital for US NFCs over a similar period.
Therefore, depending on how one measures, it total financial assets have been gaining in relative weight either moderately or not at all for most firms, while more substantial increases are observed at the top of the distribution. However, this changes when we examine a crucial a sub-component of financial assets—namely, cash and short-term investments, Compustat item che. Officially, this category consists more liquid, less risky assets such as cash, cash-like time deposits, and most of the more conventional marketable securities like government bonds and stocks. However, a recent investigation drawing on regulatory accounting disclosures found that a substantial proportion of che—23.2% on average—is comprised of risky securities, most of which are also illiquid (Duchin et al., 2017: p.794). The graphs in the middle panel of Figure 1 plot the same ratios as above, but with the numerator switched to che instead of total financial assets. Here we see much stronger and more consistent upward trends. In fact virtually all of the growth in total financial assets is accounted for che (Figure 1, bottom panel and see also online appendix Figure A1).
Balance sheet financialization in the US therefore appears to be mostly a story about increased holdings of cash and short-term investments (henceforth “cash” or che). This is not necessarily inconsistent with the financial accumulation thesis—particularly if firms’ involvement in financial markets takes the form of trading and speculating. Financial service provision may be more associated with the accumulation of longer-term assets, but given the actual murkiness of che as a statistical category, as Duchin et al. (2017) discovered, it’s not impossible that rising che balances also partially reflect this form of financialization.
Of course, there are other reasons firms might be accumulating short-term financial assets. Contrary to claims that mainstream economics has been entirely blind to financialization, an extensive empirical literature in microeconomics and corporate finance has studied the phenomenon of growing corporate “cash piles” (Amess et al., 2015; Bates et al., 2009; Faulkender et al., 2019; Graham and Leary, 2018; Harford et al., 2008). It offers very different explanations for balance sheet financialization—centered on tax arbitrage and increased precautionary savings, which are discussed in more detail below.
Note that this literature assumes very different things about shareholder influence, believing that SVO will tend to lower financial balances as activist investors demand that cash holdings be “disgorged” to owners (Harford, 2008). Agency theorists were explicit that one of the best ways to discipline “empire-building” managers was to deprive them of control over excess funds (Jensen and Meckling, 1979). Fights over the control of cash piles indeed been at the center of many of the most prominent shareholder campaigns in recent years. Thus, it’s not easy to see why shareholders generally anxious about principal-agent problems would consent to NFCs becoming financial intermediaries on their behalf, unless those companies have some comparative advantage in this role (such as the ability to engage in profit shifting). The matter might be different when it comes to financial service provision, since here financial balances are essentially productive assets rather than retained earnings. On the other hand, financialization of this kind would seem to offend another cardinal principle of the shareholder revolution—the injunction to avoid diversification and focus on “core competencies” ((Zorn et al., 2004).
In summary, the evidence of a generalized “turn to finance” is at present weak. Growing financial portfolios might suggest such a turn, but could equally derive from other factors. If the theory of a financial turn is to be sustained it’s crucial to demonstrate the link between shareholder pressure and balance sheet financialization—which is what this paper aims to contribute.
Measuring shareholder power and manager incentives
In the financialization literature, “shareholder value orientation” is a somewhat slippery term. I adopt a narrow definition of it here—using it to denote a situation in which shareholder interests guide the decision making of managers. SVO presents inherent challenges for empirical work because it is at root a set of dispositions or cognitive frames held by managers that are non-observable. One way of trying to get at those dispositions could be to take managers at their word—examining their official statements for phrases that could directly or indirectly indicate the degree to which they prioritize different stakeholders. The problem here is that there is strong evidence of managers engaging in “symbolic management”—signaling their adherence to shareholder primacy through their language or surface level behavior but in practice acting according to their own prerogatives (Westphal and Zajac, 1998).
The main strategy for capturing SVO in the financialization literature has been to proxy for it using one of its assumed behavioral correlates, such as shareholder payouts. But this too has limitations. Even where we can reliably assume that a tendency to favor shareholders does promote such behaviors, rarely is it their sole cause—which will contaminate results. Payouts, for example, tend to increase when a firm experiences declining growth prospects, or when it expects windfall profits—both of which may related to cash holding decisions.
Here I take a different approach. Instead of trying to proxy for SVO or measure I directly, I employ variables related to its underlying causal mechanisms (Jung, 2015; Reddy and Rabinovich, 2022). It may be best to think of SVO as a continuous variable, with firms that are “more” SVO giving greater weight to shareholder concerns. Firms tend to give greater weight to shareholder interests when: (1) shareholders themselves gain more power over the firm and (2) managers develop common interests with shareholders as a result of changing incentive structures (Lazonick and O’Sullivan, 2000, Zorn et al., 2004; Davis, 2011). I adopt a range of measures related to (1) and (2) as my main independent variables.
Category (1), consisting of variables measuring shareholder power, primarily comprises various measures of ownership concentration. More concentrated ownership increases the voting power that shareholders possess and therefore strengthens their ability to use voice to effectuate pressure, either by actually voting against management or through direct engagement underpinned by the threat of oppositional voting. It also strengthens shareholder’s ability to use exit—selling shares or threatening to do so. In addition to ownership, I also examine variables that measure the extent to which the bylaws and board structure of the firm facilitate shareholder influence. Of principal interest in category (2) is a measure of stock-based remuneration which has been the main instrument for realigning managerial preferences (Stockhammer, 2004). I also examine the effect of CEO tenure—shorter tenures have been a way of de-entrenching managers from specific firms and aligning their career prospects with market metrics (Palley, 1997).
One key advantage of this method is that it allows me to account for a crucial element of complexity that is commonly elided, or assumed away, in the financialization literature—heterogeneity in investor preferences. Research on financial accumulation has typically relied on a binary distinction between profit-centric shareholders and growth-centric (Chandlerian) managers (Stockhammer, 2004). But this overlooks potentially significant variation in the time horizons and investment strategies of different kinds of shareholders (Jackson, 2011). It seems likely that pressure to distribute earnings and to focus on short-run returns will be higher in the presence of certain kinds of “impatient” investors and may even be exclusive to the influence of those investor types rather than being a feature shareholder primacy as such.
There is no consensus on which kinds of institutions are impatient, nor is the degree of impatience likely to be homogenous within institutional classes (Deeg and Hardie, 2016). In general, most investors with high portfolio turnover, who hold individual shares for short periods, will be impatient and focused on short-run returns. But longer holding periods are no guarantee of investor long-termism. Indeed, many of the institutions most associated with “short-termism”—like certain hedge funds and private equity firms—are long-hold investors who engage in activism to push through “value-enhancing” reforms, after which they typically exit the stock. I therefore adopt a dragnet strategy, using ownership data to separately examine the financialization effects of a wide range of investor categories defined by both portfolio turnover and institutional type. These categories are described in the next section.
Data
I use firm-level data from Compustat from 1997 to 2018 and include all active and inactive, publicly listed NFCs incorporated in the United States, excluding financial and utilities companies. Firms with missing or zero assets (Compustat item AT), net property plant and equipment (Compustat item PPENT), and sales (Compustat item REVT) are dropped. I restrict my sample to firms that have at least three consecutive years of data on all model variables. Observations are winsorized by 0.5% at the upper and lower bound in order to account for outliers. Firm-year observations tend to be fairly constant ranging between ∼700 and ∼1600 in different estimations, depending on the availability of SVO variables. Note A1 in the online Appendix describes how variables were merged across datasets.
Descriptive statistics.
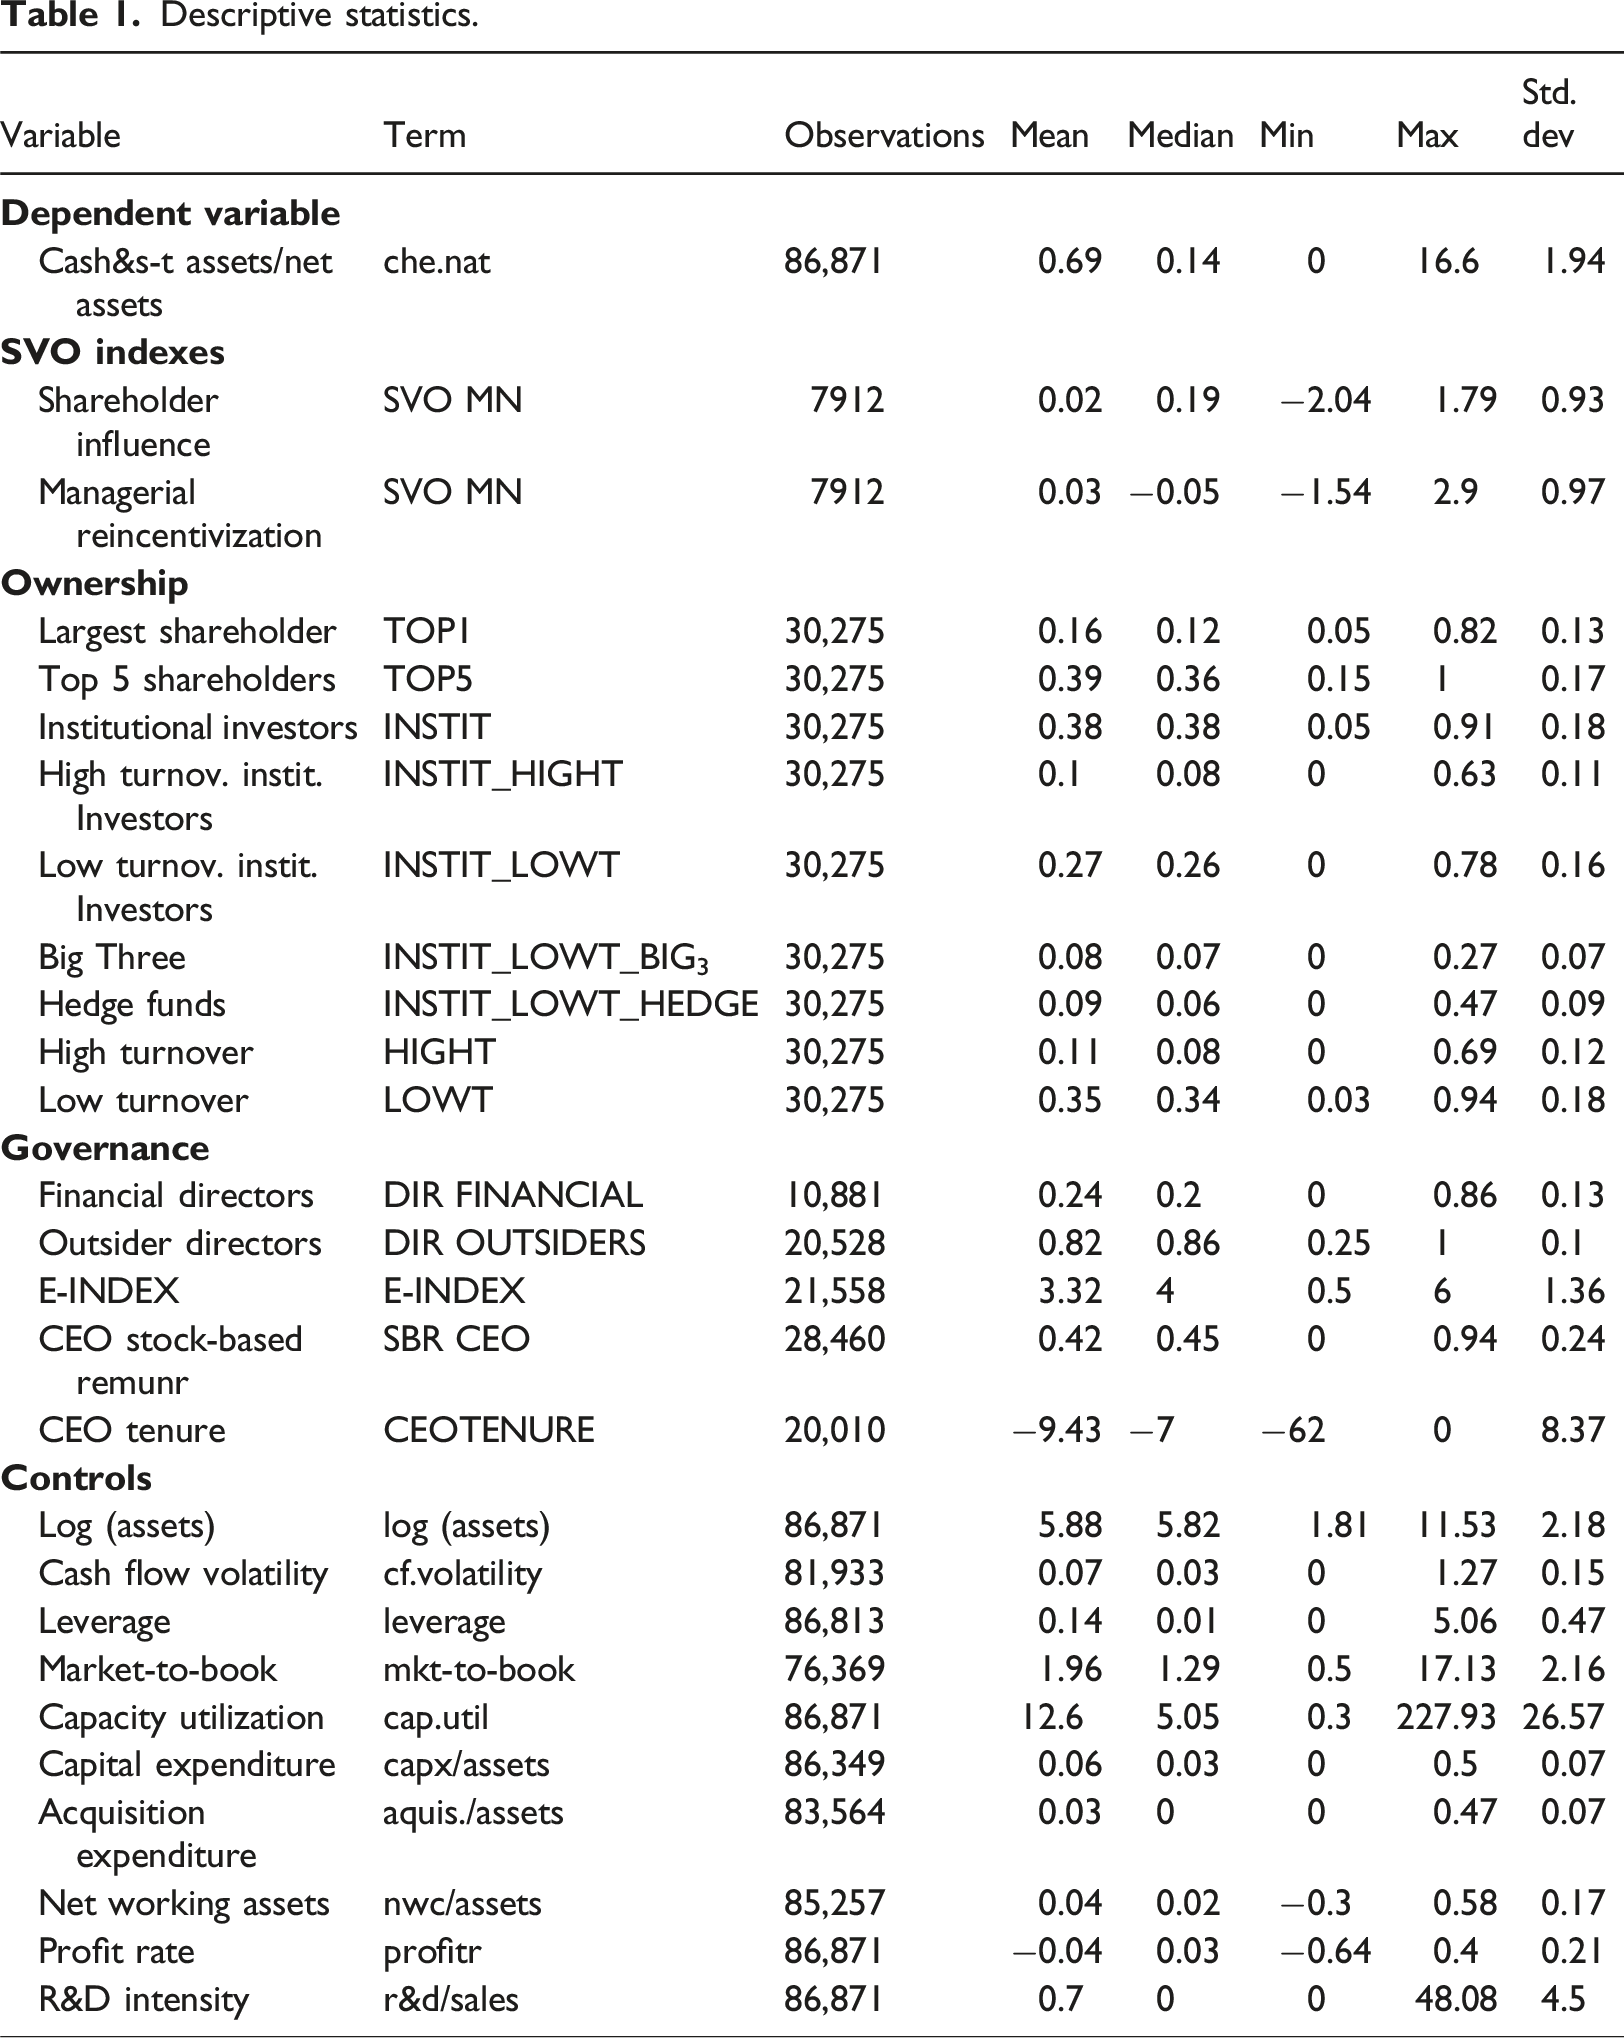
Next, I classify investors according to their portfolio turnover. HIGHT is the ownership share of the largest ten “high turnover” investors, defined as any investor whose portfolio turnover is characterized as “moderate” or “high” in Thomson Eikon. Moderate turnover is defined as an average holding period of between 1 year and 2 years, whereas high turnover is less than 1 year. LOWT is the same for “low turnover” investors. Since most research associates SVO specifically with institutional investors, I focus particular attention on this category and various of its sub-components, distinguishing firstly between high and low turnover institutional investors (INSTIT_LOWT and INSTIT_HIGHT). Within the former category, I then specifically examine the influence of the Big Three (Blackrock, State Street, and Vanguard) passive index funds (INSTIT_LOWT_BIG3) and hedge funds (INSTIT_LOWT_HEDGE).
Two remaining variables on shareholder power capture the extent to which the governance structures of the firm facilitate shareholder influence. From the Institute of Shareholder Services’ (ISS) Directors database, I calculate the percentage of the firm’s directors who are outsiders (DIR_OUTSIDERS) and the percentage that have a financial background (DIR_FINANCIAL) (only available post 2008). Outsider directors are typically seen as having more autonomy from management, while those with financial backgrounds can be expected to more sensitive to shareholder interests and ideologies. From the ISS Governance database, I construct the E-INDEX—widely used in corporate governance and management research—which is based on six provisions that have been shown to be most relevant for determining the extent of managerial “entrenchment”—such as whether the firm has a poison pill or golden parachutes for executives (Bebchuk et al., 2009).
I employ two variables related to managerial incentives. Firstly, using data from ExecuComp, I calculate stock-based remuneration of the CEO (CEO_SBR) as total stock reward, plus the total value of options awarded, divided by total compensation. Secondly, from the ISS Governance database, I calculate CEO tenure (CEO_TENURE) as the number of years the incumbent CEO has spent at the firm. Both these variables are averaged in instances where there are multiple CEOs.
I used principal-component factor analysis (PFA) to construct two indexes from these variables. Online Appendix Table B1 presents the results of the PFA with varimax rotation applied to four variables, CEO stock-based remuneration (CEO_SBR), CEO tenure (CEO_TENURE), holdings of the largest shareholder (TOP1), and the percentage of financial directors (DIR_FINANCIAL). The factors lend themselves to convenient interpretation. The first factor loads heavily on SBR_CEO and CEO_TENURE. These are variables that measure the extent of managerial alignment with shareholders. The second factor is loads heavily on the variables related to shareholder power through ownership and governance structure. The first index I employ, SVO_manager, is thus constructed from the scores of factor 1 and can be thought of as capturing managerial reincentivization. The second index, SVO_shareholder, captures shareholder influence.
Ownership and governance variables have more limited availability than most Compustat variables: mean 30,275 and 20,287 observations compared to 84,777 for controls. This means that focal estimations are in practice sub setting fairly heavily. Appendix B2 constructs sub-samples based on the full availability of model covariates and compares descriptive statistics. The ownership sub-sample consists of firms for which TOP1 is non-missing while the governance sub-sample contains all firms with non-missing CEO_SBR. The “larger firms” sub-sample consists of the top two quintiles by asset size. Differences are non-trivial, with notable disparities in mean assets and revenues. To gauge the implications of this, I estimate a basic investment model on each of these samples in Table B3 in the online Appendix. There is broad consistency across samples in the direction, significance and magnitude of regression estimates. R2s are likewise similar, with the models slightly better fit for SVO sub-samples potentially again reflecting the fact that these are larger firms with more institutionalized governance. While we caution should be retained in generalizing results to smaller firms, these consistencies alleviate concerns that SVO sub-samples are entirely distinctive.
Model and estimation strategy
I employ the following model: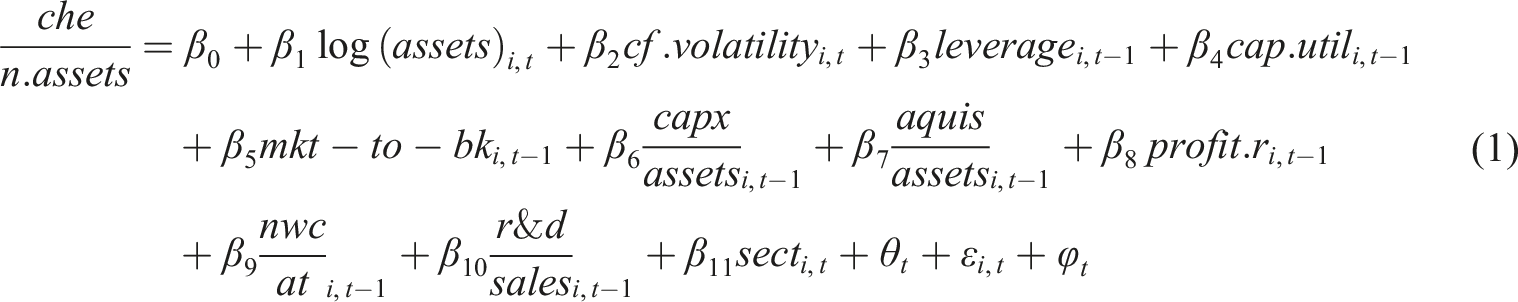
To each of these models, I then add in governance variables separately for each estimation. The E-Index and CEO tenure variables are sign inverted such that all variables have the same direction of association with SVO—higher values reflect either greater shareholder influence, or closer alignment of managers with shareholder objectives. The financialization literature predicts that these variables have uniformly positive association with che/n.assets. It’s possible, however, that investor heterogeneity is a factor—in which case we would be most likely to observe positive effects only with impatient investor types. Mainstream research proffers contrasting predictions for governance variables where shareholders are more powerful, and managers more attuned to, and aligned with, their interests we should expect a tendency for firms to more quickly “disgorge cash” and hence lower financial holdings.
I employ two estimation methods, both of which test the impact of corporate governance on changes in financial holdings. First, I follow a frequent practice in the corporate finance literature, applying OLS but including a 1 year lag of the dependent variable (“pooled OLS”) (Harford et al., 2008). Standard errors are clustered at the firm level in these estimations. Second, following the standard approach in the heterodox literature, I employ a within-effects model with firm-level and year fixed effects and robust standard errors (Davis, 2018). This has the principal benefit of controlling for endogeneity arising from unobservable individual heterogeneity, which would lead to OLS results to be biased. The inclusion of time fixed effects also allows me to control for elements that vary over time but affect firms in the same way such as macroeconomic shocks as well as industry-specific factors. Sector dummies which have no within-firm variation are dropped from these estimations.
Results
FE estimations of model 1, index variables, and full sample.
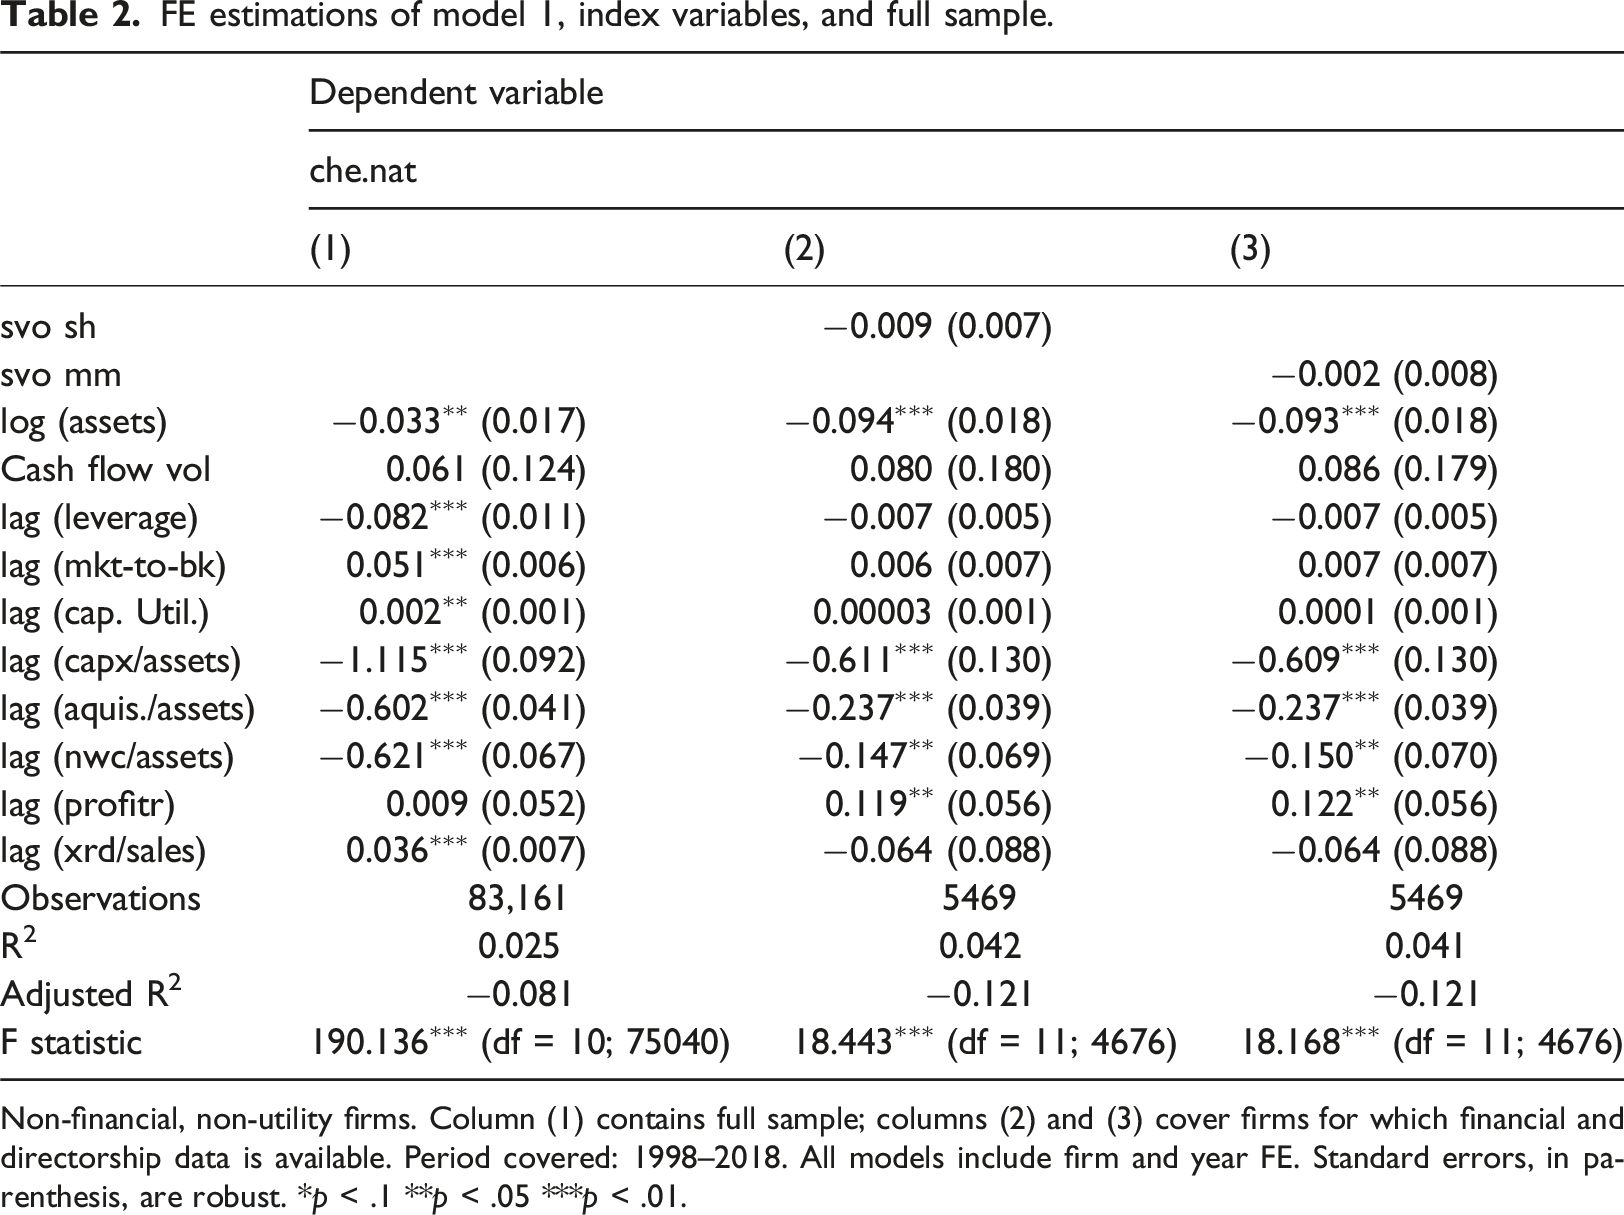
Non-financial, non-utility firms. Column (1) contains full sample; columns (2) and (3) cover firms for which financial and directorship data is available. Period covered: 1998–2018. All models include firm and year FE. Standard errors, in parenthesis, are robust. *p < .1 **p < .05 ***p < .01.
In the next step, indexes for shareholder influence and managerial realignment are added to the model, which is then re-estimated on the much smaller sample of firms for which these variables are available. The coefficient on both indexes is negative but neither is statistically robust and this is the same across estimation methods. Note that FE models have an extremely small adjusted R-squared—which is consistent with the finding from elsewhere that within-firm changes have accounted for little of the overall change in che balances (Graham and Leary, 2018).
Regression estimates and standard errors (in parentheses) of focal SVO variables, che/nat.
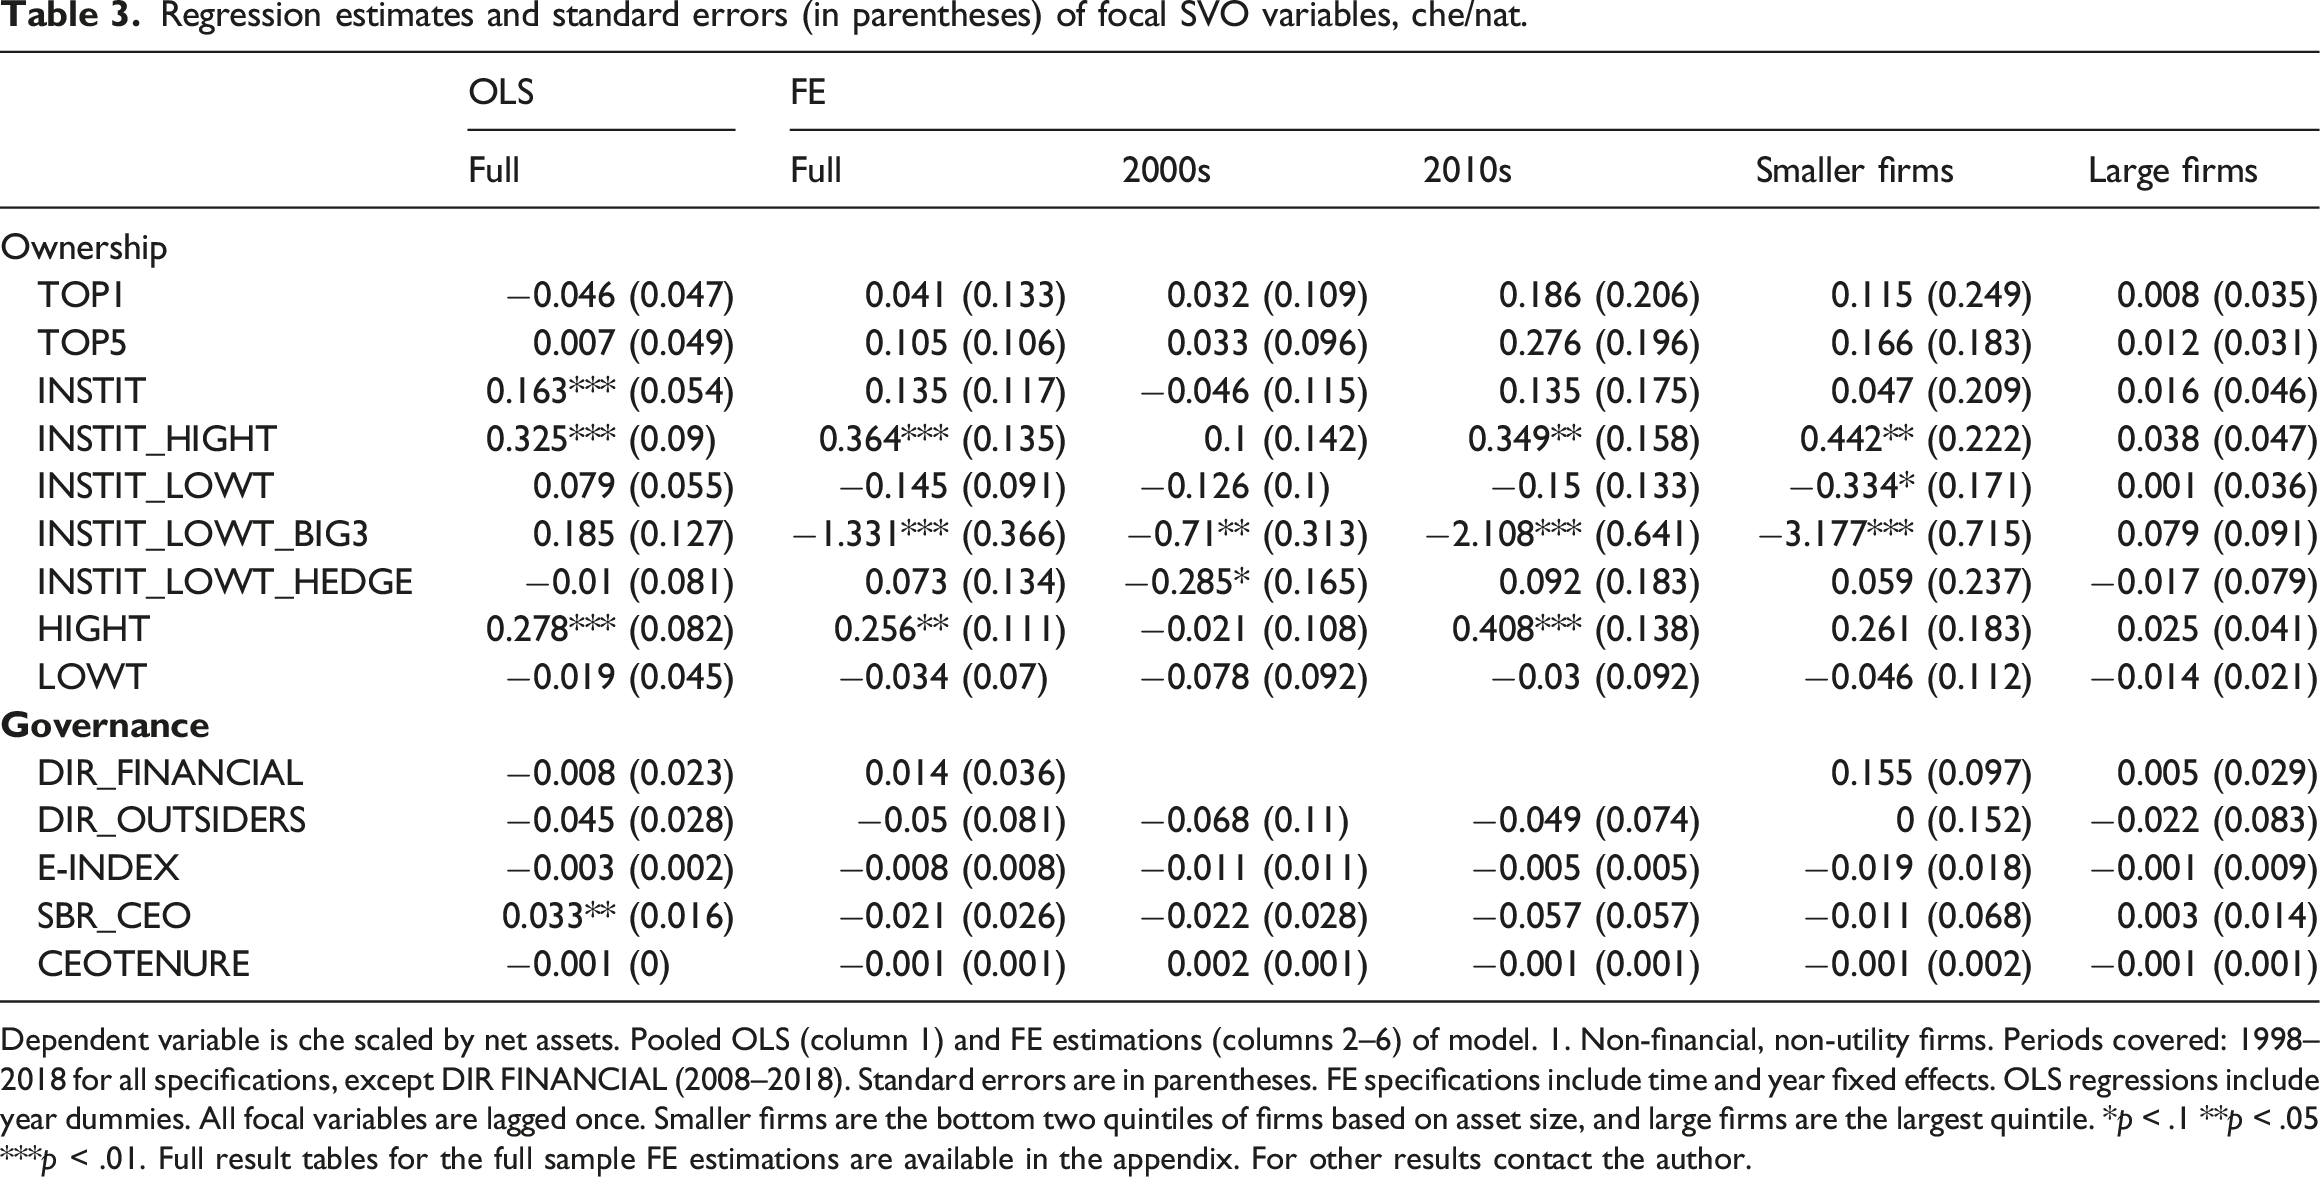
Dependent variable is che scaled by net assets. Pooled OLS (column 1) and FE estimations (columns 2–6) of model. 1. Non-financial, non-utility firms. Periods covered: 1998–2018 for all specifications, except DIR FINANCIAL (2008–2018). Standard errors are in parentheses. FE specifications include time and year fixed effects. OLS regressions include year dummies. All focal variables are lagged once. Smaller firms are the bottom two quintiles of firms based on asset size, and large firms are the largest quintile. *p < .1 **p < .05 ***p < .01. Full result tables for the full sample FE estimations are available in the appendix. For other results contact the author.
In columns (3) and (4) of Table 3, the FE model is re-estimated for each governance variable for two sub-periods, 2000–2008 and 2010–2018. In columns (5) and (6), it is re-estimated on asset size sub-samples: “smaller firms” (the bottom three quintiles) and “large firms” (the top two quintiles). The positive effects of high turnover ownership appear to be concentrated in more recent periods and among smaller firms. The same goes for the negative associations of Big Three ownership. Effect sizes are magnified in each case. Big Three ownership appears to be a significant factor for smaller firms, a one standard deviation increase in concentration decreases financial holdings for smaller firms by 14%. The results indicate that governance only really affects balance sheet behavior for smaller firms and only in more recent years.
Governance variables, both those related to shareholder influence and managerial realignment do not, on their own, appear to have any substantive effect on balance sheet behavior. There is some weak evidence that share-based remuneration encourages financial accumulation in the pooled OLS model but this is not robust to estimation method or sub-sampling. No other governance variable was found to be statistically significant below the 10% level. This could be because reincentivization instruments such as stock-based remuneration simply do not work as intended. As some have argued, such policies might allow managers signal an alignment with shareholder interests, while in fact allowing them to continue serving their own priorities (Westphal and Zajac, 1998).
A different possibility, suggested by the foregoing set of results, is that shareholder heterogeneity confounds the effects of these variables on firm behavior. Reincentivization mechanisms might actually work in getting managers to more proactively cater to shareholder interests, but since they will in each case be serving a different mix of investors with distinctive preferences, such mechanisms have no consistent association with behavioral outcomes on their own. To explore this further I interacted CEO_SBR with TOP5, INSTITUT_HIGHT and INSTITUT_LOWT and included these terms in three separate re-estimations of the FE model (Appendix Table A7). Interaction and separate terms for CEO_SBR remained insignificant in the first and last cases, but the coefficient on the CEO_SBR*INSTITUT_HIGHT was fairly substantial (0.899) and significant at the 1% level—indicating that reincentivization mechanism may be effective in the presence of well-defined shareholder interests.
The focus on che was motivated by the fact that this category has driven the rise in financial balance sheets. Yet in principle SVO effects might also apply to assets not captured by this variable. I therefore examine a range of different outcome variables. I firstly decompose che into cash (Compustat item CH) and short-term assets (IVST). Secondly I calculate long-term assets as investments and advances equity (IVAEQ) and other (IVAO). Third I calculate total financial assets as total assets (AT) minus physical (PPENT), intangible (INTAN) other (AO), inventories (INVT), receivables (RECT), and other current assets (ACO). Fourth, I calculate non-cash financial assets as total financial assets less cash. And finally I examine receivables on their own. Each of these is normalized by net assets. Table A8 (online appendix) reports coefficient estimates and standard errors for focal SVO variables regressed on each of these categories with model 1 covariates and firm and year fixed effects. These results suggest, firstly, that the balance sheet effects of high turnover investors are concentrated on short-term investments rather than cash. Residual asset categories are also affected—the coefficient on total financial assets is larger than that on short-term assets. This is consistent with the hypothesis that profit rather than precautionary motives are driving asset acquisition. On the other hand, Big Three ownership appears to discourage both cash, short-term investments and residual categories. Long-term assets, at least as defined in Compustat, appear to be less impacted generally by SVO.
Normalizing the outcome variable by net assets is a more or less universal standard in the financial assets literature, which is justified by a need to control for considerable variation in operating scale and hence balance sheet size. However, methodologists have long pointed out that ratios can bias regression results. In particular, Certo et al. (2020) show that growing dispersion in the denominator of a ratio can influence the relationship between dependent and independent variable, even while unscaled correlations are unchanged 4 . As a robustness check I therefore test the model on an unscaled outcome variable: log che, while transforming ratio covariates to logs. Table A9 in the online appendix again reports regression estimates and std. errors across focal variables. The findings above fail this robustness test. SVO variables in the transformed model appear to have no real significance for balance sheet behavior. Only top shareholder concentration (TOP1) has a p-value below 0.05 with a negative sign, contradicting the financialization hypothesis.
Discussion
The results here appear to provide some fragile support for financialization theories. They suggest that in certain cases, SVO might lead firms to accumulate more financial assets—contradicting what mainstream accounts would suggest. However, they also show that this is not an effect associated with the rise of shareholders as a broad stakeholder category, but rather with specific kinds of shareholders, in particular institutional investors with high turnover investment strategies. Given that they tend not to hold shares for any length of time, such institutions can be safely classified as “impatient” investors in the sense of being oriented toward short-run returns, with little concern for the firm’s long-term viability. The fact that they would have stronger effects on balance sheet behavior is thus consistent with the main mechanism of financial accumulation posited by financialization theory, which hinges on the short-term constraints imposed by shareholders over the firm 5 .
However, the magnitude of the effect associated with impatient investors is small. At the largest estimate, a one (within-firm) standard deviation increase in the ownership share of high turnover institutions is associated with an increase of only 3% of the standard deviation of che/nat. Moreover, we observe opposing and much stronger effects in relation to low turnover investors, specifically the Big Three index funds. This might suggest that passive asset managers relieve pressure on managers for short-term financial accumulation. Over the period of our study, investor classes associated with financial dis-accumulation have been increasing significantly faster than those associated with the opposite. In fact, median ownership by impatient capital declined during the post-GFC period (Figure 2). The sub-period analysis above showed that this was when financial accumulation effects were strongest. That same time frame saw a massive acceleration of “asset manager capitalism” with the Big Three index funds significantly expanding their holdings (Braun 2020). This would suggest that in fact shifting patterns of ownership and shareholder empowerment have acted as a countervailing force against balance sheet financialization, at least since the 2008 crisis. Ownership by investor category at quantile breakpoints, 1998 - 2018. All non-financial, non-utility firms with available data in Thompson Reuters.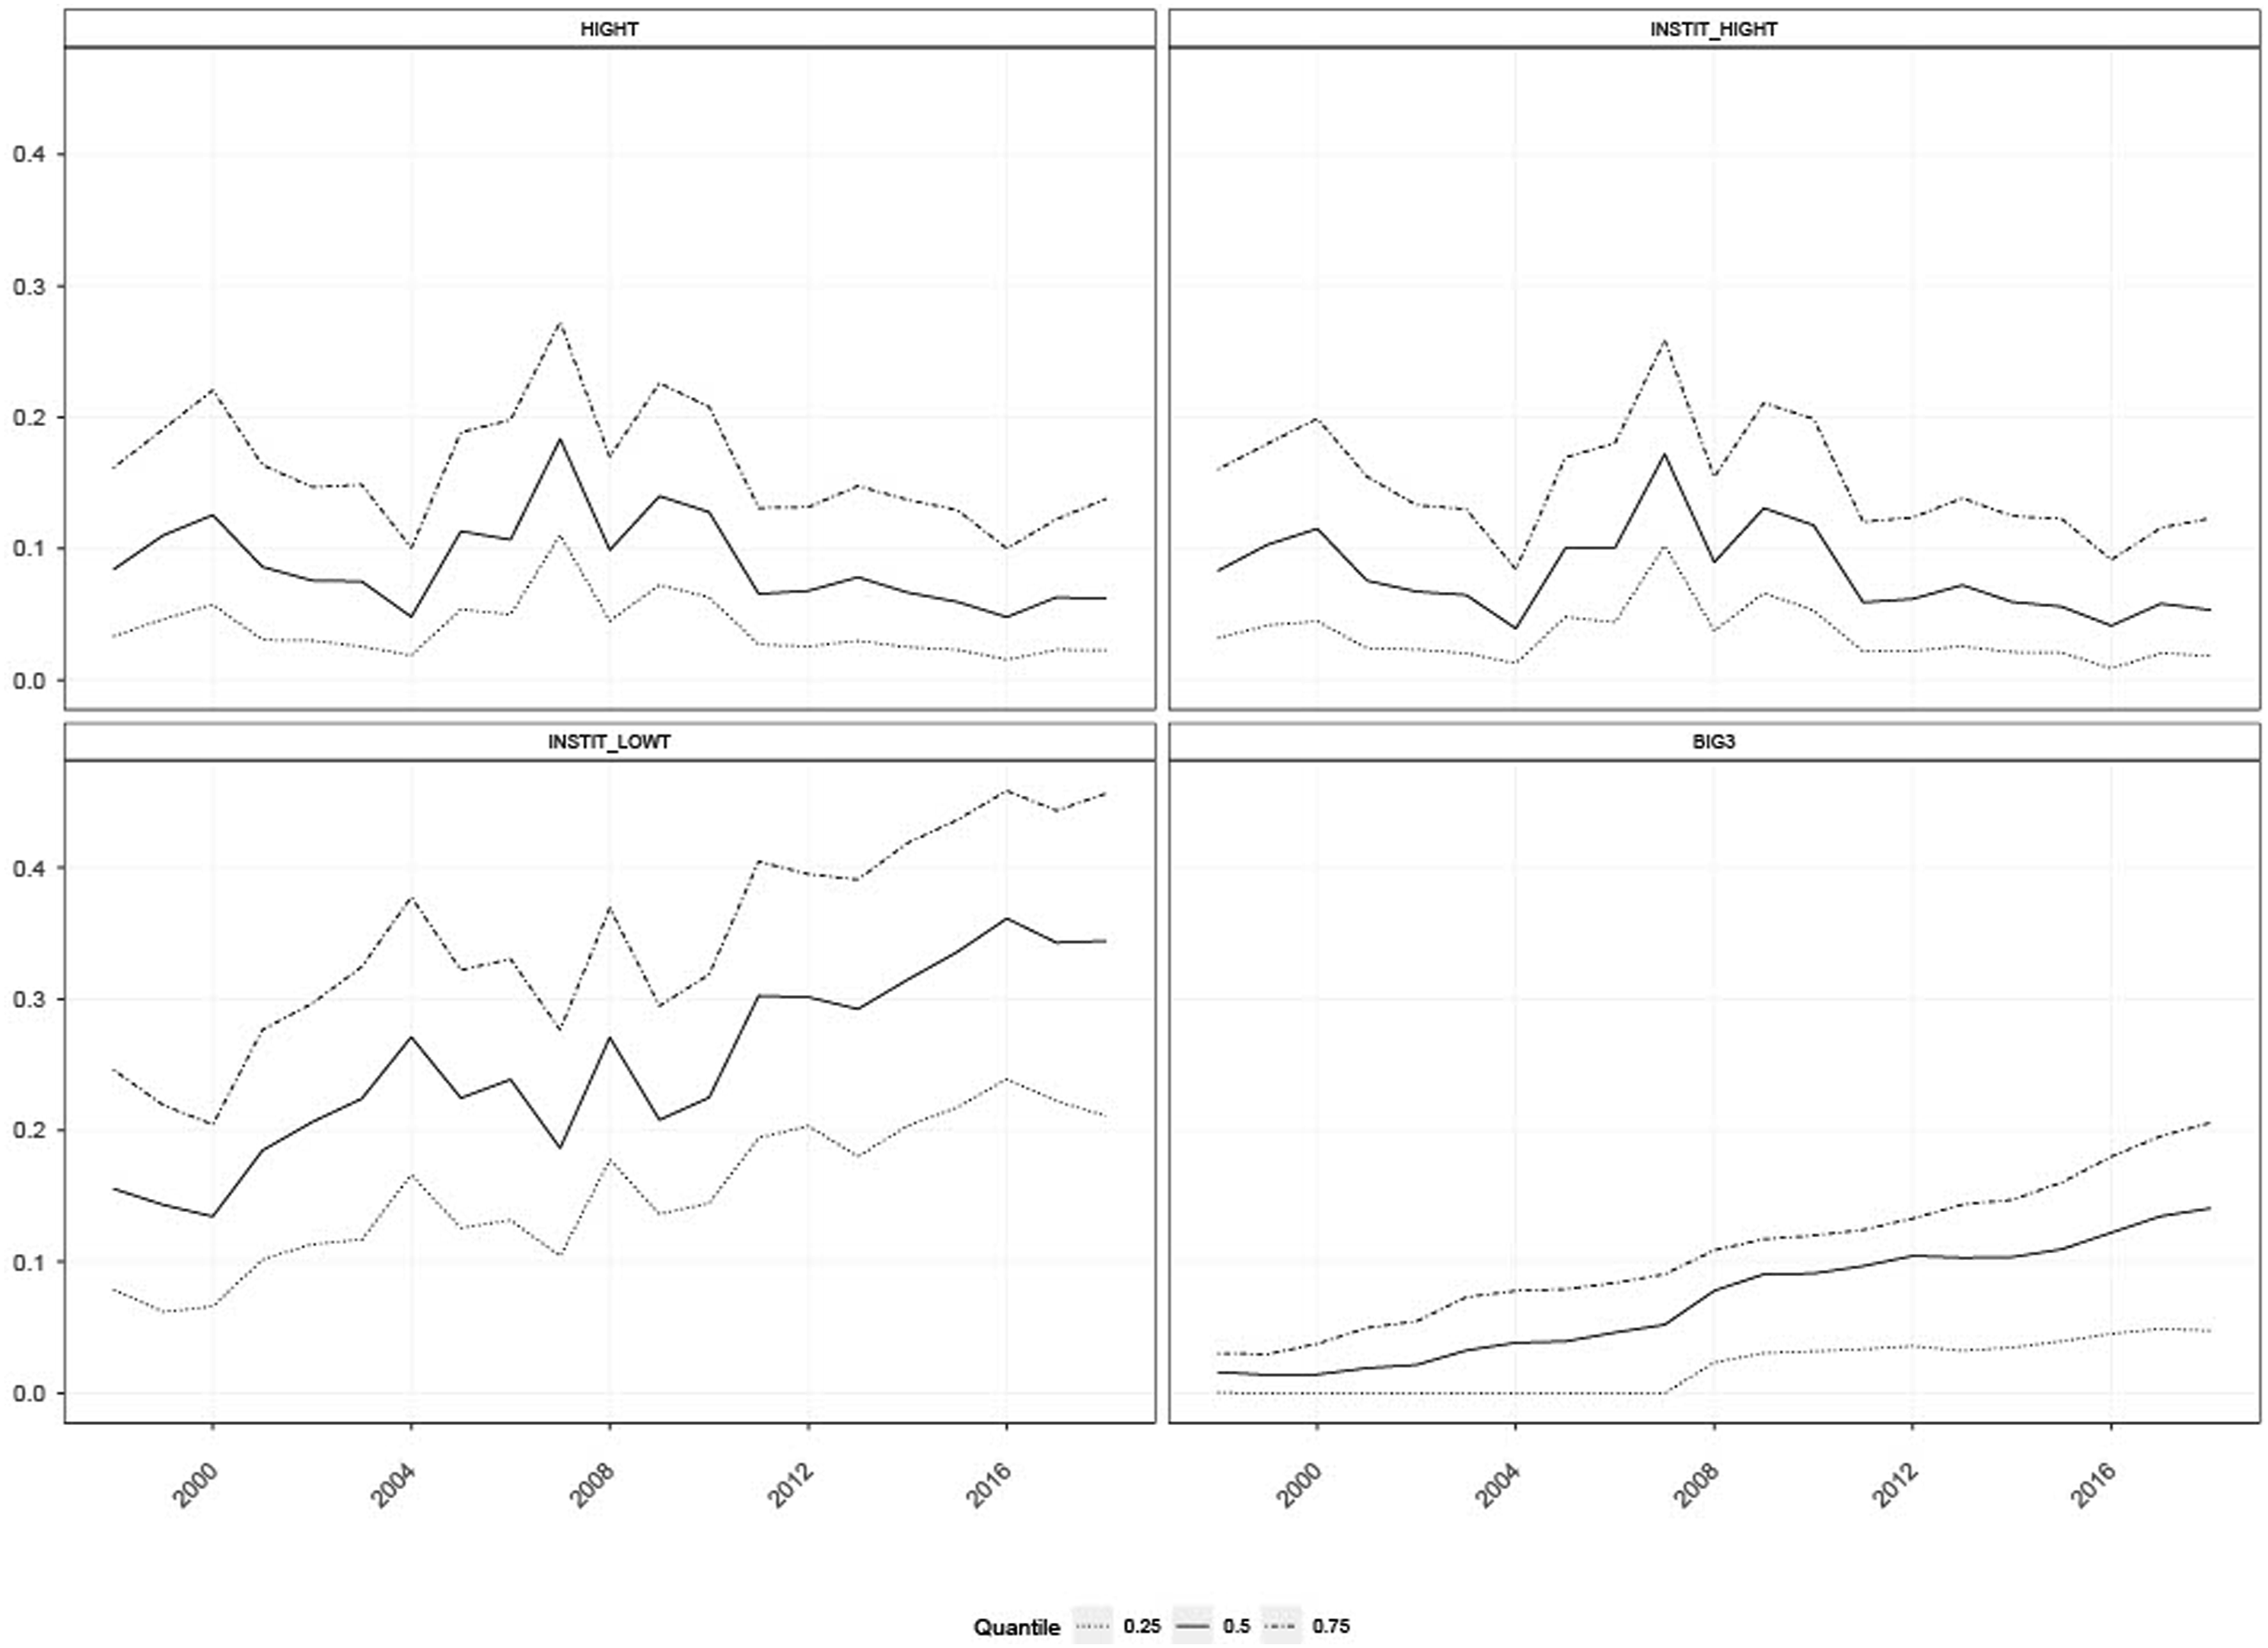
Furthermore, the financial accumulation effects of impatient capital do not hold for large firms. There is no obvious answer of why this is, it might be a function of power dynamics—investors are able to exert more influence over smaller firms—or simply that other factors confound investor influence in larger firms, where financial management is more institutionalized. This is a problem for financial accumulation theories because large firms are responsible for virtually all of the aggregate increase in financial balances (even if the average size of their financial balance sheets is smaller—online appendix Figure A2)—which is the main phenomenon that those theories sought to explain. Finally, we should recall that even these smaller and restricted effects were not found to be robust to the use of an unscaled outcome variable. Collectively, these findings suggest that changing governance priorities can only account—if at all—for an extremely small fraction of the overall accumulation of financial assets by NFCs.
If not because of shareholder pressure, why did NFCs suddenly start piling up short-term financial assets? Mainstream research, overlooked by financialization scholars, seems to provide compelling answers. It identifies two main causes of balance sheet financialization. The average size of financial balance sheets (relative to assets) seems to have driven up primarily by the entrance into the market of small technology intensive firms, mostly NASDAQ listed (Appendix Figure A3) (Graham and Leary, 2018). Given riskier business models, these firms have high demand for precautionary savings. They tend to have lower stocks of net working capital, are more reliant on R&D, and have lower capital expenditure. The results above confirm that all of these variables are significant in determining the demand for financial assets. Shrinking nwc stocks in part reflects a shift to just-in-time production (Gao, 2017) while R&D intensification and intangibilization are emblematic features of a more information driven economy. In this sense, what larger financial portfolios reflect is not an attempt to escape from the “real” economy as Marxists have tended to argue, but an attempt by newer firms to adapt to the changing structural realities of that economy in a more globalized and digitized world. Appendix Figures A4 suggests that industry-specific factors are important for balance sheet financialization.
However, the story is very different for the giant firms that have been responsible for aggregate growth of financial balance sheets, most of which have high credit ratings and low demand for precautionary savings (Figure A2). Using non-public BEA data, Faulkender et al. (2019) demonstrate that 85% of the increase in che balances amassed by corporations since the late 1990s is accounted for by offshore holdings. Just 10 firms controlled over two-thirds of the total stock of (disclosed) liquid offshore savings in 2017 (Poszar, 2018). The largest six portfolios were all held by technology majors: Apple, Microsoft, Cisco, Oracle, Alphabet, and Qualcomm. Pharmaceutical giants J&J, Pfizer, Amgen, and Merck comprised the remainder of the top 10. These are all archetypes of the tech-intensive “superstar firms” that have risen on the back “winner-take-all” dynamics and scalability in intangibilized markets (Autor et al., 2020). In this sense, monopolization does seem to have had something to do with balance sheet financialization, as Sweezy (1994) long ago suspected. Super profits accruing to superstar firms with low propensity to invest have found their ways in to financial markets (Soener, 2020). Yet increasing market power has been a fairly widespread phenomenon. Why did these firms retain huge financial portfolios rather than distributing super profits to shareholders as other monopolies have done?
The answer appears to lie in their capacities for profit shifting. Knowledge intensive multinationals of this kind have greater scope for reallocating profits to low tax jurisdictions by re-assigning ownership of intellectual property, like patents. Faulkendar et al. (2019) demonstrate that offshore balances are overwhelmingly concentrated in multinationals with large intangible asset stocks and high “related sales” (between subsidiaries). They show that these balances increase with falling overseas tax rates. Tax arbitrage, in other words, seems to the primary motive for the amassing of giant cash piles. While CEOs cannot openly admit this, it appears to be an open secret among market analysts (Poszar, 2018).
This puts a somewhat different spin on the connection between internationalization and financial asset accumulation noted by numerous heterodox scholars. Explanations of this connection focus again on surplus profits garnered by lead firms in global value chains (Milberg, 2008; Milberg and Winkler, 2010; Soener 2020), and on “Nikeification” and the shift to intangibilized business models (Auvray and Rabinovich, 2019; Soener, 2020), which have made it easier to “recycle earnings into financial activity” (Soener, 2020, p.550). Such accounts are plausible and potentially complementary to arbitrage focused explanations. But they need to be directly verified by mechanism-focused empirical research—the current evidence in their favor does not go beyond a general association between internationalization/intangibilization and larger financial balance sheets.
Control of these giant “cash piles” has inevitably led US multinationals to engage more heavily in financial activities and in several important cases to develop separate financial wings, often under subsidiary asset management companies like Apple’s Braeburn Capital and Oracle’s Delphi. The scale of the funds at their disposal have made them into systemically important players in key markets, such as US corporate bonds, where the 30 largest NFC investors accounted 5% of outstanding debt in 2017 (Platt et al. 2017). Apple’s total credit portfolio that year was only slightly smaller than JP Morgan’s and considerably larger than Wells Fargo’s (Pozsar, 2018: p. 15). Microsoft, which focused on treasuries rather than corporate bonds, had the second largest public debt portfolio of any US entity, bigger than three of the top four banks (Pozsar, 2018: p. 16). An investigation of its balance sheet operations by the Financial Times suggested that it was emulating professional money managers, lending out its safe assets in transactions that resembled reverse repurchase agreements (Scaggs, 2017).
Pozsar (2013) shows that multinational “cash pools” were a key source of demand for privately guaranteed deposit alternatives given a shortage government guaranteed instruments, fueling the rise of the shadow banking industry. In order to be able to pay out to shareholders while avoiding repatriation taxes, these firms have raised large amounts of their own debt in (US) domestic bond markets. They’ve thus profited healthily from a consistent spread between their own highly rated issuance and those of the other NFCs to which they are ultimate lenders (Pozsar, 2018)—even though security and liquidity rather than yield remain the dominant principles of their financial management strategies (Pozsar, 2013).
A subset of major US multinationals have thus diversified heavily into finance and no doubt generated handsome profits as a result. Yet, because the motives driving this process are very different from those proposed by the financial accumulation thesis, so likely are the effects. It’s very difficult to imagine that access to financial income has diminished the focus of these firms on core productive activities or “crowded out” their capital expenditure. The most financialized are, as we noted, almost all “superstar firms”—a term coined to describe the divergence in fortunes between a handful of top-tier corporations and “the rest” of the global economy (Bajgar et al., 2019). Superstar firms stand out for extraordinary rates of profitability and productivity, and for the extent to which they have achieved dominance over the markets in which they operate. However successful their ventures into finance, they are unlikely to have any displacing effect on core operations, which are what have made such ventures possible in the first place. The dependence of financial investments on core activities also makes it unlikely that the internal balance of power within these firms has been significantly transformed as a result.
Conclusion
The field of financialization comprises an extremely broad and diverse set of theories concerning the ways that a more prominent and powerful financial sector is reshaping fields of action in different areas of social and economic life. This paper has investigated one well-defined sub-theory within that broader corpus: the claim that non-financial public firms have reoriented themselves, en masse, away from productive and toward financial activities. This theory underpins one of the major interpretive approaches to financialization, which sees it as a distinctive “regime of accumulation” marked by a growing tendency for profits to accrue through financial channels rather than productive ones (Van der Zwan, 2014). Such approaches occupy an important place with the broader field, because they connect financialization to the macro-dynamics of contemporary capitalism. Numerous empirical studies have conceptualized and verified specific mechanisms through which financial accumulation has been a driver of secular stagnation (Stockhammerm, 2004; Tomaskovic-Devey et al., 2015) and rising inequality (Huber et al., 2022; Lin and Neely, 2020).
Yet this paper has argued that the financial accumulation thesis misinterprets the shifting terms of engagement between NFCs and the financial sector. It showed that the growth of financial balance sheets has been driven by short-term liquid assets. I found some evidence that SVO can, in certain cases, encourage the accumulation of such assets—but I also showed that it explains very little of the overall changes witnessed in the last several decades. Drawing on mainstream corporate finance and economic research, I offer an alternative account of financial balance sheet growth which has two parts to it. Firstly, growing demand for precautionary savings, particularly amongst newer, smaller, research-intensive firms which has driven up the average ratio of financial to other assets. Insofar as there has been a “financial turn” among these firms, it’s been driven by the conventional motives for engaging with finance—the need to manage risk and liquidity—rather than through a search for alternative forms of accumulation.
Secondly, the amassing of giant “cash piles” by large multinationals which have been discouraged by existing tax laws from repatriating and distributing earnings. Here, NFCs have turned to financial markets as an outlet for investment. Their behavior does not, however, reflect any fundamental shift in the underlying modalities of capitalist accumulation. Rather, it is far more institutionally contingent: an arbitrage response to a multijurisdictional tax regime. Accordingly, changing tax legislation appears to be having dramatic effects on the balance sheet behavior of these firms and may eventually lead to the unwinding of their financial positions. President Trump’s 2017 Tax Cuts and Jobs Act abolished the 35% profit repatriation tax, requiring instead that companies pay a one-off charge of between 8 and 15.5% on overseas earnings made since 1987, after which they can be freely repatriated. In the year following its enactment, a reported US$1 trillion was returned to US jurisdictions (most of which was channeled quickly into massive stock buybacks, disappointing hopes for an uptick in investment). Apple alone returned over US$100 billion to shareholders in 2021 as part of plans to become “cash neutral.”
If this interpretation is accurate, it would call into question many of the mechanism thought to link the growth of financial balance sheets and incomes to changing patterns of investment and distribution. Further research stands to shed light on why it is nevertheless the case that so many studies have found an association between those outcomes and deeper financial engagement.
Supplemental Material
Supplemental Material - Shareholder value orientation, corporate cash piles, and the myth of financial accumulation
Supplemental Material for Shareholder value orientation, corporate cash piles, and the myth of financial accumulation by Niall Reddy in Competition & Change
Footnotes
Acknowledgments
I would to thank Joel Rabinovich for assistance with data and generous pointers along with Siwei Cheng, Vivek Chibber, Paul DiMaggio, Stephen Gelb, the participants of NYU’s Economic and Political Sociology seminar, and SASE’s Early Career Workshop.
Declaration of conflicting interests
The author(s) declared no potential conflicts of interest with respect to the research, authorship, and/or publication of this article.
Funding
The author(s) received no financial support for the research, authorship, and/or publication of this article.
Supplemental Material
Supplemental material for this article is available online.
Notes
References
Supplementary Material
Please find the following supplemental material available below.
For Open Access articles published under a Creative Commons License, all supplemental material carries the same license as the article it is associated with.
For non-Open Access articles published, all supplemental material carries a non-exclusive license, and permission requests for re-use of supplemental material or any part of supplemental material shall be sent directly to the copyright owner as specified in the copyright notice associated with the article.