
Abstract
In the literature on financialized growth, two models are often presented as complementary but opposing: some countries drive their domestic demand through debt, while others grow on the basis of exports. In this research, we identify Sweden as a country that in the midst of the financial euphoria preceding 2008 combined these two models simultaneously. By identifying this “debt&export-led” growth model, we add richness and taxonomic complexity to the literature on financialized growth models. That said, this research contributes especially to the debate on the Swedish growth model, revealing a “hybrid” model that resulted from the interaction of two sets of factors: i) the presence of a successful exports sector, driven by a commensurate regulatory framework in a context of strong international demand; and ii) the manner in which financialization operated in Sweden, through a historic increase in private debt levels simultaneous with a partial dismantling of the welfare state.
Introduction
The literature on financialized growth regimes was consolidated in the 2010s through observation of macroeconomic dynamics seen in (and across) mainly developed countries since the turn of the millennium. The specified number of “financialized” models varies from author to author, but an apparent consensus has emerged around the existence of two opposing growth models. On the one hand, debt-led countries (the United States, Spain, and Greece, among others) took advantage of financial expansion to capture foreign inflows in order to finance domestic consumption and investment. On the other, countries with export-led growth models (for example, Germany and Austria) based their growth on foreign demand (see Oatley, 2011; Hein and Dodig, 2012; Stockhammer, 2009; Stockhammer and Onaran, 2013; Lavoie and Stockhammer, 2013; Cardenas and De Arribas, 2021, Akcay et al., 2022, etc.).
While these models are indeed opposites—one based on credit-driven domestic demand, the other on external demand—several papers have stressed their complementary relationship: debt-led growth-model countries feed demand for the output of exporting countries. At the same time, the latter group invests in the former (Hein and Dodig, 2012; Stockhammer, 2009).
Recently, Barredo-Zuriarrain (2019) noted the possibility of a country simultaneously combining characteristics of both the export-led and debt-led models, where rising debt levels boost domestic demand along with large (even increasing) trade surpluses.
In this research, Sweden is identified as having followed a hybrid “debt&export-led” growth model between 2000 and 2008. By way of a political economy analysis complemented by the consideration of macroeconomic issues, we seek to discover the combination of factors that led Sweden to combine these two models with opposing features: on the one hand, a positive and growing external balance that strengthened its creditor position with respect to the rest of the world, and on the other hand, an increase in the level of gross domestic private debt that helped to boost demand.
The paper contributes to the recent literature on the Swedish growth model by bringing a new perspective, presenting a hybrid model that resulted from the interaction, in a period of international financial expansion, of elements specific to the country’s process of financialization and its industrial policy in a broad sense.
Firstly, financial deregulation and a partial dismantling of the welfare state favored private indebtedness, but also a more active role for families and corporations in terms of financial investment. In the run-up to the 2008 crisis, this translated into booms in both consumer and housing-related credit as well as a robust accumulation of financial assets.
Secondly, we find that a number of elements have contributed to the success of the country's external sector. On the one hand, industrial and regulatory policies, combined with wage and monetary policies, strengthened the competitiveness of the goods sector. On the other hand, the same institutional framework stimulated the search for non-price competitiveness strategies, especially in the services sector, which made wage growth compatible with increasing sales abroad. On this basis, strong international demand in the early 2000s boosted the country’s trade surplus until the 2008 crisis.
The article is structured into four sections followed by some concluding remarks. First, we review the main contributions on financialized growth models and on the taxonomy of the Swedish growth model. Second, we explore the elements that make Sweden fit the description of “debt&export-led” growth between 2000 and 2008. Subsequently, we analyze the macroeconomic factors behind that combination of the two principal drivers of growth in financialized models: domestic private demand and exports. Next, we delve deeper into the socio-economic and institutional factors that explain Sweden’s particular macroeconomic performance during the period under study. Finally, some conclusions are drawn.
Growth models and financialization
The crisis of the 1970s revived a historical debate in international political economy around the effects on economic growth caused by changes in wage levels. From a classical/Marxist approach, it was noted that wage increases negatively affect the profit margin, which could lead to a fall in the level of capital accumulation. From a more Keynesian like perspective, other authors claimed that wages are not merely another operating cost for firms but are the main source of aggregate demand; therefore, a rising wage would increase investment through positive effects on sales and firms’ capacity utilization.
Inspired by this controversy, Bhaduri and Marglin (1990) proposed a model in which demand-side growth regimes can be divided into two types. On the one hand, in a wage-led economy, the positive effects of wage-share increases on aggregate consumption and investment outweigh the negative effects of a fall in the profitability and international competitiveness of an economy. On the other hand, in profit-led economies, the negative effects of a wage-share increase on aggregate investment and the trade balance are larger than the positive effects on consumption.
Starting from the study of the impact of income distribution on aggregate demand, the changes in national and international economies resulting from the so-called neo-liberal policies implemented since the early 1980s have been widely studied. Apart from changes in factor distribution, such reforms have triggered a process of financialization with profound structural transformations (Boyer, 2000; Epstein, 2005; Hein, 2011; Stockhammer, 2008). In this vein, but from an essentially macroeconomic perspective, another line of research has focused on identifying structural changes that have led to the development of growth patterns typical of finance-dominated capitalism (Hein, 2012, 2015; Stockhammer, 2009; Van Treeck, 2009). Two of these changes are the growing role of (mainly private) debt as a driver of consumption and, more generally, aggregate demand, and the high mobility of capital, allowing a temporary widening of trade imbalances between countries.
In the context of the financial expansion of the late 1990s and especially the first decade of the 21st century, these changes were at the root of the development of (at least) two opposing growth models. In one group of countries—among them the United States, the United Kingdom, Spain, and Ireland—debt drove private demand. In another group, Germany, Austria, and Japan presented clear cases of countries that benefited from rising world demand to grow on the basis of net exports. Cognizant of the heterogeneity of terms found in the related literature, we have opted to refer to the growth models of the first group as “debt-led” and those of the second group as “export-led.”
Domestic demand drives growth in the first group; external demand fuels the economies of the second group. In that sense, they are two opposing models. But they are also complementary—countries with debt-led growth-model feed demand for the output of exporting countries. At the same time, the latter group invests in the former (Hein and Dodig, 2012; Stockhammer, 2009). That complementarity, in the framework of financial expansion prior to 2008, led to the progressive consolidation of what were termed Global (and Regional) Current Account Imbalances, with an accumulation of growing deficits and surpluses for the first and second groups, respectively.
Beyond observation of such imbalances, there is no consensus on how to classify countries on the basis of clear variables (Barredo et al., 2023). Regarding the financial dimension, for example, in Stockhammer (2009, 2011) and Lapavitsas et al. (2010), the analysis focuses more on gross debt, while in Hein’s “national income and financial accounting decomposition” approach (e.g., Hein, 2011, 2012, 2023; Hein et al., 2015) the focus is more on the net financial positions of sectors as well as on the dynamism of aggregate demand components.
The classification of financialized growth models presented by this author provides a comprehensive framework for understanding cross-country patterns in sectoral financial balances and aggregate demand dynamics. The analysis identifies up to four growth “regimes,” including extreme cases such as “debt-led consumption boom” and “export-led mercantilist” regimes. In debt-led countries, the private sector, particularly households, experienced negative or near-zero balances, while the external sector recorded positive balances due to deteriorating current accounts. Conversely, mercantilist countries exhibited growing net exports but negative external sector balances, with the household sector maintaining positive balances and contributing weakly to economic growth overall (Hein, 2023; Hein et al., 2021).
More than ten years after the outbreak of the Great Recession, a substantial literature still seeks to describe the specific “growth drivers” of each model (Barredo et al., 2023). For the case of the Eurozone, for example, Flassbeck and Lapavitsas (2013) and Bibow (2013), among others, point to wage-control policies as key aspects that allowed countries at the center of the monetary union to accumulate gains in price competitiveness in the first decade of the 21st century—mainly vis-à-vis the Eurozone periphery (Spain, Greece, Italy, and Portugal)—and to ultimately improve their trade balances. For other authors (for instance, Simonazzi et al., 2013; Storm and Naastepad, 2016), the evolution of non-price-competitiveness was likewise significant. As regards the debt-led model, oft-cited drivers of the credit boom include financial deregulation (Guttman, 2008), the positive link between declining relative income levels and leverage (Behringer and Van Treeck, 2022; Van Treeck, 2014), and the wealth effect of asset-price inflation (Fernandez and Aalbers, 2016; Kohler and Stockhammer, 2022).
Beyond the essential features that allow, in each proposal, the classification of countries into separate groups with their own growth models, the literature on the subject also identifies a certain degree of heterogeneity between the countries within each growth model. Thus, for example, Hein (2011, p. 61) notes that in Ireland, which is normally included in the debt-led group, the negative sign of the current account balance recorded from the early 2000s until 2008 was not due to a negative balance of goods and services (as in the other debt-led countries) but rather to the outflow of primary income. Another interesting peculiarity lies in the evolution of the corporate sector balance. For developed countries, in general, its position had been improving since the early 2000s (Villani, 2021) without major differences between the two growth model groups (Hein, 2011, pp. 59-61). Spain, however, stood out from other debt economies due to the negative and growing financial performance of its corporate sector (Koo, 2013) during the financial expansion; together with the household sector, this boosted the country’s external deficit.
Differences are also striking in terms of the factors that drove the debt dynamics in different countries. As Reis (2013) shows, Portugal—sometimes considered a debt-led economy during the pre-crisis period (e.g., Akcay et al., 2022; Stockhammer, 2011)—saw real estate price increases far below those recorded in Ireland or Spain. On the other hand, within the export-led group, Hein (2012, p.130) notes that Belgium, the Netherlands, and Sweden registered certain features typical of the debt-led group, such as increases in wealth-to-income ratios or in residential property prices. In this sense, but based on the observation of gross debt levels, Barredo-Zuriarrain (2019) introduced the possibility of a country experiencing export-led and debt-led models simultaneously.
In recent decades, the case of Sweden has been repeatedly analyzed in the literature as representing a particular growth model. The country has undergone profound changes since at least the 1970s, and no consensus has formed around what made Sweden’s growth distinct. One argument frequently advanced in debates is that unlike other nations, Sweden proved able to adapt its competitive domestic industry, even as private consumption increased and a generous welfare state developed (see Bergh, 2014; Steinmo, 2010).
Baccaro and Pontusson, (2016: 17-18) indicate that, unlike Germany, Sweden has been able since 1994 to combine a boom in domestic consumption with growing surpluses in its trade balance, thanks to the lower price-sensitivity of its exports (see also Baccaro and Benassi, 2017). This has been countered by Hein et al. (2021:3-5) and by Hope and Soskice (2016), who locate the country closer to Germany’s “simple” export-led model (see also Stenfors, 2016). Elsewhere, Buendía and Rey-Araujo (2021) offers the qualification that Sweden’s export-led aspect has become more acute since the 1990s, to the detriment of domestic demand; this is attributed to institutional changes affecting the post-Fordist symbiosis between the welfare state and capital accumulation (see also Buendia et al., 2022). Belfrage and Kallifatides (2018) warn that, within the framework of a finance-dominated accumulation regime, Sweden has moved toward a debt-led model, especially since the 2008 crisis. Erixon and Pontusson (2022) nuance this Swedish “financialization” identified by Belfrage and Kallifatides (2018: 876-877); however, they also highlight the rise of debt in what they call a shift from the “export-led balanced growth model” of 1994–2007 toward the “consumption-led balanced growth model” of the 2010s.
Following the literature on financialized growth models, we have limited ourselves to examination of the early years of the 21st century—the period of greatest global financial expansion across recent decades. As to the reasons behind the singular “debt&export-led” experience of Sweden during this period, we argue for a combination of historic factors directly related to the country’s economic structure. Concurrent with the macroeconomic dimension and national industrial policy, these factors have affected the specific form taken by financialization in Sweden.
General patterns and “rare” countries with a “debt&export-led” growth model
In general terms, three reasons can explain the worsening of a country’s trade balance to the extent that recourse to credit increases the country’s demand above that of other partners. First, part of the new demand is oriented to the purchase of foreign goods and services. Second, increases in aggregate demand levels are usually associated with prices and wage inflation; therefore, credit-driven demand can lead to a gradual loss of price competitiveness. A third reason, perhaps less intuitive, has to do with the speculative bubbles that sometimes drive a country’s growing indebtedness; the orientation of speculative investments toward financial assets or non-tradable goods can divert funds away from the development or maintenance of non-price-competitive industries, and this can ultimately affect the exporting complexity of countries in negative ways.
Figure 1 depicts, for 30 countries, the relationship between the evolution of gross debt levels and trade balance performance. It shows the evolution in both variables during the expansionary phase from the early 2000s until the 2008 crisis (2000q1–2008q4).
1
Because the private non-financial sector (PNFS) was the main driver of new debt and aggregate demand for the entire period for most financialized economies, the variable in the horizontal axis excludes credit to financial institutions as well as to the public sector. We take as our variable of analysis the total increase in the ratio “Credit to the Private Non-Financial Sector over the Gross Domestic Product” (or CPNFS-GDP). We consider credit relative to GDP to be a limited but adequate proxy to measure the indebtedness dynamics of the different sectors of a country. The vertical axis captures the change in the trade balance. Instead of taking data from the initial and final quarters, and in order to avoid distortions derived from the volatility of the trade balance, we take the average of the last four quarters of both the initial and final periods. By including in the sample national economies representing around 70% of world GDP and with strong trade links, it can be said that there is a certain interrelation between the surpluses of some and the deficits of others. Changes in the ratio of Credit to Non-Financial Private Agents over GDP (horizontal axis), and in the trade balance (% of GDP) (vertical axis), 2000–2008. Source: Own elaboration from Bank of International Settlements (BIS) and OECD online data. See values for each country in Annex 1. y = −0,0382x + 1,0738, R2 = 0,2574.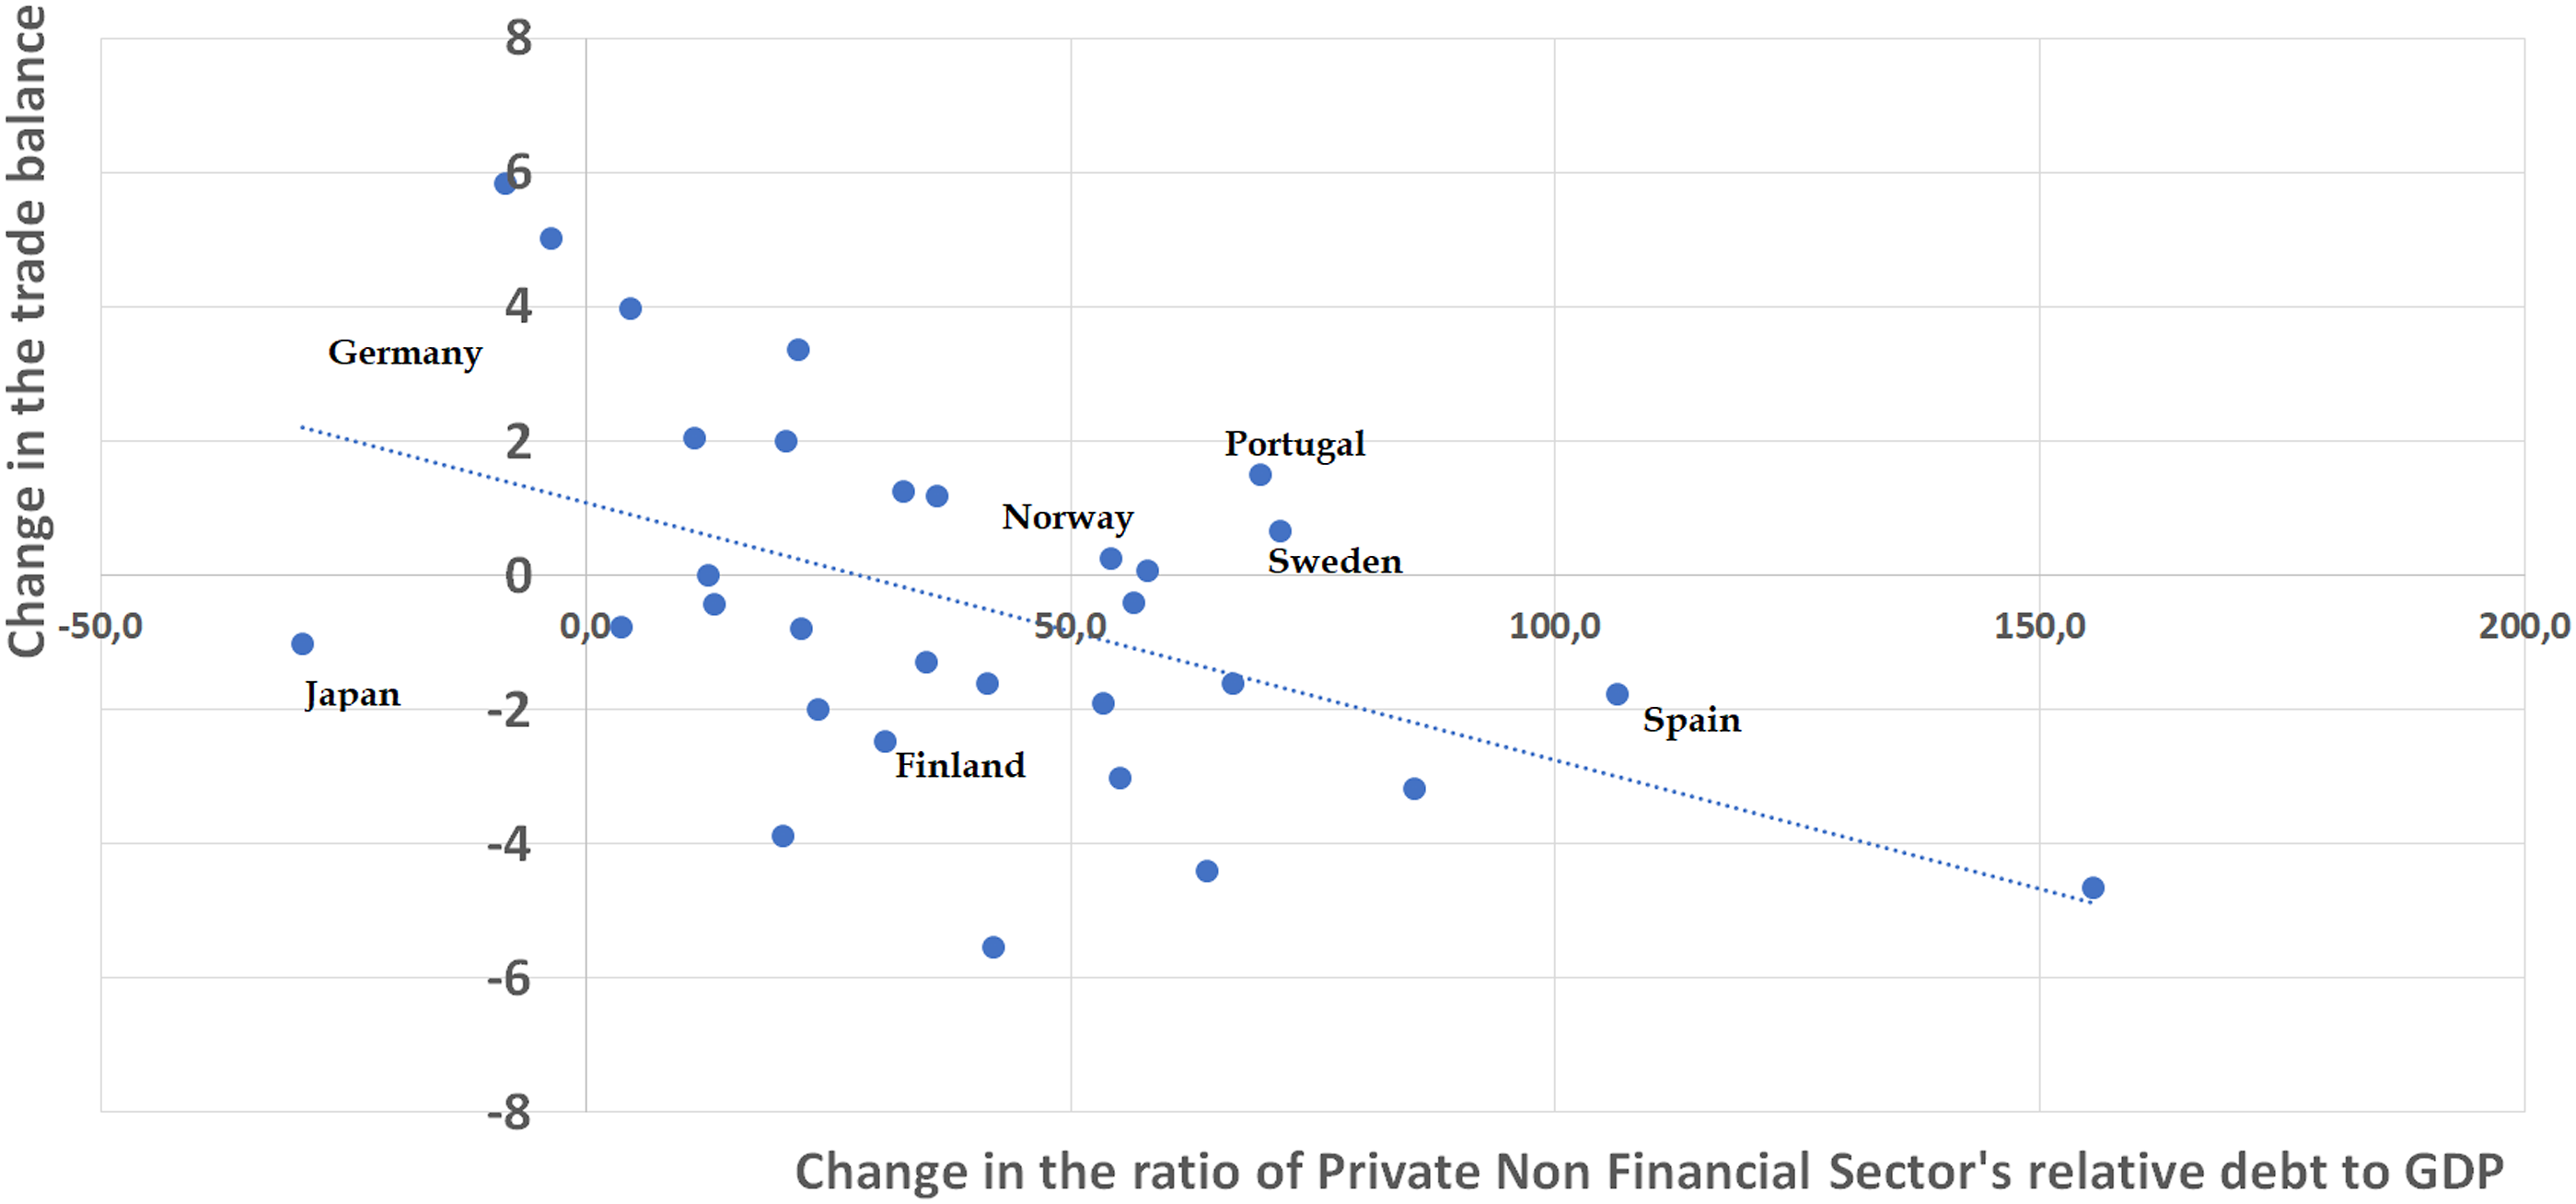
The results confirm the expected trend: countries with higher relative credit growth tended to suffer greater deterioration in their trade balances. 2 For this specific case, we find Spain (with an increase of 106.4 points in credit relative to GDP, and a deterioration of 1.77 points in the trade balance from 2000q1 to 2008q4) along with Ireland as countries with a strong increase in debt (+155.5 for Ireland) and a sharp deterioration in the trade balance (−4.6). However, in the case of Ireland, the effect of particularly advantageous fiscal conditions on both variables compels us to be cautious in interpreting the data from that country. The United States also exhibits this trend (+35 and −1.29 points), but with levels of indebtedness far below those previously discussed. At the other extreme, we see countries with a modest or negative evolution of credit, like Germany (−8.3 and +5.84) and Switzerland (−3.5 and +5). Between these extremes, several countries demonstrate intermediate developments in both variables, including the Czech Republic (+4.7 and +3.97), Poland (+32.7 and +1.25), and France (+30.9 and −2.47).
Nevertheless, we note that beyond the negative trend observed for these countries, there is no automatic relationship between the magnitude of the increase in debt and the deterioration of the trade balance. From a macroeconomic point of view, three reasons can be attributed. First, the balances of the public and financial sectors are not being taken into account (see Behringer and Van Treeck, 2019, p. 311-2; 2022). Second, the gross and net debt positions must be distinguished; for instance, a sector can become highly leveraged, but at the same time increase its financial assets. Third, although the debt of domestic sectors may imply a deterioration of the national external position, this may not be in the balance of goods and services but in other items of the current account.
As we are interested in finding countries that meet the main characteristics of both the debt-led and export-led growth models, we apply respective filters to each of these three terms: one referring to financial leverage, another to the trade balance, and another to the level of economic growth. Regarding the first, as we are dealing with a period of generalized expansion and indebtedness, we only take countries with relatively higher leverage than others. As the United States can serve as a paradigmatic debt-led case according to multiple papers, we take its 35.1 point increase in CPNFS-GDP as a minimum threshold. According to the data collected in Table A1, the countries in the aforementioned situation are Australia, Belgium, Denmark, Finland, Greece, Hungary, Ireland, Italy, New Zealand, Norway, Portugal, Spain, Sweden, and the United Kingdom.
In relation to the trade balance, this must not only be positive but also contribute to growth. This implies that the balance must also be growing in the period under study. Additionally, it is convenient to add another criterion that makes the selection more restrictive. Although we have taken annual averages in the calculation of the trade balance for each four-month period, in order to avoid traps derived from the statistical selection of the initial and final periods, we discard those countries with an irregular evolution of the trade balance.
From the list of countries that passed the first filter, most are discarded, as their trade balances worsened in that period (negative values on the vertical axis of Figure 1). Portugal is excluded because, although its trade balance improved, it generally remained in deficit. Australia likewise cannot be selected because, although it ended 2008 with an improved balance and surplus, this was an exceptional surplus peak at the end of the study period. The only countries remaining after application of all the filters on debt and trade balance are Sweden and Norway.
Country selection may be data-driven; the period selected affects the classification. Regarding the selection of 2008 as the final period, there does seem to be consensus that this marked the end of the expansionary phase. On the other hand, the start date varies depending on whether the economic or financial dimension is taken as the main determinant; we find in the literature works that select 2001 (such as Kohler and Stockhammer, 2022) or even 2002 (Barredo, 2019). Our choice of the year 2000—observed in other research papers (e.g., Hein et al., 2021)—is consistent with Borio’s (2014) observation about the length of financial phases. More importantly, when the first year is altered, although changes are observed in the list of countries that meet one or another criterion, all remain far from meeting all of them. Sweden and Norway are the only countries that respect the aforementioned criteria in all cases.
Average Annual Contribution to Real Growth (2000–2008).
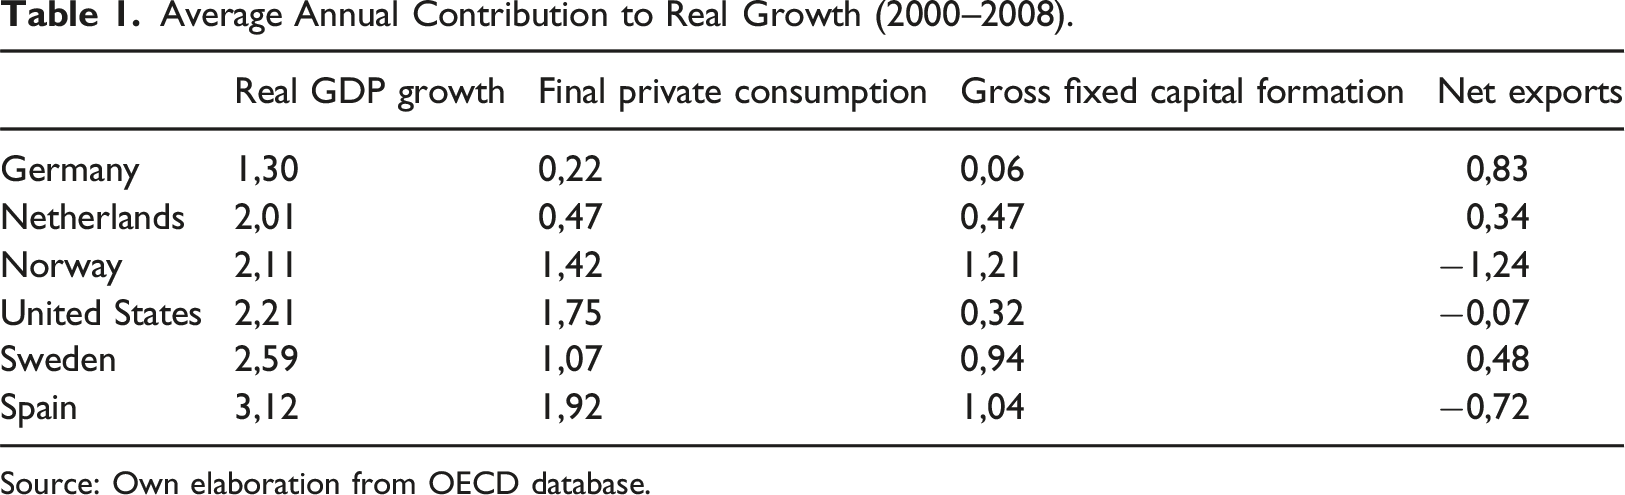
Source: Own elaboration from OECD database.
Norway, meanwhile, was among the countries with an increasing trade surplus. Nevertheless, in real terms, this country experienced a negative contribution of its external balance to total growth during the same 2000–2008 period. Although we do not elaborate on this point, the difference between the nominal (favorable) and real (declining) evolution of its trade balance may have been due to the increase in the price of oil during the period under study. In any case, once the “real” growth filter has been added, we discard Norway and concentrate on Sweden.
A macroeconomic approach to understanding Sweden’s “debt&export-led” growth
The level of net exports in Sweden increased strongly throughout most of the period under study. Strong foreign demand in the context of the global financial expansion allowed exports to continuously outperform imports, despite the fact that Sweden experienced one of the largest debt increases in the world at the same time.
The previous section began with three general assumptions about the negative impacts of debt levels on the trade balance: rampant indebtedness can boost spending on imports for both households and firms, inflate prices, and divert investment away from tradable non-price-competitive sectors. In order to understand the above-mentioned particularity of Sweden’s trade balance until the 2008 crisis, we must ask how the country fared in those three respects. We begin by assessing the extent to which, in aggregate terms, new debt of non-financial private agents translated into booms in aggregate demand. For this purpose, it is useful to contrast the financial status of the various sectors, with special attention to the non-financial private sectors.
As seen in Figure 2, aggregate demand levels of households and non-financial corporations did not generally soar above disposable income. In the case of households, although consumption and investment did jointly exceed income in specific years, they tended to record fairly balanced or even positive net lending positions, with an average of 3.5% of the GDP for the 2000–2008 period. On the other hand, non-financial corporations (NFCs) maintained investment levels clearly below their disposable income, which largely explains their positive—although irregular—average lending balance for the years under study. If we add the net lending surplus of government (above 1% of GDP) and financial institutions (around 2%) observed for the whole period, the result is an increasing creditor position of the Swedish economy vis-à-vis the rest of the world, driven mainly by the increasing surplus balance of goods and services. Financial positions and use of revenue by households (left) and non-financial corporations (right) in Sweden (1995–2020). Source: Own elaboration from OECD database (absolute values in millions, SEK).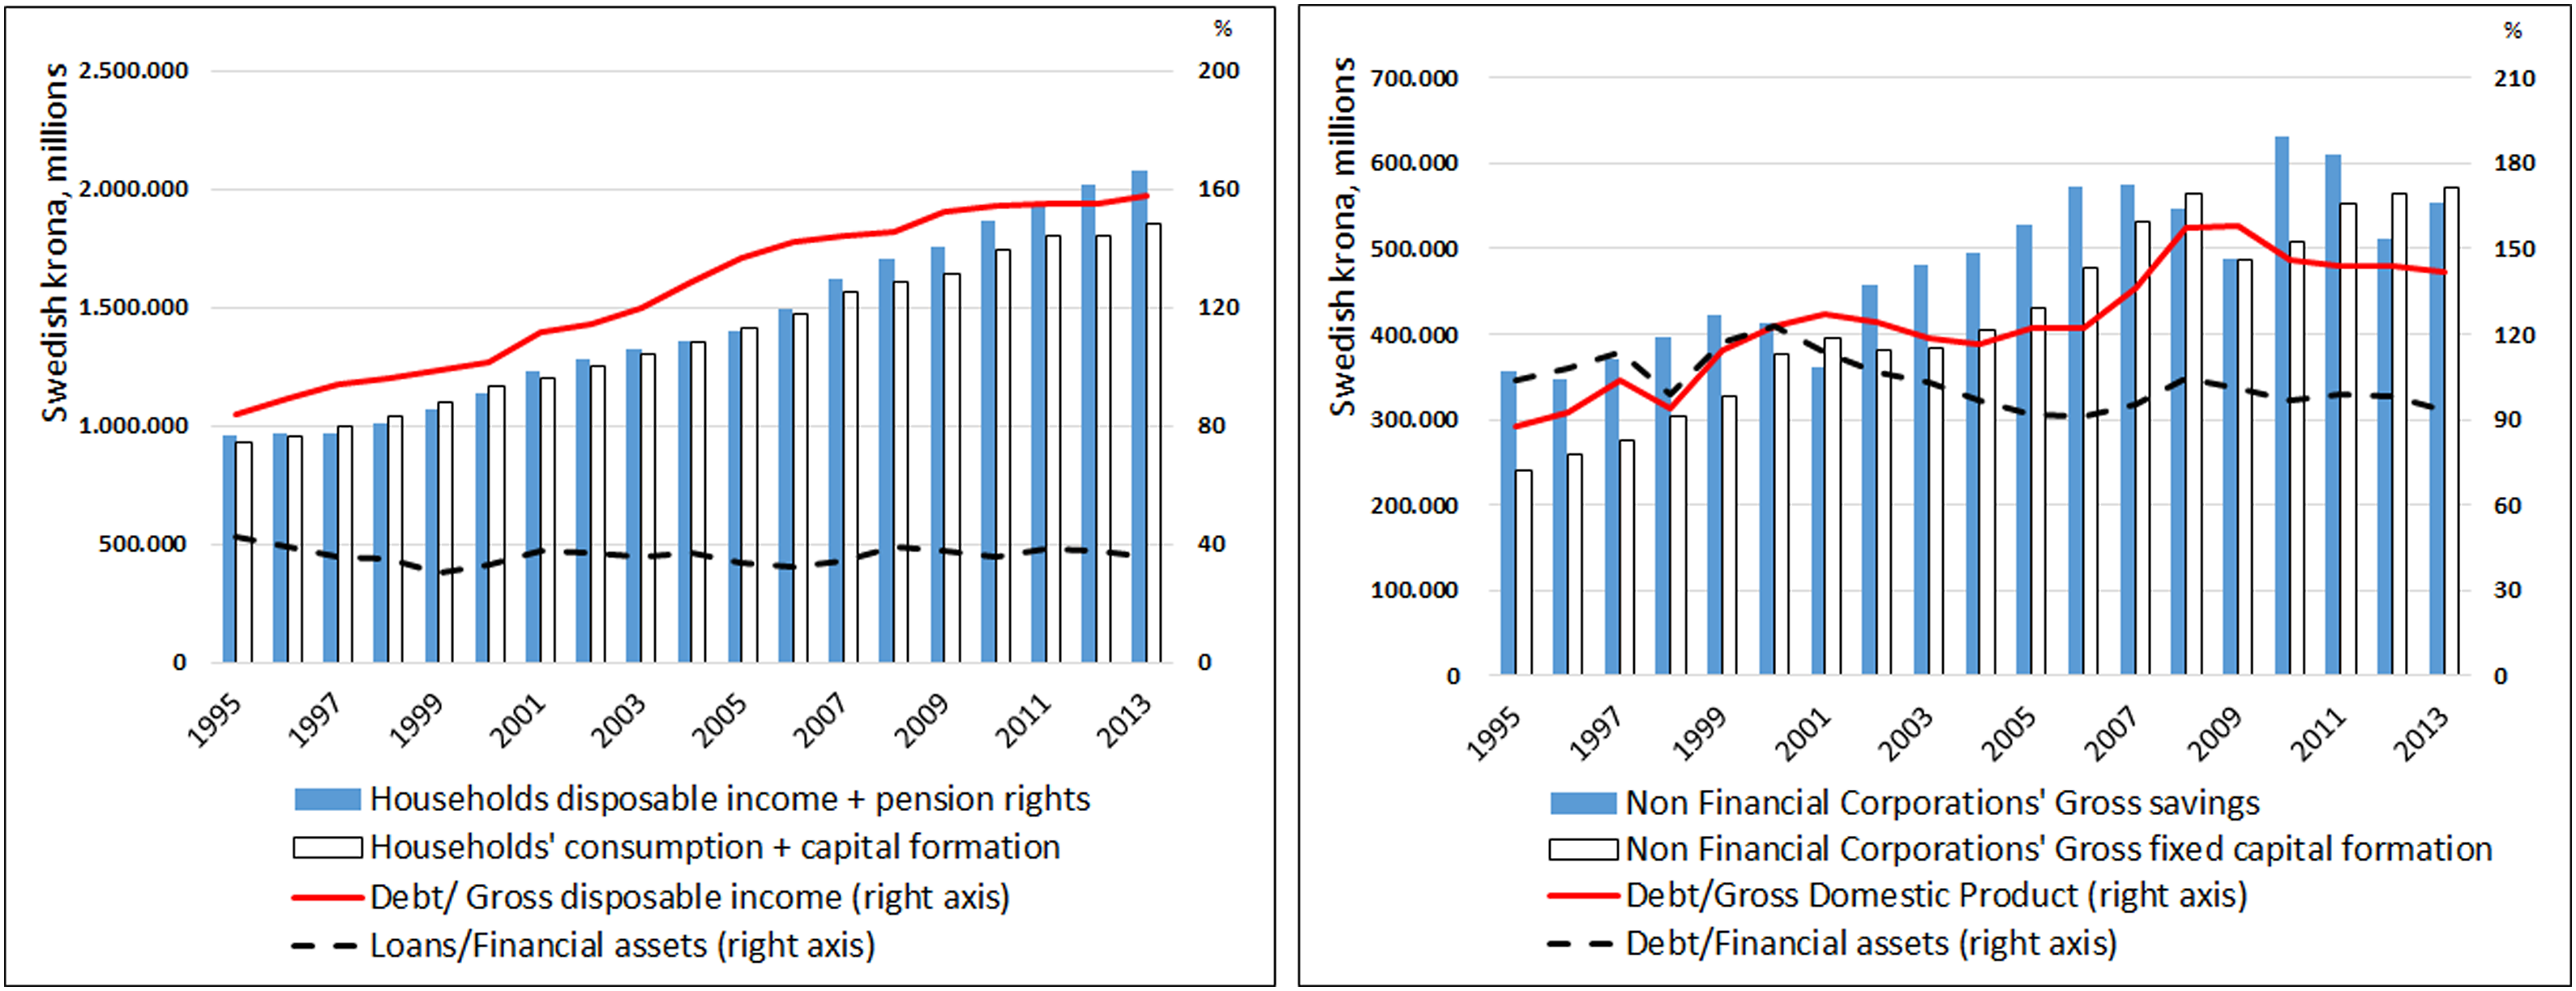
This performance explains much of the improvement in the net international investment position (IIP) in that period. During the previous two decades or longer, the country’s investment position had suffered progressive deterioration. From the 1990s, with the removal of currency controls, there had been a massive inflow of foreign capital into companies (Skyrman et al., 2022: 8-9), with a prominent role for portfolio investments in equity as well as in debt instruments. From the low point of almost 800 SEK billion of net liabilities in 2000, the net position started to recover, with a relative stagnation of liabilities, but especially with the boost of foreign assets from 2002–2003, eventually reaching (temporarily) positive values in 2007.
The buoyancy of the export sector (in addition to positive private sector balances) makes Sweden an example of an export-led growth model during the pre-crisis financial expansion (Dodig et al., 2016; Hein, 2011; Hein et al., 2021; Hope and Soskice, 2016). Indeed, the initial years of the 21st century are often integrated into a mercantilist phase already visible in the 1990s or even earlier (Belfrage and Kalifatides, 2018; Buendía et al., 2022; Erixon and Pontusson, 2022; Hein et al., 2017).
That said, unlike other export-led countries such as Germany or Japan, Sweden experienced in the same period of the 2000s a remarkable increase in private debt, especially by households (Hein et al., 2017: 259). Indeed, Figure 2 shows increasing debt ratios relative to generated wealth for households and NFCs. Concretely, total household debt increased from 41.81% of GDP in 2000 to 62.6% (in terms of disposable income, from 96.07% in 2000 to 132.47% in 2008), then went further to 86.36% in 2021 (data from Statistics Sweden).
Debt and (physical or financial) investment distribution across sectors is inherently unequal, influenced by various factors. At the aggregate level, the accumulation of financial assets by some households may counterbalance the indebtedness of others, maintaining overall balanced or even positive sectorial financial net position.
In the context of Swedish households, Roth (2023) identifies variables such as age, gender, residency, and income inequality as factors shaping individual debt levels. Meanwhile, and in relation to the asset side, Bach et al. (2020) demonstrate that between 1999 and 2007, wealthier households in Sweden favored financial assets and commercial real estate investments, contrasting with poorer households who predominantly invested in residential property alongside cash holdings.
Lundberg and Walderstrom (2018) observe divergent wealth trends among Swedish households from 2000 to 2012, wherein the net wealth of the wealthiest increased while that of the poorest declined, a pattern also observed for the period 2000–2008. Detailed analysis by these authors reveals that the wealthiest deciles maintained low leverage and pursued riskier financial investments. On the contrary, the poorest 50% increased net debt while investing in fixed assets, mainly real estate. Consequently, a significant proportion of the population faced alarming debt levels, with 25% of mortgaged households owing over 400% of disposable income by 2015 (Belfrage and Kalifatides, 2018), a noteworthy figure internationally.
Debt dynamics fueled consumption and investment among lower-income households, while wealth accumulation among the affluent maintained sectoral stability pre-crisis. According to Statistics Sweden, consumer credit in Sweden surged from 3.3% to 4.2% of GDP between 2000 and 2008, paralleling trends in Spain (from 7.4 to 9.4%) and the United States (stable around 9–10%). Housing-related credit expanded significantly, from 28% in 2001 to almost 50% in 2008, an increase slightly slower than that of Spain (from 28% to 61%) and higher than that of the United States (from 43.1% to 62.5% between 2002 and 2008) (calculations from Banco de España and Quarterly Report on Household Debt and Credit, Federal Reserve, respectively).
This leverage cycle for consumption and investment benefited from the positive wealth effect stemming from financial and housing market appreciations. Turk (2015) highlights a reciprocal relationship between household debt and housing prices in Sweden from 1980 to 2015, where short-term leverage positively impacted housing prices, while housing prices drove long-term indebtedness trends.
The second reason mentioned to explain the negative relationship between indebtedness and the evolution of the external balance lies in the possible effect that this may have on the loss of price competitiveness, due either to the increase in domestic costs and prices or else to appreciation of the nominal exchange rate derived from a strong inflow of foreign capital.
For the purposes of the present study, we must bear in mind that the evolution of the external balance of any country in the 2000–2008 period—the financial upswing on which we focus—was affected not only by the difference in the real rate between the final and initial periods of the years studied, but in general by the path of the national real rate in prior years. In this respect, Figure 3 shows a relative stability of the real exchange rate for the period under study. However, during the previous decade, the Swedish economy had experienced a clear depreciation (see the long-term negative slope of its line) not only vis-à-vis most of its exporting and importing partners, but in relation to the world economy in general. As stated by Erixon (2015: 582-583), the comparison between 1992 and 2007 in the effective real exchange rate shows a decrease of 26%, explained by the depreciation of the SEK in 1993 and in the years that followed (i.e., when this became an important tool for putting the 1990–1992 crisis behind them). Evolution of the relative real exchange rate (in %) from 1990 for Sweden and its trading partners relative to the world average. Source: Own elaboration from World Development Indicators, World Bank.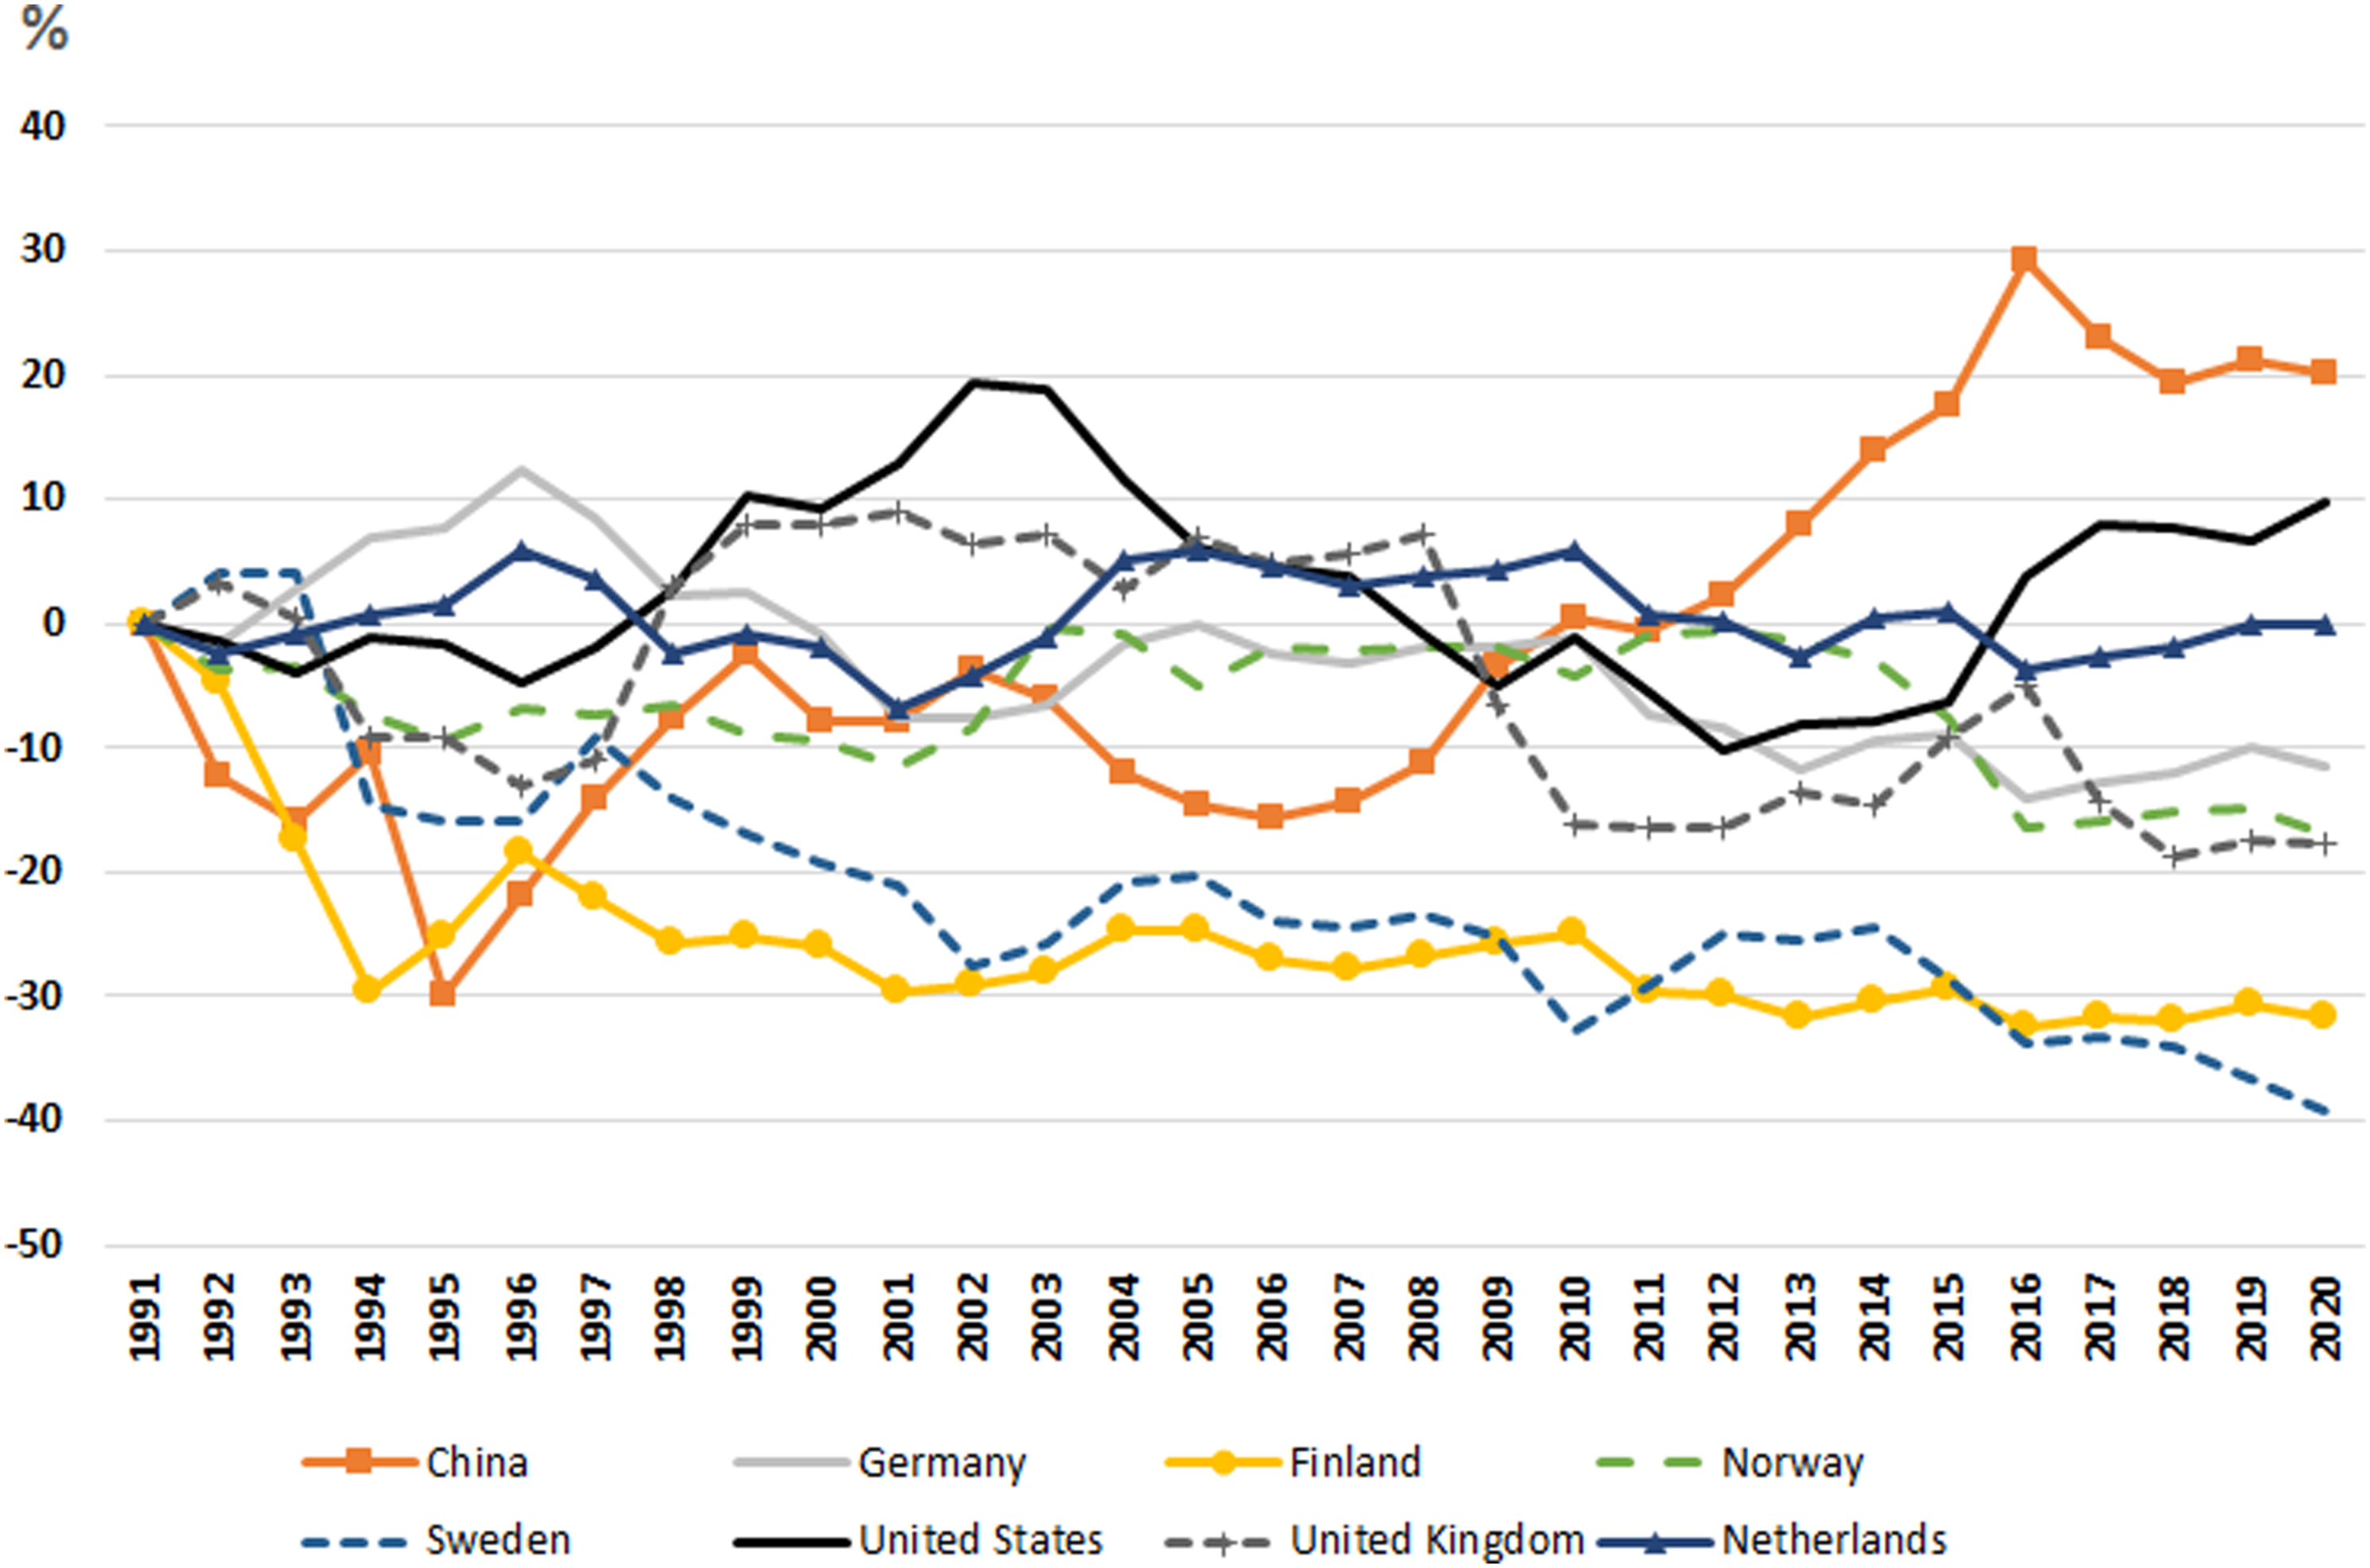
This evolution of the real exchange rate is one of the factors that explain the favorable evolution of Sweden’s external sector, where exports increased on average by 7.2% annually during the 1994–2008 period, causing us to reject the idea that indebtedness would have inflated prices, thereby jeopardizing the external balance.
Another factor is related to the fact that the export mix in Sweden did not change much in later decades. The export boom that allowed for strong recovery of the economy after 1993 was led both by goods and services. Concerning the former, essentially the same sectors that had held leading positions before, with electrical machinery rising to second position. Other new commodities that entered into the top 15 included fish, fish preparation, and petroleum, as well as medicinal and pharmaceutical products. Some of these (especially raw materials) are characterized by their low import intensity, which helped to maintain a lower increase of import levels (Erixon, 2015). Other traditional export commodities such as pulp and paper were no longer among the country’s main exports (Skyrman, 2022), as was also the case for textile yarn. It seems that the diversification of trading partners after the mid-1990s (with China prominently positioned among them) helped Sweden to sell some basic goods, even if those had lost importance in their export mix, as was the case for metalliferous ore.
When we turn our focus on services, relevant changes become evident. As stated by several authors (Baccaro and Pontusson, 2016; Erixon, 2011), explanation of the good performance of Sweden’s export sector requires the consideration of services, particularly those related to the Information and Communication Technologies (ICT) sector. Once considered both services and goods, ICT services have been the main sector in the export mix since at least the mid-1990s, and its share grew from 6.78% in 1995 to 16% in 2019 (reaching a maximum of 21.83% in 2016, according to the Atlas of Complexity Index). In addition, according to the OECD (2015), about 70% of services incorporated into exports are produced locally, which again speaks volumes about the competitiveness of Sweden in this area. Furthermore, the current account surplus moved from a surplus mainly centered on goods in the 1990s to a surplus on services from the 2000s (along with a rising contribution of foreign income, which reflects the higher returns on investment abroad by Swedish MNEs compared to foreign investment in Sweden), and ICT and engineering services were the main contributors to this surplus. This sector is also characterized by relatively low price elasticity, so that wages did not need to decline during the period to remain competitive.
A different approach to this same information is provided by the Economic Complexity Index (ECI). 3 Interestingly, the position of Sweden in the ECI world ranking indicates a (very) slight decrease; indeed, we might speak here of “stabilization in a high position.” It is only after 2011 (i.e., after our period of study) that Sweden dropped in its ECI ranking in a more notable way (but again, retaining the relatively high position of eighth in the world) (see also Tiemer, 2018).
That said, regardless of its position in the ranking, Sweden’s absolute ECI value followed a downward trend, particularly from 2004 (Figure 4). This would suggest a trend in which the Swedish export mix became less competitive in absolute terms, as measured through its complexity. In the overall period for which data is available (1995–2019), the country’s ECI score fell by 15%, making this the only indicator for which we can deduce a worsening of Sweden’s competitiveness in the 2000–2008 context of increasing indebtedness. Evolution of the ECI scores of Sweden and its trading partners. Source: Own elaboration from The Growth Lab at Harvard University. The Atlas of Economic Complexity: https://www.atlas.cid.harvard.edu.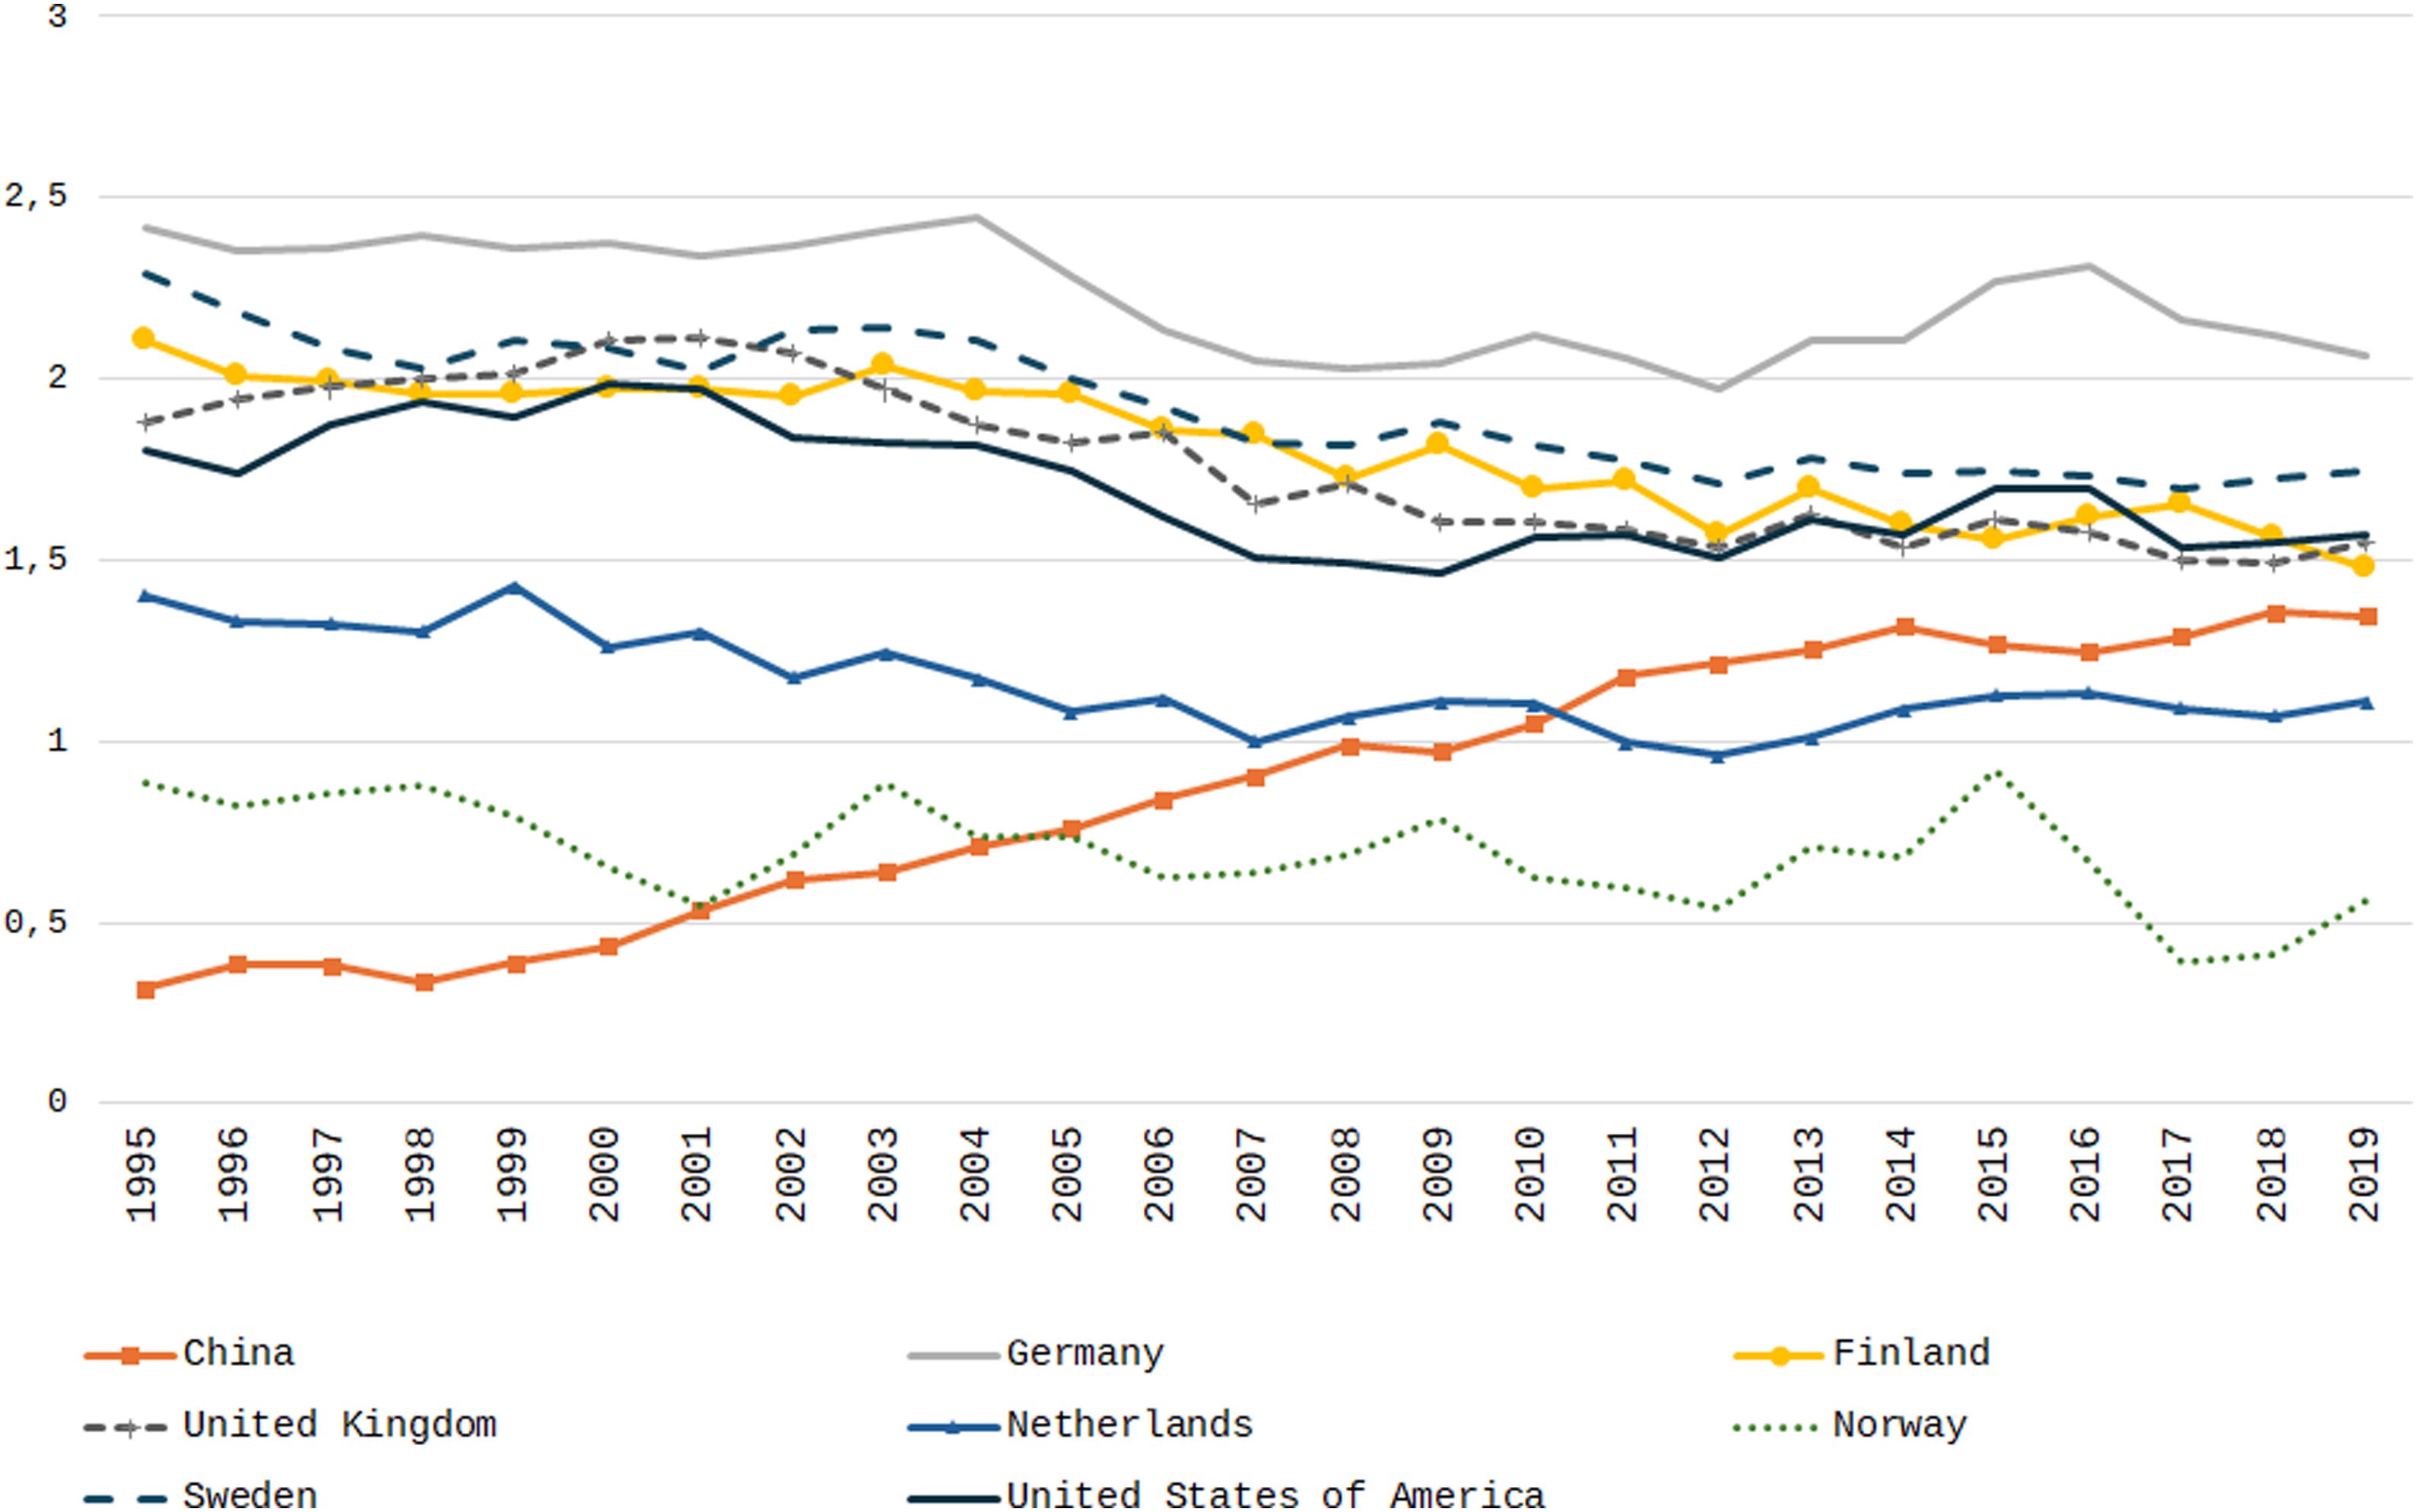
Despite this drop in the complexity of Sweden’s exports, national shares grew in the first decade of the 21st century in important sectors, including in services and, more significantly, vehicles (which had been notably bigger in the mid-1990s). Also interesting to note is that in most areas, a decline in shares can be observed following the Great Recession, while for the years under study better performance was registered precisely in service exports (see Figure A1).
In summary, four factors allow us to understand from a mainly macroeconomic point of view Sweden’s “debt&export-led” peculiarity during the financial expansion of the first decade of the 21st century—one factor being external and the other three internal.
Debt-fueled external demand seems to have been essential. This was complemented by three particularities of the country: an increase of both aggregate internal debt and the purchase of financial assets; favorable price competitiveness since the devaluation of the 1990s that boosted goods exports; and specialization in leading sectors (especially low price-elasticity services) despite a slight drop in the sophistication of exports as a whole.
It remains to be seen what institutional, regulatory, or industrial factors made it possible for Sweden, following a high rate of leverage, to have moved so clearly away from the pattern followed by countries with the same debt problem. That is the purpose of the fourth section.
Indebtedness and financialization in a robust economy: Institutional factors
Behind the “debt&export-led” growth model of Sweden’s economy during the global financial upswing preceding the Great Recession, certain key factors were related to progressive and structural change. The following elements will appear in our explanation: productivity, macroeconomic performance, income distribution, and the use of credit in a context of financialization.
Hourly earnings in the private sector grew on average at a significant annual rate of 3.1% from 1998 to 2007 (Erixon and Pontusson, 2022). Nevertheless, this was accompanied by significant productivity gains. According to OECD statistics on multifactor productivity gains, after stagnation in the late 1980s and early 1990s, Sweden began to outperform most member countries in the mid-1990s. In the 2002–2006 period, it recorded an average increase exceeded only by South Korea. This translated into two effects on the country’s external position—one quantitative, and the other more qualitative. First, wage increases did not translate into losses in price competitiveness. This explains the fact that the real exchange rate remained at similar or lower levels than those attained in the wake of devaluation of the national currency in the early 1990s, which had been followed by a sudden improvement in the trade balance.
We should bear in mind that this matching of wages to productivity increases seen since the late 1990s derives from events in the areas of wage-bargaining and the monetary regime. First, an agreement between unions and employers in 1997 to re-coordinate wage-setting made it possible to seek competitiveness in the tradable goods sectors (Anxo, 2017), even at the cost of a slight fall in the labor share (see Hein et al., 2017). Second, the rigid application of an inflation-targeting strategy by the Central Bank from the early 1990s played a disciplinary role by conveying to social agents the idea that monetary policy would not accommodate generous wage agreements via devaluations (Lindberg et al., 1997).
Qualitatively speaking, firms in the country were able to move toward a high value-added, non-price-sensitive export mix (thereby preserving wages)—including services as, for example, R&D and design in the upstream, or marketing and customer services in the downstream (OECD, 2015). Of particular importance was the ICT sector, where investments increased due to exports, a profit boom, and intra-sector competition (Erixon, 2015).
This upgrade in specialization cannot be understood without investment in intangible capital. In 2010, the only OECD country showing higher intangible investment as percentage of business output than Sweden was the United States. In the case of Sweden, this sort of investment has come close in quantitative terms to tangible investment and has focused on computerized information, innovative property, and economic competencies; as a result, the country’s patenting rates and management quality are considered among the highest in the OECD. Such investment has contributed to increased labor productivity, thanks also to the capacity of the country to reallocate resources (labor and tangible capital) to the most productive sectors of the economy—another trend in which Sweden has been among the most effective in the OECD (OECD, 2015).
Far from exclusively attributable to the free market, the dynamism of Sweden’s private sector is associated with a public regulatory framework that has evolved across recent decades. From the 1990s, the traditional policy oriented against SMEs was replaced by new measures, and changes in the tax system have aimed at stimulating such enterprises; SMEs active in ICT and the life sciences sectors have since become an engine for growth.
Public investments in basic and adult education have certainly contributed to this (Buendía and Rey-Araújo, 2021), but other changes have proven even more crucial. These changes constituted Sweden’s first interventionist industrial policy (ignoring a brief period in the 1970s); previously, apart from the corporation tax regime and the bank-based financial system, the country’s industrial policy was market-based and centered on indirect actions. Among new policies applied were financial aids to SMEs, administrative support, and measures to promote management skills, as well as the abolition of obstacles to creating and promoting start-up companies, particularly those imposed in the profit tax and financial systems (moving away from a bank-based stance and toward a market-oriented one). A new venture-capital market was developed to promote private equity following a deregulation process in the 1980s that channeled foreign capital to Swedish private equity and venture-capital markets, which further benefitted from the provision of public funds, counsel, and services. All this served to change corporate governance in Sweden, increasing the number of firms owned by foreign MNEs or controlled by private equity firms (Schnyder, 2012; Skyrman et al., 2022). Solid export performance at the industrial level, accompanied by public policy, occurred even as households and NFCs increased their rates of indebtedness.
Given these factors, debate has since arisen in the literature as to whether Sweden is a country whose accumulation regime has been financialized. Erixon and Pontusson (2022) consider that financialization has only partially affected the country, insofar as the financial sector maintains a relatively low level of participation in GDP and the investment strategy of non-financial companies continues to be guided primarily by operating surplus.
However, Andersson and Jonung (2015), Belfrage and Kallifatides (2018: 877), Christophers (2013: 890), and Stenfors (2016), state that the intense deregulation in the 1980s marked the starting point of a financialization process in Sweden, as evidenced in some of the indicators they select, including growth of the financial sector, the introduction of shareholder value as the main principle in corporate governance, the financialization of everyday life (making every Swedish citizen an investor), and the arrival of foreign venture capitalists, as mentioned above (in the same line, Skyrman et al., 2022). 4 Andersson and Jonung (2015) situate their argument in debt-to-GDP ratios as well as in ratios of debt to disposable income, which increased notably after deregulation in the 1980s (see also Jonung et al., 2009). Following Arcand et al. (2015), who empirically found that when credit to the private sector is greater than 100% of GDP, finance has a negative effect on economic growth; 5 Andersson and Jonung (2015) state that Sweden would have reached that level long ago. According to IMF data, private debt in Sweden increased between the 1990s and 2007 from 180% to 257% of GDP, with drastic acceleration since 2003/2004.
In this context, both private consumption and investment rose vigorously. That said, although smaller than consumption, investment has been more dynamic since the mid-1990s. In the case of households, for example, consumption declined from 22.5 times investment in 2000 to only 12.9 times in 2007.
However, the increase in investment was mainly due to real estate investment, which is to be expected given the exceptional increase in housing loans seen in the previous section. In the period 2000–2008, total capital formation went from 17.6% to 19.6% of GDP; nevertheless, private investment (excluding real estate) stayed relatively stable, with a decrease from 13.3% to 11.9% between 2000 and 2005 followed by a recovery to 13% in 2008. Private real estate investment, on the other hand, rose from 1.7% to 3.1% of GDP. The remainder of the total increase was due to public investment (data from Konjunkturinstitutet, taken from Statistics Sweden). The reason behind this trend was that real estate prices were outperforming the average evolution of consumer prices and consolidating a circle between credit and the speculative real estate bubble. As Andersson and Jonung (2015) put it, such a circle was established between credit, the bubble, and new credit required for increasingly expensive housing investments. This increase in housing prices continued in the 2010s; but it had already led during the 2002–2008 period to an increase in the ratio of real assets over disposable income for households, from 200% to 300%.
In parallel to aggregate demand, the stock market also grew vigorously (Figure 5), and certain changes in the Swedish welfare state contributed to this. After financial deregulation, the ratio of financial assets to disposable income went from 1.0 to 2.5, while the share of low-risk assets (cash and bank deposits) to total financial assets declined from two-thirds of disposable income to just one-third as a result of the increase of other assets (Stenfors, 2016: 197). Along the same lines, a look at the disaggregated financial assets of the non-financial corporations in the country
6
shows that between the beginning of the 21st century and the advent of the Great Recession, shares and other equity climbed from 22% of total to almost 50%. Evolution of general and asset prices, 1981–2021 (1981=100). Source: Own elaboration from OECD.data.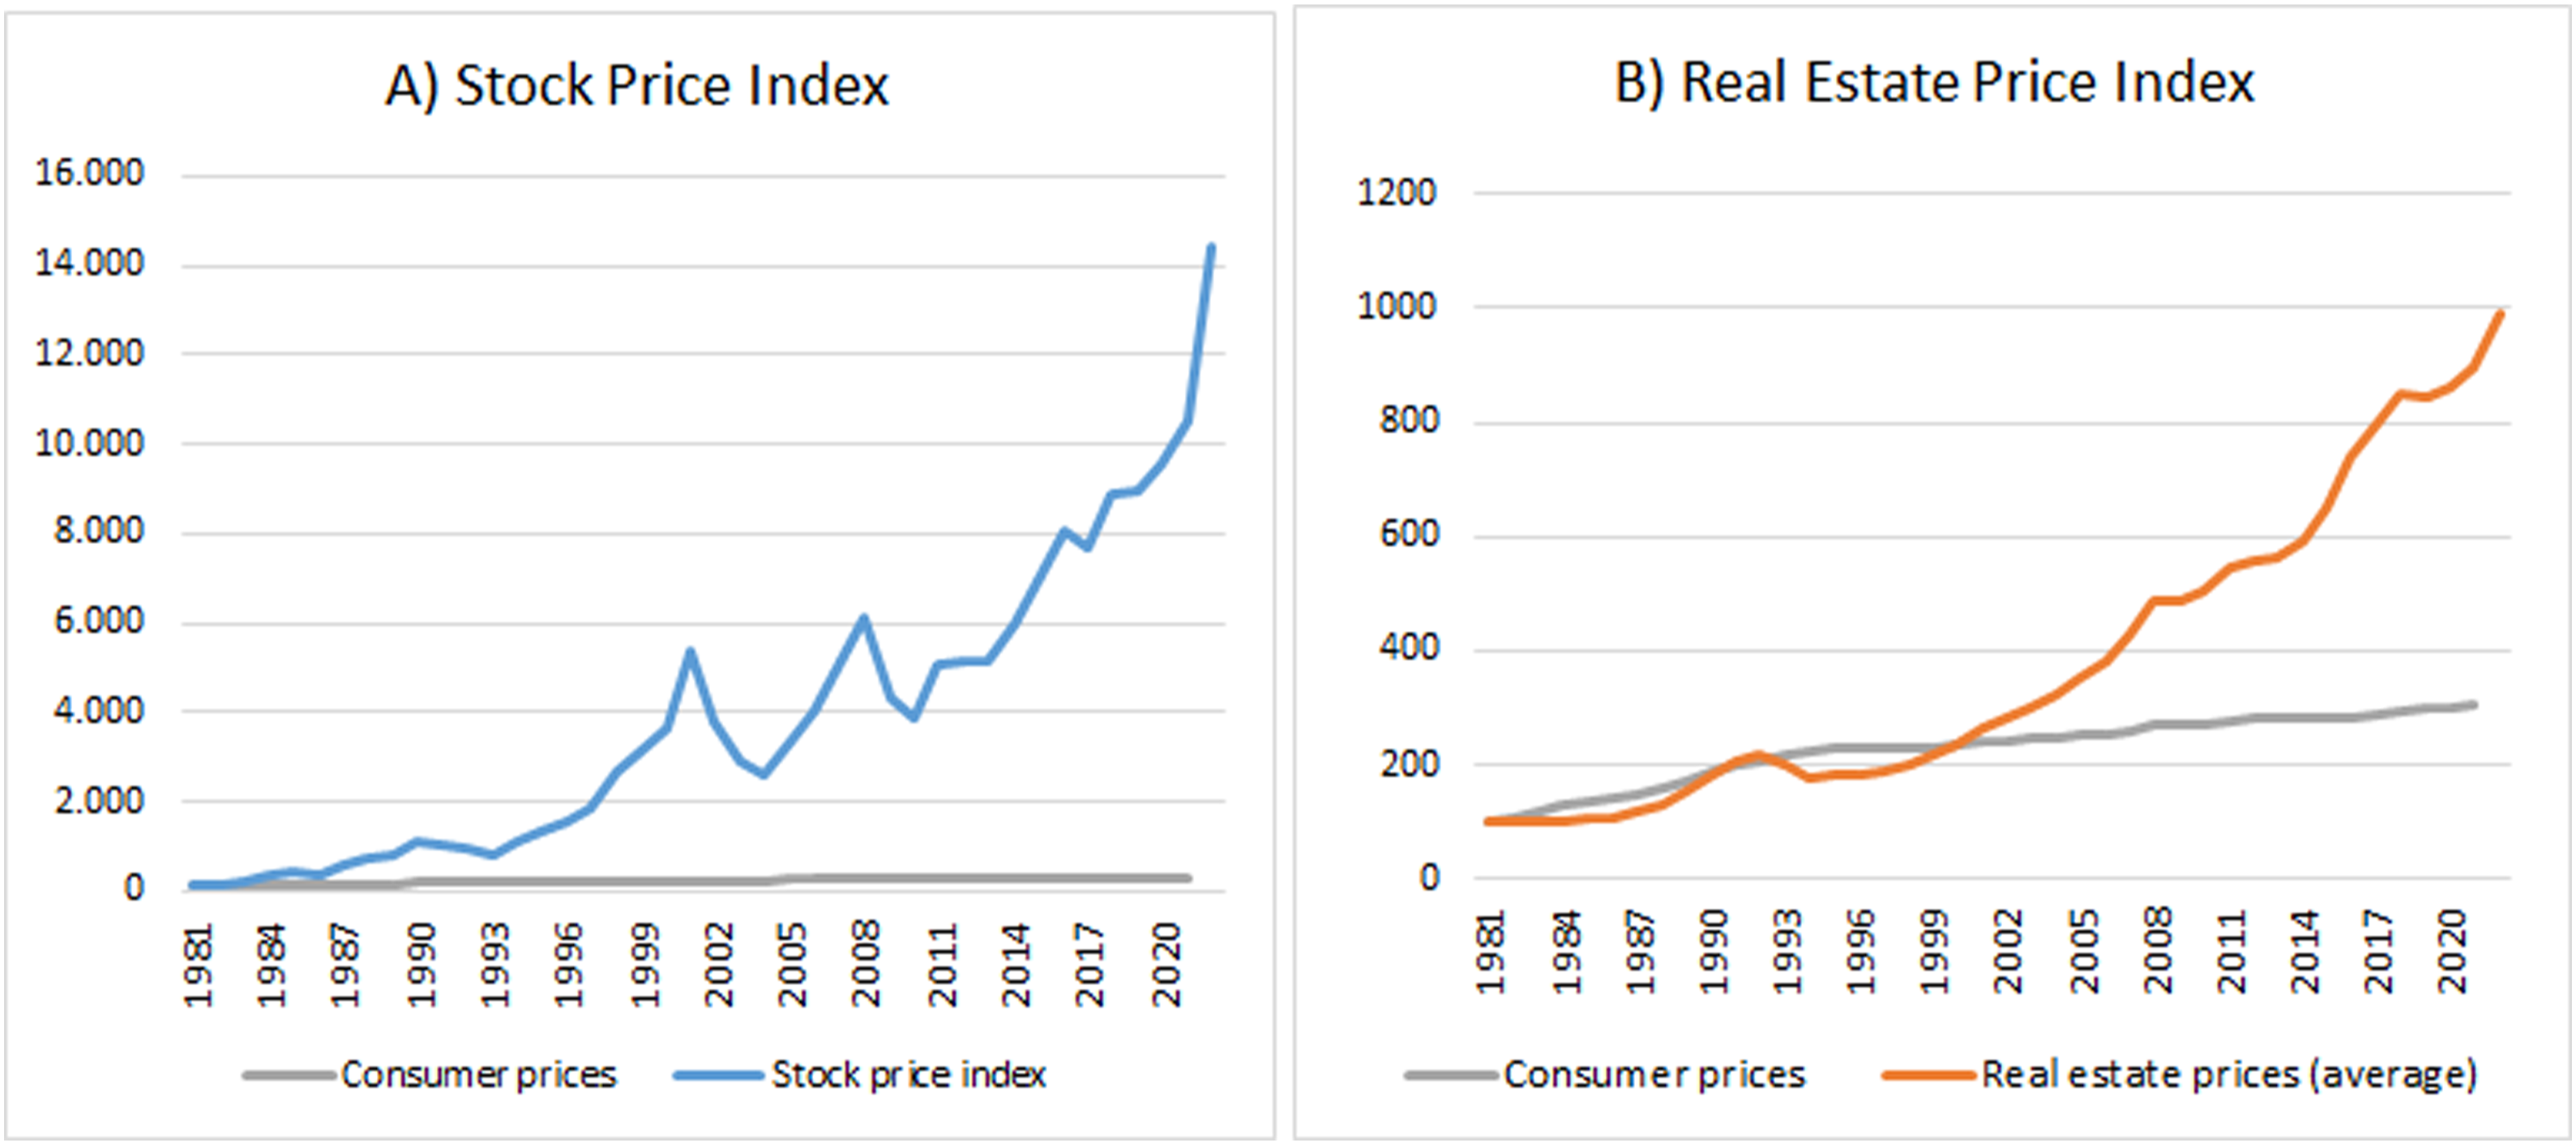
The pension reform of 1994 was a key step in proliferation of the culture that made each citizen a potential investor (Kinderman, 2017): on the one hand, the defined-benefit system was transformed into one of defined-contribution; on the other hand, a small component of compulsory capitalization was introduced into the public pension (Belfrage and Ryner, 2009). As a consequence, it comes as no surprise that Sweden has joined the club of countries featuring high coverage of privately funded pensions (Hort et al., 2016).
To this we must add that Sweden’s welfare state reforms began as part of the austerity measures introduced in the 1990s to reduce public debt. Apart from the cutting of some income benefits in the system (Gordon, 2019), reductions in the coverage of housing subsidies and public housing pushed many to the private sector, where increasing prices have increased household debt related to housing. These changes, along with the aforementioned evolution of the labor share, pushed forward the trend of increasing inequality that had started in the 1980s, where the declining redistributive capacity of the state was a crucial aspect: the Gini coefficient of disposable income rose from 0.226 in 1991 to 0.291 in 2008; whereas the public sector reduced 50% of the Gini coefficient of the income factor in that first year, it reduced only 39.7% in the final year (data from Statistics Sweden; see the same trends with different data in Hein et al., 2017).
Conclusions
The focus of the literature on Sweden’s growth through recent times is not accidental: for decades until the 2000s it managed to combine rising wage levels with rising levels of net exports. In recent years, signs have emerged of a certain deterioration of this virtuous dynamic: recourse to debt is increasing, while the trade balance has not proven especially buoyant. In that regard, a number of papers have begun to classify the model of that period as “weakly export-led” (Hein et al., 2021) or even as presenting a “consumption-led balanced growth model” (Erixon and Pontusson, 2022).
The evolution of private debt has served to define the way many countries grow, but so have the types of commercial, productive, and financial interactions they undertake—at least within the group of developed countries. This was clearly observed in the expansionary period of the first decade of the 21st century; and yet the financial setbacks experienced in the subsequent decade have also strongly marked the growth dynamics of these countries.
In this research, we have seen that Sweden is no stranger to such circumstances. In its transition from the export-led model observed in the 1990s to the greater prominence of debt and domestic demand of recent years, the country experienced during the international financial expansion of the early 2000s what we have termed a hybrid “debt&export-led” model: it simultaneously combined a surplus and rising trade balance with higher levels of debt-driven domestic consumption and investment.
By identifying this hybrid model, we have sought to add both richness and taxonomic complexity to the literature on financialized growth models. That said, this research contributes mostly to the debate on the Swedish growth model: it describes this hybrid model as a result of a combination of factors inherent to the country’s export model of the 1990s and the ways in which financialization has affected its domestic economy. More specifically, we have identified two sets of factors. First, a successful export sector which, driven by an appropriate regulatory framework in a context of strong international demand, has benefited from two trends in turn. Shifts in the real exchange rate and the establishment of new foreign partnerships, particularly with China, strengthened the goods sectors, and, because of its low import intensity, improved the net export balance. At the same time, the rise of non-price competitiveness, prominently exemplified in the ICT sector but extending across a range of sectors, has had a crucial influence on the prosperity of service-oriented exports. The second set of factors is related to the ways in which financialization has been experienced in Sweden, through a historic increase in private debt levels simultaneous with a shrinking of the welfare state.
Finally, certain questions of great interest for understanding Sweden’s macroeconomic performance in recent decades have been left out of this research. For instance, the question of why Sweden (unlike most of its developed and partner countries) did not arrest the spiral of indebtedness (at least household indebtedness) in the 2010s is worthy of analysis. Related to this, further study should be pursued of the role of the domestic financial sector during at least the past two decades. The types of investment strategy implemented by the financial sector, relations with other domestic sectors and with international capital, and its way of adapting to both national and international regulatory changes may all have been key in determining the country’s growth mode in recent decades.
Footnotes
Declaration of conflicting interests
The author(s) declared no potential conflicts of interest with respect to the research, authorship, and/or publication of this article.
Funding
The author(s) received no financial support for the research, authorship, and/or publication of this article.
Notes
Appendix
Sweden’s share of world market exports by sector (in %). Source: Own elaboration from The Growth Lab at Harvard University. The Atlas of Economic Complexity: https://www.atlas.cid.harvard.edu.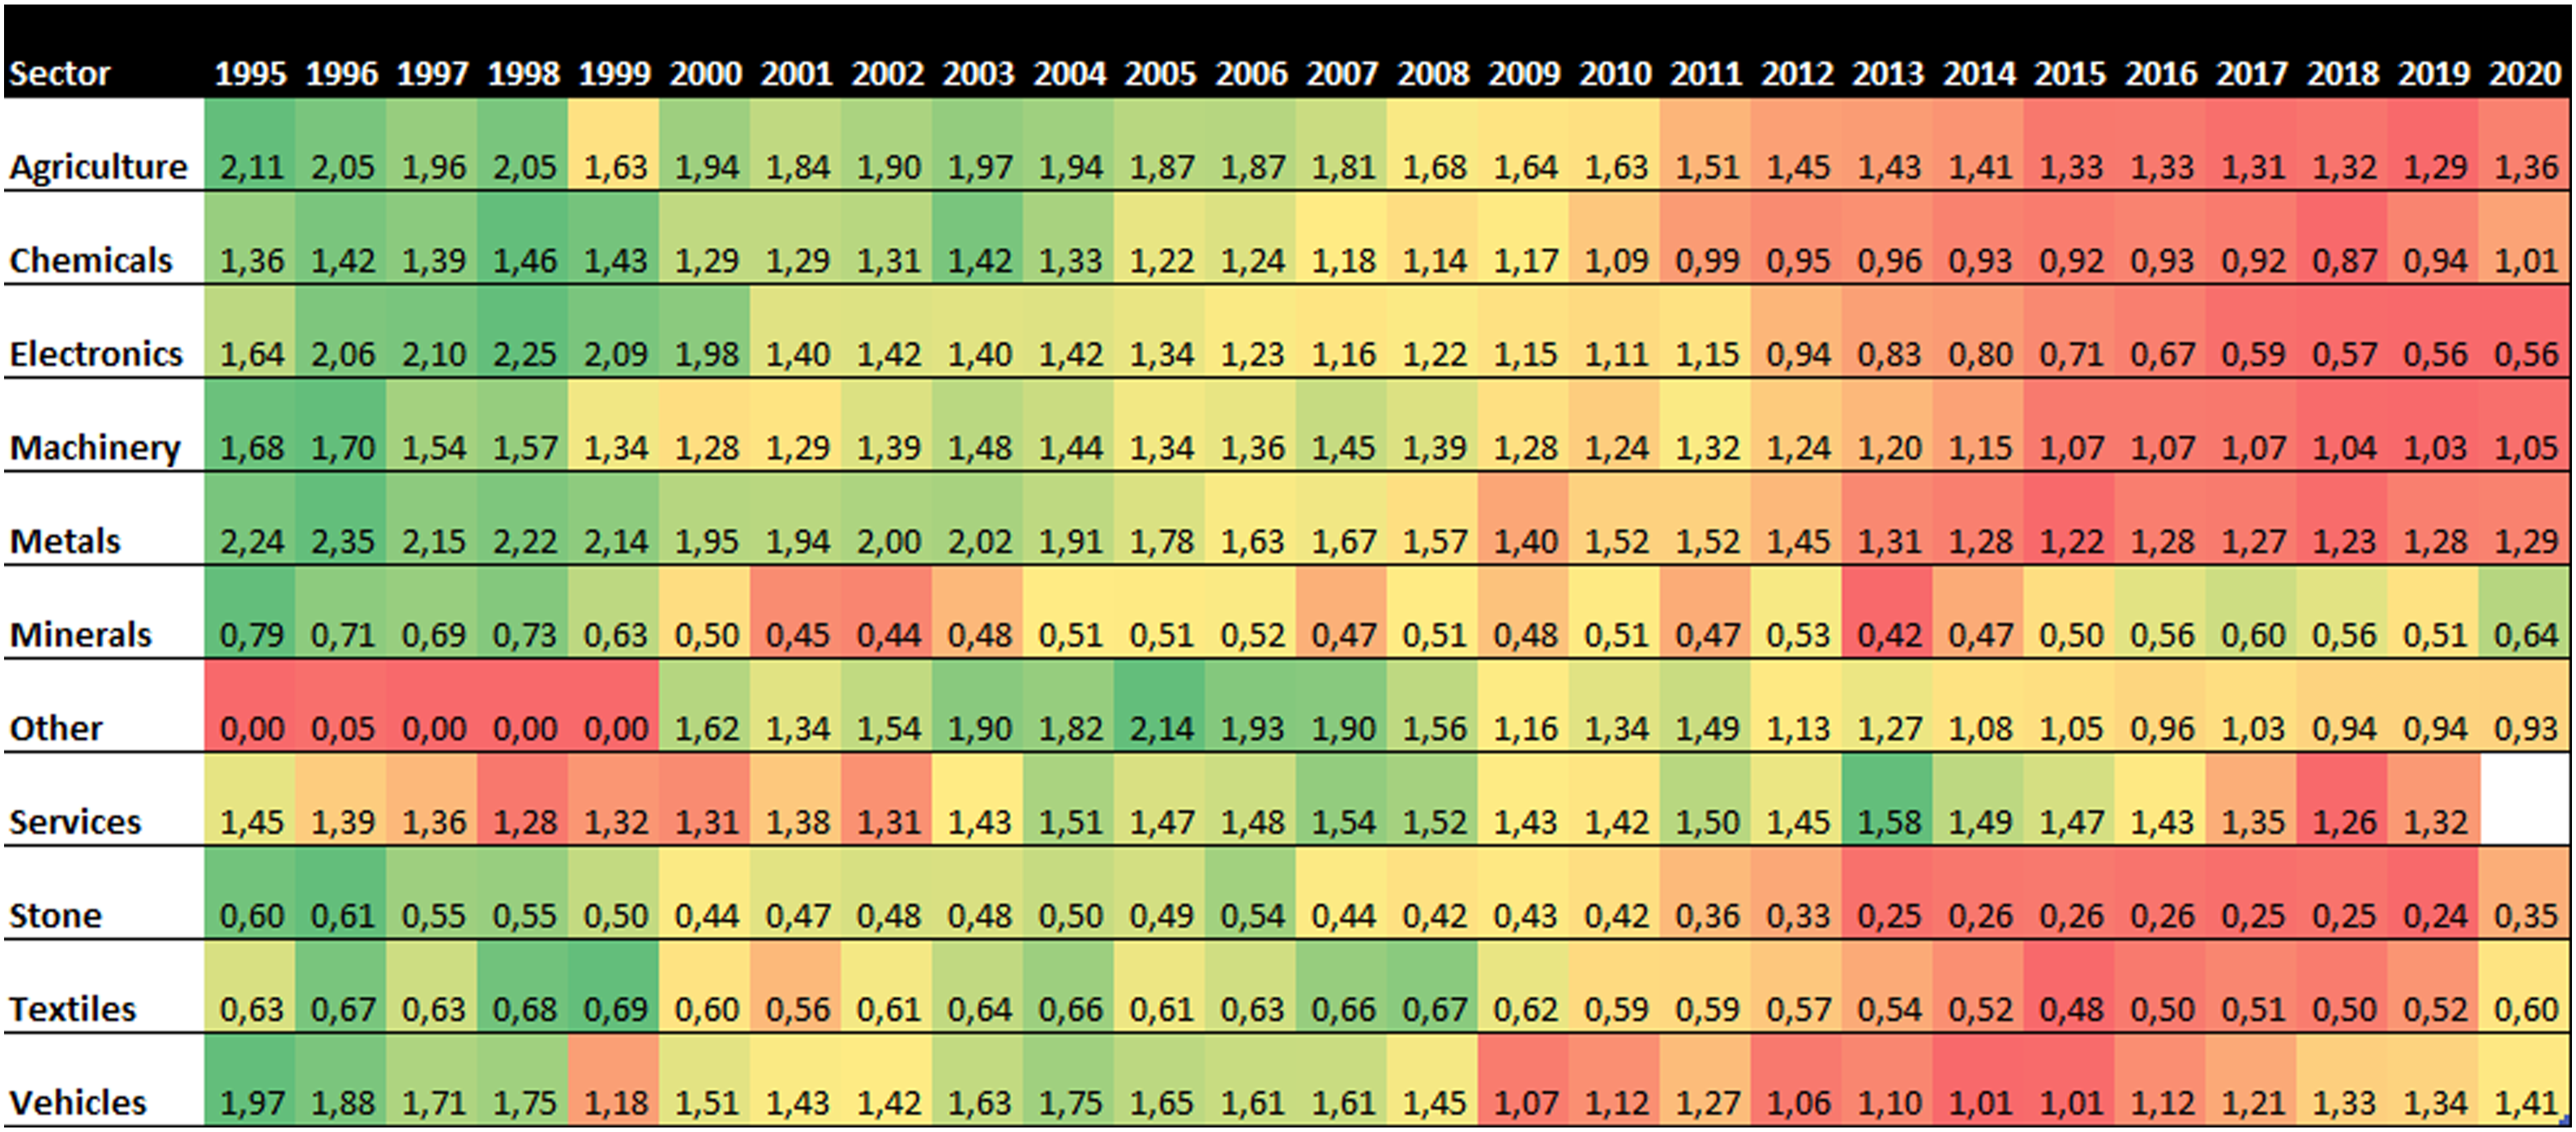
Changes in the Ratio of Credit to Non-financial Private Agents Over GDP and in the Trade Balance (% of GDP), 2000–2008.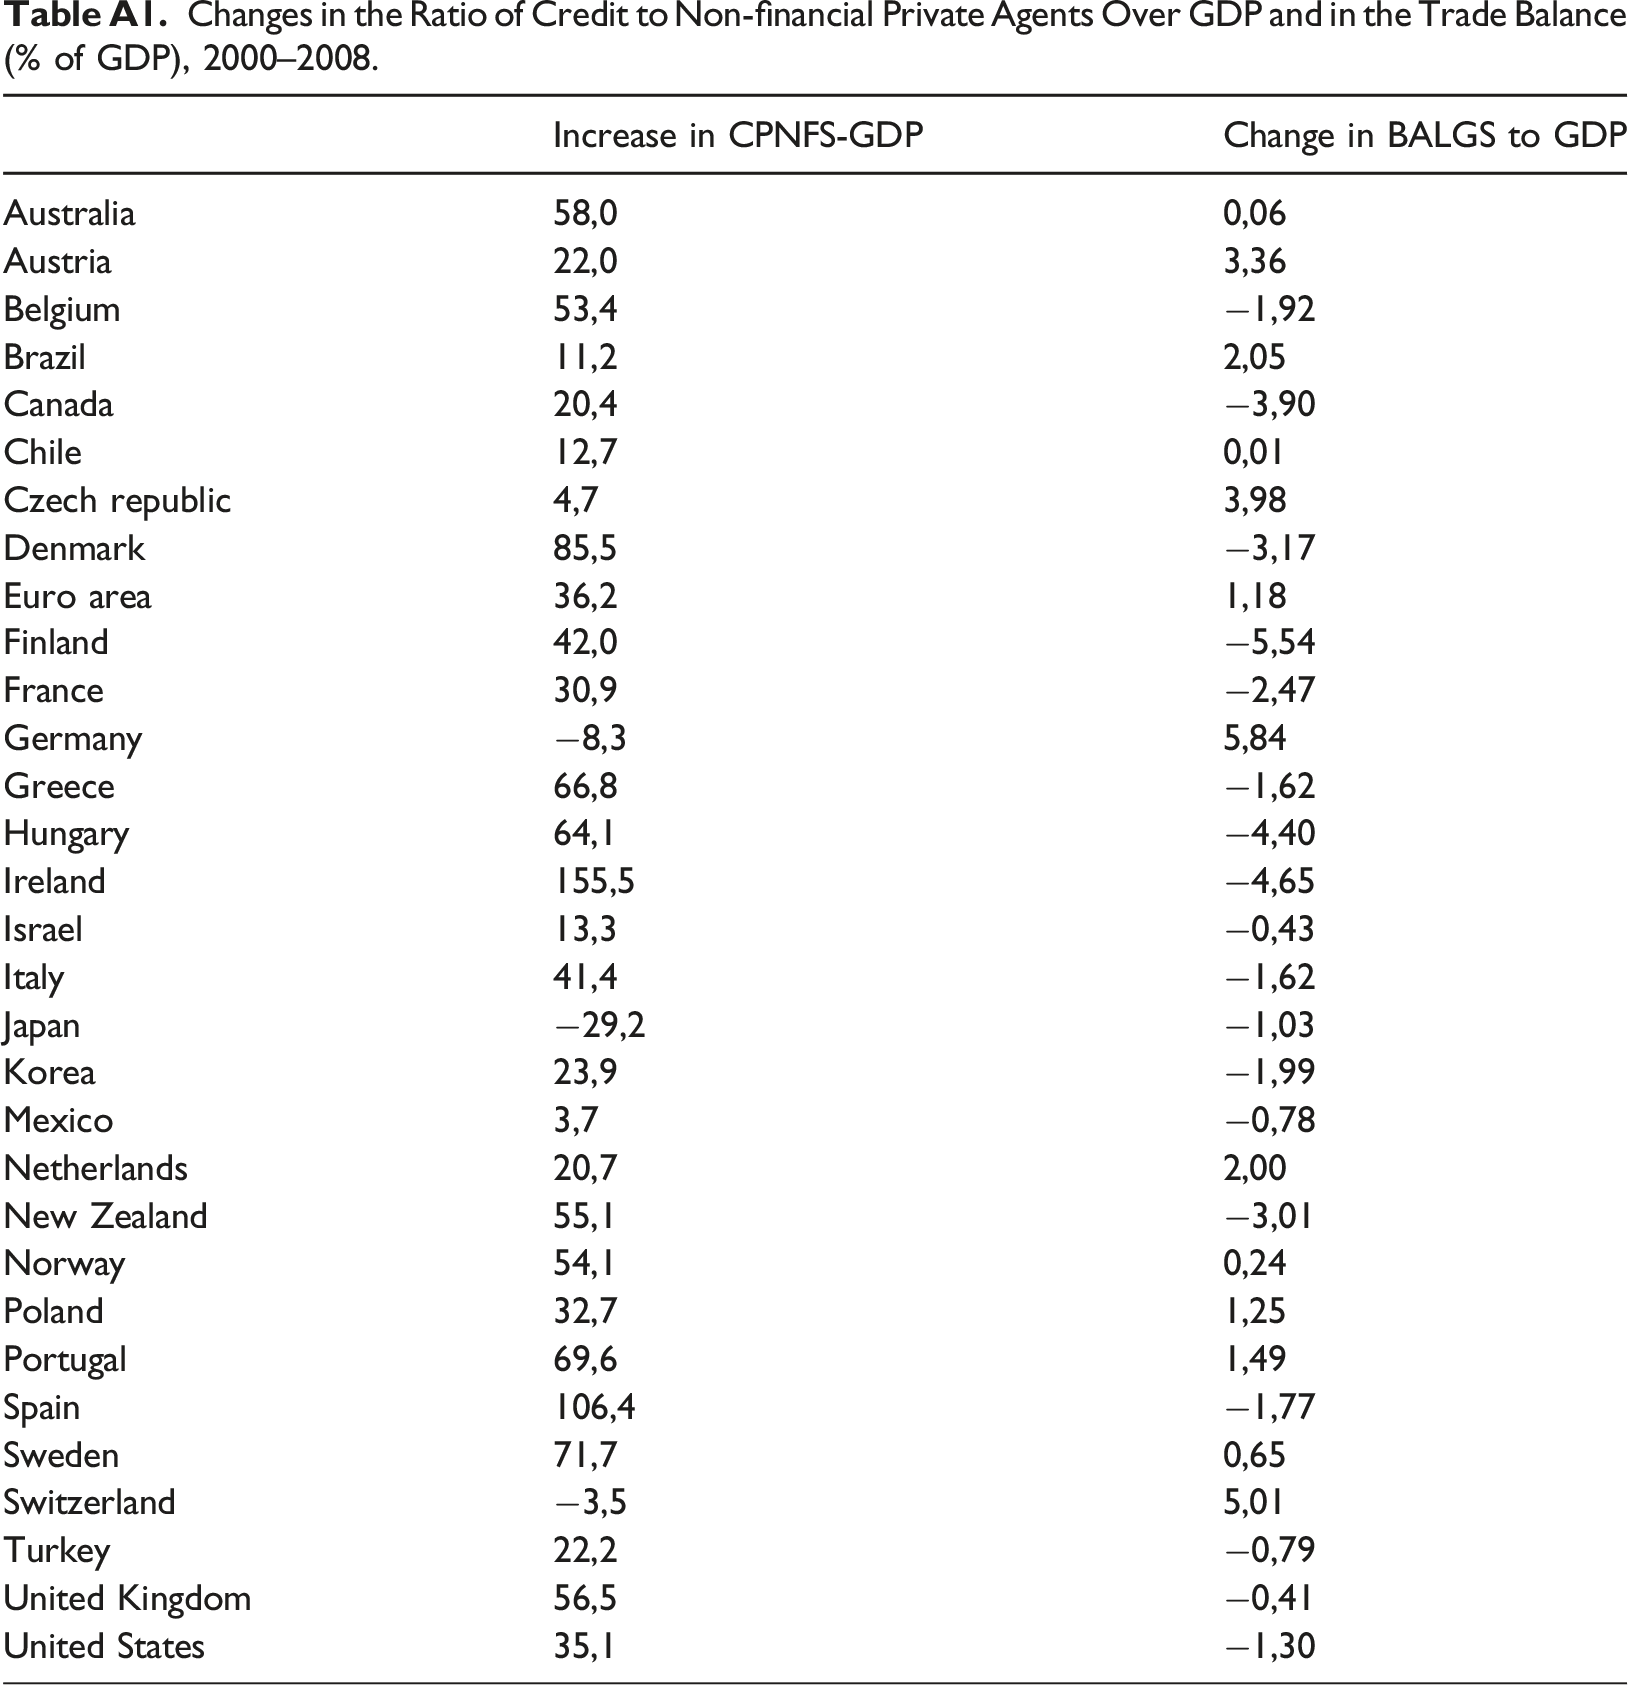
Increase in CPNFS-GDP
Change in BALGS to GDP
Australia
58,0
0,06
Austria
22,0
3,36
Belgium
53,4
−1,92
Brazil
11,2
2,05
Canada
20,4
−3,90
Chile
12,7
0,01
Czech republic
4,7
3,98
Denmark
85,5
−3,17
Euro area
36,2
1,18
Finland
42,0
−5,54
France
30,9
−2,47
Germany
−8,3
5,84
Greece
66,8
−1,62
Hungary
64,1
−4,40
Ireland
155,5
−4,65
Israel
13,3
−0,43
Italy
41,4
−1,62
Japan
−29,2
−1,03
Korea
23,9
−1,99
Mexico
3,7
−0,78
Netherlands
20,7
2,00
New Zealand
55,1
−3,01
Norway
54,1
0,24
Poland
32,7
1,25
Portugal
69,6
1,49
Spain
106,4
−1,77
Sweden
71,7
0,65
Switzerland
−3,5
5,01
Turkey
22,2
−0,79
United Kingdom
56,5
−0,41
United States
35,1
−1,30