
Abstract
The discipline of comparative political economy (CPE) relies heavily on aggregate, country-level economic indicators. However, the practices of multinational corporations have increasingly undermined this approach to measurement. The problem of indicator drift is well documented by a growing critical literature and calls for systematic methodological attention in CPE. We present the case for a rocky but ultimately rewarding middle road between indicator fatalism and indicator faith. We illustrate our argument by examining two important cases—Sweden’s recent export success and the financialization of non-financial corporations in France. A careful parsing of the data suggests corrections to common characterizations of the two cases. Swedish exports have been reshaped by intragroup trade among foreign subsidiaries of domestic corporations. The growth of financial assets held by French firms is attributable to the growth of foreign direct investment and to cumulative revaluation effects, while what remains of financialization is concentrated among the very largest firms. Based on these findings, we propose a methodological routine that parses data by zooming in on the qualitative specifics of countries, sectors, and firms, while using all available options for disaggregation.
Keywords
Introduction
Globalization, financialization, and the rise of multinational enterprises have eaten away at the bread and butter of comparative political economists—economic units contiguous with nation states. As if rapidly changing empirical realities were not enough, these same processes have also exacerbated measurement problems. The aggregate economic statistics comparative political economy (CPE) relies on stem from a time when firms domiciled in one country tended to produce their goods in that country, when firms’ financial activities did not dwarf their non-financial activities, and when it was straightforward to assign firms to countries. Those times are gone. While the majority of CPE scholars have continued to rely on statistical indicators for country-level comparisons, a small but growing literature has examined the flaws of even the most widely used indicators, such as the gross domestic product or foreign direct investment (Linsi and Mügge, 2019; Mügge and Linsi, 2020; Coyle and Nguyen, 2020; Assa, 2016). These flaws, and their sociological and political causes, deserve to be taken seriously. At the same time, CPE cannot afford to abandon the use of economic indicators altogether. This article makes the case for a pragmatic, yet challenging, middle road. In order to avoid mismeasurement and thus misclassification, CPE scholars need to bring qualitative scrutiny both to the construction of indicators and to the economic activities these indicators actually capture. Indicator problems in variegated dynamic settings are certainly not a novel challenge for comparative methodology. However, the distortions to economic indicators caused by twenty-first century large firms and value chains have reached such magnitudes that they warrant dedicated treatment.
We explore distortions in two core research fields of contemporary comparative political economy to both document measurement problems and offer constructive proposals for solutions—the research fields of postfordist growth models and of financialization. Our selection of these research fields is motivated by three considerations. First, both fields are widely popular in current CPE scholarship and hence ensure that our empirical explorations of indicator complications remain as closely tied to the everyday concerns of political economists as possible. Second, each case represents an important type of distortion caused by globalization and multinational enterprises—the declining value of traditional international trade indicators and indicators of financial stocks and flows. Third, the indicator problems visible in our two cases are less prominent in CPE discourse than most of the “elephants in the room” of globalization-induced measurement distortions, like for example intellectual property and foreign direct investment. By focusing on them—rather than on, say, FDI in the Caribbean or intellectual property in the Netherlands and Ireland—we aim to counteract the common misperception that indicator problems can be isolated in a straightforward way on the basis of a short-list of usual suspect countries and indicator categories.
The growth model literature has advanced the argument that a crucial factor characterizing the postfordist trajectories of rich countries has been their differential capability to restructure exports away from simple goods (Baccaro and Pontusson, 2016). We demonstrate that the increasing internationalization of production and the importance of intrafirm trade seriously impair our ability to understand such restructuring processes from traditional trade statistics. Focusing on the case of Sweden, which has been described as a leading example of successful renewal, we present evidence that a considerable share of Sweden’s export success may be attributed to a specific type of transaction, very likely among foreign subsidiaries of MNEs. While conventionally registered as exports of goods in the balances of payments since 2009, goods associated with such transactions never physically pass through Swedish ports or production facilities and may therefore have less to do with Swedish economic activities in the classic sense than with the organizational strategies of MNEs. We mirror these findings with parallel observations from a second critical case in the growth model literature—Germany, which has since the 1990s significantly expanded the import of products from low-wage economies processed into “German exports.”
The literature on financialization has argued that the growing importance of finance is not just a story about intersectoral reallocation, but reflected in changing structures within the non-financial economy. Based on corporate account data, the French economy has been presented as a standout example of the financialization of non-financial companies (Alvarez, 2015). We show that a decomposition of national accounts suggests that the increase of the stock of financial assets held by non-financial companies can be attributed to the increase of outward FDI undertaken by French MNEs on the one hand, and to simple valuation effects linked to a secular increase in the valuation of corporate shares on the other. The picture changes further when the commonly used flow measure of gross financial income is replaced with the net measure of financial profit, which has consistently been negative, with the exception of only a few very large corporations.
Our analysis demonstrates that, when cleaned of distortions caused by cross-national flows of goods, services, and capital through large corporations’ circuits, the data casts a different light on the two trends of financialization and postfordist export restructuring. In both empirical cases, we diagnose potential fallacies resulting from what one may call indicator drift: the original meaning of measures meant to capture specific economic activities in the past has changed in an altered economic environment (Linsi, 2018). In both cases, we combine quantitative de-aggregation exercises with qualitative insights to zero in on likely explanations for the behavior of aggregate indicators.
The dominance of multinational enterprise has led critical scholars to call for a scaling back of the search for diversity in comparative political economy, since the increasing transnational footprint of firms may reduce the diversity of national political economic regimes (Streeck, 2010: 29). While our analysis provides support to critiques of the nation as the basic unit of analysis in CPE, we do not believe that the comparative project is in danger per se, as may be suggested by critical recent work (Mügge and Linsi, 2020; Lukas, 2020). In a constructive spirit, we propose to decompose, reinterpret, and enrich existing indicators in ways that reduce noise in the data and capture the peculiarities of large, multinational firms.
The article is organized as follows. The Problems With Measuring “the Economy” section reviews the critical literature on economic indicators and presents a compilation of major current indicators distortions. In the Growth Models, Export Indicators, and the Globalization of Production section, we show how a decomposition of Swedish trade data changes our understanding of the likely substantive changes of Swedish export performance over the last 30 years. The Not So Financialized After All? Firm Financialization in France section decomposes widely used statistics on the financialization of firms, using the important case of France. Both empirical cases show the benefits of decomposing national aggregates and of accounting for the activities of MNEs. The Methodological Ways Forward: Zoom In and Disaggregate section summarizes our approach and methodological ways forward. It makes the case for integrating an organizational perspective into the standard toolkit of CPE analyses to routinely cope with indicator problems.
The problems with measuring “the economy”
Comparative political economy has long relied on what may be called an uncritical theory of measuring “the economy.” Notwithstanding extensive discussions about how to create “equivalence” when comparing similar objects in dissimilar settings, especially with regard to non-quantified, non-standardized, and qualitative objects of study (Van Deth, 1998; Locke and Thelen, 1995), economic indicators such as FDI, GDP, patent registrations, or exports and imports continue to be routinely used as variables in cross-country comparisons. This has begun to change, but CPE continues to lag behind other disciplines, and especially statistical agencies themselves, which have become ever more sophisticated in their use and interpretation of economic indicators.
Indicator critique in neighboring fields
This section presents the main arguments, made in neighboring disciplines, against the uncritical use of economic indicators. For the purpose of presentation, we group these into ethical, social constructivist, and historical arguments. First, many have challenged the use of economic statistics as measures of human progress and well-being on ethical grounds (e.g., Stiglitz et al., 2010). The fixation of economists and policymakers on GDP growth, for instance, has been criticized for being oblivious to public goods, unpaid labor, and externalities. Such critiques should push CPE scholars to consider the methodological pitfalls of comparing countries on the basis of normatively biased indicators. Beyond normative considerations, however, this literature rarely aims at working out the analytical problems and pitfalls of the use of economic statistics.
The second type of critique of economic indicators is grounded in social constructivism. The social construction of “the economy” as an epistemic object has received extensive attention in economic history and sociology (Mitchell, 1998). Here, the construction of quantitative economic indicators, rather than reflecting a rational process of conceptualization, is influenced by contingent historical events, social power struggles, and organizational dynamics. Historical studies of the construction of quantitative indicators for economic progress (Cook, 2017; Özgöde, 2020; Coyle, 2015) or unemployment (Salais et al., 1986; Benanav, 2019) can give CPE scholars a better sense of how—and why—many indicators are biased. However, although constructivist accounts can contribute to the understanding of economic indicators, they rarely provide practical guidance for how to make better use of them.
The third type of critique has the most straightforward implications for comparative empirical research. It argues that, as theory-laden constructs tailor-made to specific historical circumstances, economic indicators are vulnerable to drift due to historical change. Changing techniques of government, business practices, sectoral structures, and trade patterns may all undermine the reliability and validity of economic indicators. This problem is not, of course, new. International organizations and national statistical agencies have been aware that changing trade patterns and business behaviors routinely undermine the reliability and validity of international trade statistics since the 1960s (Linsi and Mügge, 2019). Today, all major providers of international economic data, like the Bank for International Settlements, Eurostat, the International Monetary Fund, and the US Bureau of Economic Analysis, maintain standing programs to reform practices of measurement, indicator construction, and interpretation.
Four major fields of indicator problems
Indicator problems related to globalization are constantly in flux and hence difficult to typify exhaustively. At the risk of oversimplifying, we highlight four main areas of concern that have been extensively discussed by specialists: foreign direct investment, intangibles, production, and financial flows. Political economy scholars need to engage with these discussions, which our analysis shows often have substantial implications for the validity and reliability of core concepts and variables in comparative research.
Foreign direct investment
FDI is commonly understood as reflecting “brick and mortar decisions” (Blanchard and Acalin, 2016: 1). The major standard setters in international accounting traditionally define FDI as investments that relate to “the objective of a resident entity in one economy obtaining a lasting interest in an enterprise resident in another economy” (IMF, 1993: 86). Since the early 1990s, the most-used—but by no means universal—criterion to classify capital flows as direct investments has been the threshold of 10% or more of “the ordinary shares or voting power” an investor acquires in a direct investment enterprise abroad (ibid.). In both CPE and the wider policy discourse, FDI flows have often been understood as closely linked to national “competitiveness,” such as when Michel Albert cited net-increasing FDI outflows from Germany as an indicator of the potential future decline of the Rhenish model of capitalism (Albert, 1997). 1
Specialized agencies have long been debating the overall poor, and rapidly declining, quality of standard FDI measures (Linsi and Mügge, 2019). Two problems stand out: technical measurement issues and the increasing share of activities recorded as FDI that have little to do with traditional ideas about entities seeking controlling stakes in productive capacity abroad. Concerning FDI measurement, the main issues arise from countries’ differing data collection and valuation practices (Linsi, 2018). For instance, authorities’ legal rights to access data through survey methodologies vary across countries, creating problems for the bilateral matching of nationally recorded FDI figures (Linsi and Mügge, 2019). Questions of valuation compound these problems. As a significant number of transactions recorded as FDI flows happen outside of markets—within firms or with unlisted equity changing hands in private transactions—authorities have long struggled to develop conventions to value FDI stocks and flows (Zucman, 2013: 1358). Despite continuous efforts at harmonization (particularly around the recent IMF Balance of Payments Manual 6), FDI valuations often do not match between countries, and, even with a constant method of valuation, FDI estimates fluctuate widely with different estimation techniques (Damgaard and Elkjaer, 2014).
Besides technical measurement issues, there is ample reason to believe that an increasing share of transactions recorded as FDI has very little to do with traditional ideas about direct investment. To name just a few stylized facts underlying recent doubts about FDI measurement: nine small countries commonly considered as global tax havens host over 40% of global FDI (Damgaard et al., 2019). Several countries, such as Hungary, display very high correlations between inward and outward FDI, which is difficult to square with traditional notions of controlling investment (Blanchard and Acalin, 2016). A significant share of global FDI can be attributed to “pass through” and intrafirm constructions, channeling funds through multiple jurisdictions and vehicles, presumably for tax liability and obfuscation purposes (Borga and Caliandro, 2018; Reurink and Garcia-Bernardo, 2020). Data for Luxembourg and the Netherlands suggest that the vast majority of FDI claims today are held in largely intransparent Special Purpose Entities (Lane and Milesi-Ferretti, 2017)
Intangibles
Returns on intangibles like licenses, trademarks, knowledge, and design today account for about a third of the income in global value chains (Chen et al., 2018). Deficiencies in the official accounting for intangibles received a wave of interest in the aftermath of Ireland’s reporting of a jump in GDP by 24.5% in 2015. As many have argued, this spike came about from a sizable relocation of intellectual property to Ireland by one or more giant firms, generating ripple effects throughout the eurozone’s budgetary statistics (Tedeschi, 2018). As argued by Setser, since the Great Financial Crisis, tax-motivated intrafirm transactions involving intangibles (which in the EU mostly flow through Ireland and the Netherlands) have significantly affected core economic indicators across the eurozone, such as domestic demand and net exports, not to speak of the services balances between, and corporate metrics within, trading countries (Setser, 2020). Tax rates have been shown to significantly influence the geographic allocation of multinationals’ patent registrations, both in terms of quantity and in terms of the quality of patents (Baumann et al., 2020). Estimates for the quantitative importance of intangibles for trade balances suggest a dramatic increase since the 1990s. Charges for the use of intellectual property, for example, made up an estimated 17% of US services exports in 2016, of which 56% are ascribed to the internal dealings of American MNEs (Jenniges et al., 2019).
The latest research suggests that global intangibles-related income flows, as well as national indicators of investment in intangibles, strongly follow profit-shifting logics (Grubert, 2003; Dischinger and Riedel, 2011). Multinational enterprises have in recent years created intricate global networks of fictitious billings and transactions around intangibles to shift income between jurisdictions. These fictitious billings represent a fundamental challenge for the official recording of macroeconomic and balance of payments data (Hebous et al., 2021). The recent CPE literature has argued that the multinational outgrowths of FDI-led growth models in Europe have also had “real” economic correlates in tax haven countries (Brazys and Regan, 2017; Bohle and Regan, 2021). However, the development of clusters like Ireland’s Silicon Docks pale in comparison to the contemporary volume and complexity of tax haven-oriented intragroup transactions across the EU and the globe.
Production
The organization of production has undergone fundamental transformations since the 1980s (Baldwin, 2011; Gereffi, 1994; Reurink and Garcia-Bernardo, 2020). The fracturing of the nationally bound, vertically integrated manufacturing corporation into complex global value chains poses fundamental challenges for economic data collection and classification (Sturgeon, 2013). For instance, when residents of a country direct or organize the flow of goods abroad, without those goods ever physically entering that country, major components of the global division of labor remain unrecorded (Linsi and Mügge, 2019).
Added to the complications of measurement, global value chains systematically undermine the meaningfulness of core economic measures used in economic analysis and policy debate. The most-discussed problem concerns the increasing meaninglessness of gross figures and bilateral trade indicators. In a world of extensive trade in intermediate goods, re-imports, and complex intragroup dealings across national boundaries, gross figures of a country’s exports and imports say increasingly little about that country’s position in the global division of labor. The crucial and oft-used measure of countries’ competitiveness, Real Effective Exchange Rates (REER), have unclear implications in a world of fractured production (Gunnella et al., 2017: 80). Similarly, countries’ bilateral trade balances can seriously misrepresent their place in global value chains. The challenge of the global fragmentation of production has led influential international institutions such as the OECD and the World Bank to develop alternative trade indicators, most notably via the Trade in Value Added-Initiative.
Indicator problems arising from the globalization of production also affect standard economic measures such as the GDP contributions of different sectors. As recently argued by Coyle and Nguyen, the activities of a significant fraction of firms engaged in manufacturing in rich countries are recorded as service activities simply because of the “formal” internal division of tasks in multinational enterprises (Coyle and Nguyen, 2020). As a result, the deindustrialization of high wage (as well as potentially high tax) countries may be systematically overstated.
Finance
In the aftermath of the financial crisis of 2008, scholars debated whether global financial integration had made traditional indicators of international economic exposures—particularly the current account—obsolete (Obstfeld, 2012). The traditional focus on countries’ net financial positions obfuscates much larger and increasingly risk-bearing gross international financial flows, which are often not captured by the categories of the balance of payments or the system of national accounts (Linsi and Mügge, 2019). Global capital flows are systematically obfuscated through complex holding structures and Special Purpose Entities, while at the same time distorting national accounting indicators in misleading ways (Zucman, 2013). To give a much-discussed example quoted by Linsi and Mügge (2019), Federal Reserve researchers in 2001 found that more than half of recorded US portfolio outflows were caused by stock swaps during foreign acquisitions of US firms, and hence without any substantive capital “outflows” (Griever et al., 2001).
The problems with accounting for global capital flows are compounded by two recent developments: the global rise of non-bank financing and the emergence of non-financial multinationals as originators of significant capital flows. Since the financial crisis, banks have significantly cut back on international lending. In their stead, market-based lending by asset managers, funds, and other intermediaries has risen sharply in recent years, particularly to borrowers in emerging economies (Fernandez and Wigger, 2016; Lane and Milesi-Ferretti, 2017; CGFS, 2021: 5). Multinational non-financial firms significantly add to the increasing opacity. As shown by Avdjiev and colleagues, the global dealings of multinational firms leave clear traces in the current accounts of major countries, contingent on them being home to MNE shareholders, operations, or legal residencies (Avdjiev et al., 2018: 62). Rather than indicating financial relations between nationally contained “economies,” financial flows registered in national accounts today “might simply reflect the hierarchical organization of production networks and interactions between affiliates” (CGFS, 2021: 7).
To reiterate, our overview of four major fields of distortions in measuring “the economy” is far from being exhaustive but represents a snapshot of the notoriously dynamic field of corporate (re)organization. This snapshot provides strong support for the argument that the hallmark of globalization is not the extension of market transaction to a global scale, but the extension of intrafirm and heavily coordinated interfirm, and thus often non-market, relations (Sturgeon, 2013). Given the reliance of national accounting on market prices and transactions, this predominance of internal corporate and network structures creates difficult methodological problems for CPE scholars.
In order to show how these problems impact ongoing CPE debates, and what CPE scholars can do to mitigate these problems, the remainder of this article discusses two empirical cases in detail. Again, a caveat is in order. There are no “representative cases” for corporate globalization-induced indicator problems, nor one-size-fits-all solutions. Our empirical cases should hence be understood as exemplary of the general problematique of corporate globalization for CPE, not as illustrations of specific distortions or blueprints for statistical remedies. We chose our cases to counteract the common misperception in CPE and public discourse that indicator problems are confined to usual suspect countries (i.e., tax havens) and usual suspect domains (i.e., FDI and intangibles). Hence, we discuss indicator problems arising from the spheres of production and finance in “ordinary” OECD countries, namely Sweden and France. In each case, changing corporate structures and practices require CPE scholars to go the extra mile in order to be able to draw meaningful conclusions from macroeconomic statistics.
Growth models, export indicators, and the globalization of production
Our first case revisits recent debates about the Swedish growth model. CPE scholars have presented Sweden as a model case for rich capitalist economies due to its ability to combine equality and efficiency, as well as domestic with trade-based growth drivers (Pontusson, 2011; Baccaro and Pontusson, 2016). While core empirical components of this assessment—such as levels of inequality, union strength, or service-sector employment—are rather straightforward to observe and compare, the issue of export sector renewal is empirically thornier.
Macroeconomic pattern recognition in the growth model literature
In their path-breaking article, Baccaro and Pontusson (2016) demonstrate that, in contrast to the trajectory of Germany, Sweden’s exports still show signs of relative price-insensitivity. The avoidance of price competition through countries’ production profiles was long held to be a core enabler of capitalist models avoiding pressures on wages and the welfare state (Streeck, 1991). The diverging trajectories of Sweden and Germany are a particularly relevant finding for the larger CPE debate. They suggest that the much-discussed pathologies of the German model of export dependence for growth—constitutionalized austerity, exorbitant dualism, competitive wage restraint, and neo-mercantilist support of the export sector—are not unavoidable. They rather seem to be symptoms of a morbid growth model under pressure from globalization and technological change. Postfordist restructuring into a more “benign” and “balanced” growth model through the targeted strengthening of a country’s most advanced sectors may be possible after all (cf. Iversen and Soskice, 2019).
The recent literature on growth models can be understood as an important case of indicator decomposition. The innovative move by Baccaro and Pontusson (2016) is to go beyond unqualified comparisons of economic performance and towards comparing the functional components of growth. The growth model argument focuses on comparative macroeconomic pattern recognition but does not study in detail the economic activities that drive those patterns. Citing earlier empirical work, the growth model literature points to Sweden’s ICT sector as a prime suspect for driving the comparative differences. Sweden, like Finland, profited from the first global boom in mobile communications largely through a single giant firm, Ericsson, which at the height of its dominance in 2000 accounted for about 20% of total Swedish exports (Erixon, 2011: 309). It is much less clear which economic activities have driven Swedish exports after Ericsson’s decline, and especially after the global financial crisis. Below, we present indications suggesting that Sweden’s distinctive restructuring path is, to a significant extent, a function of the country’s embedding in global value chains and multinational corporate structures.
The rise of merchanting exports in Sweden’s trade data
Attempts to decompose macroeconomic statistics in political economy usually look at the measuring categories that have clear “real world” correlates, such as sectoral and activity-based categories like ICT or tourism. Like in other small European countries, more opaque macroeconomic accounting categories have been registering significant changes in Sweden for the past 30 years. Unlike Luxembourg, Ireland, and the Netherlands, Sweden does not usually feature on lists of offshore jurisdictions. Yet, its registered exports in a particular accounting category called net exports of goods under merchanting have grown to a degree commonly only observed in suspected tax havens (see Figure 1). Net exports under merchanting per GDP, 2000–2020. Source: Eurostat.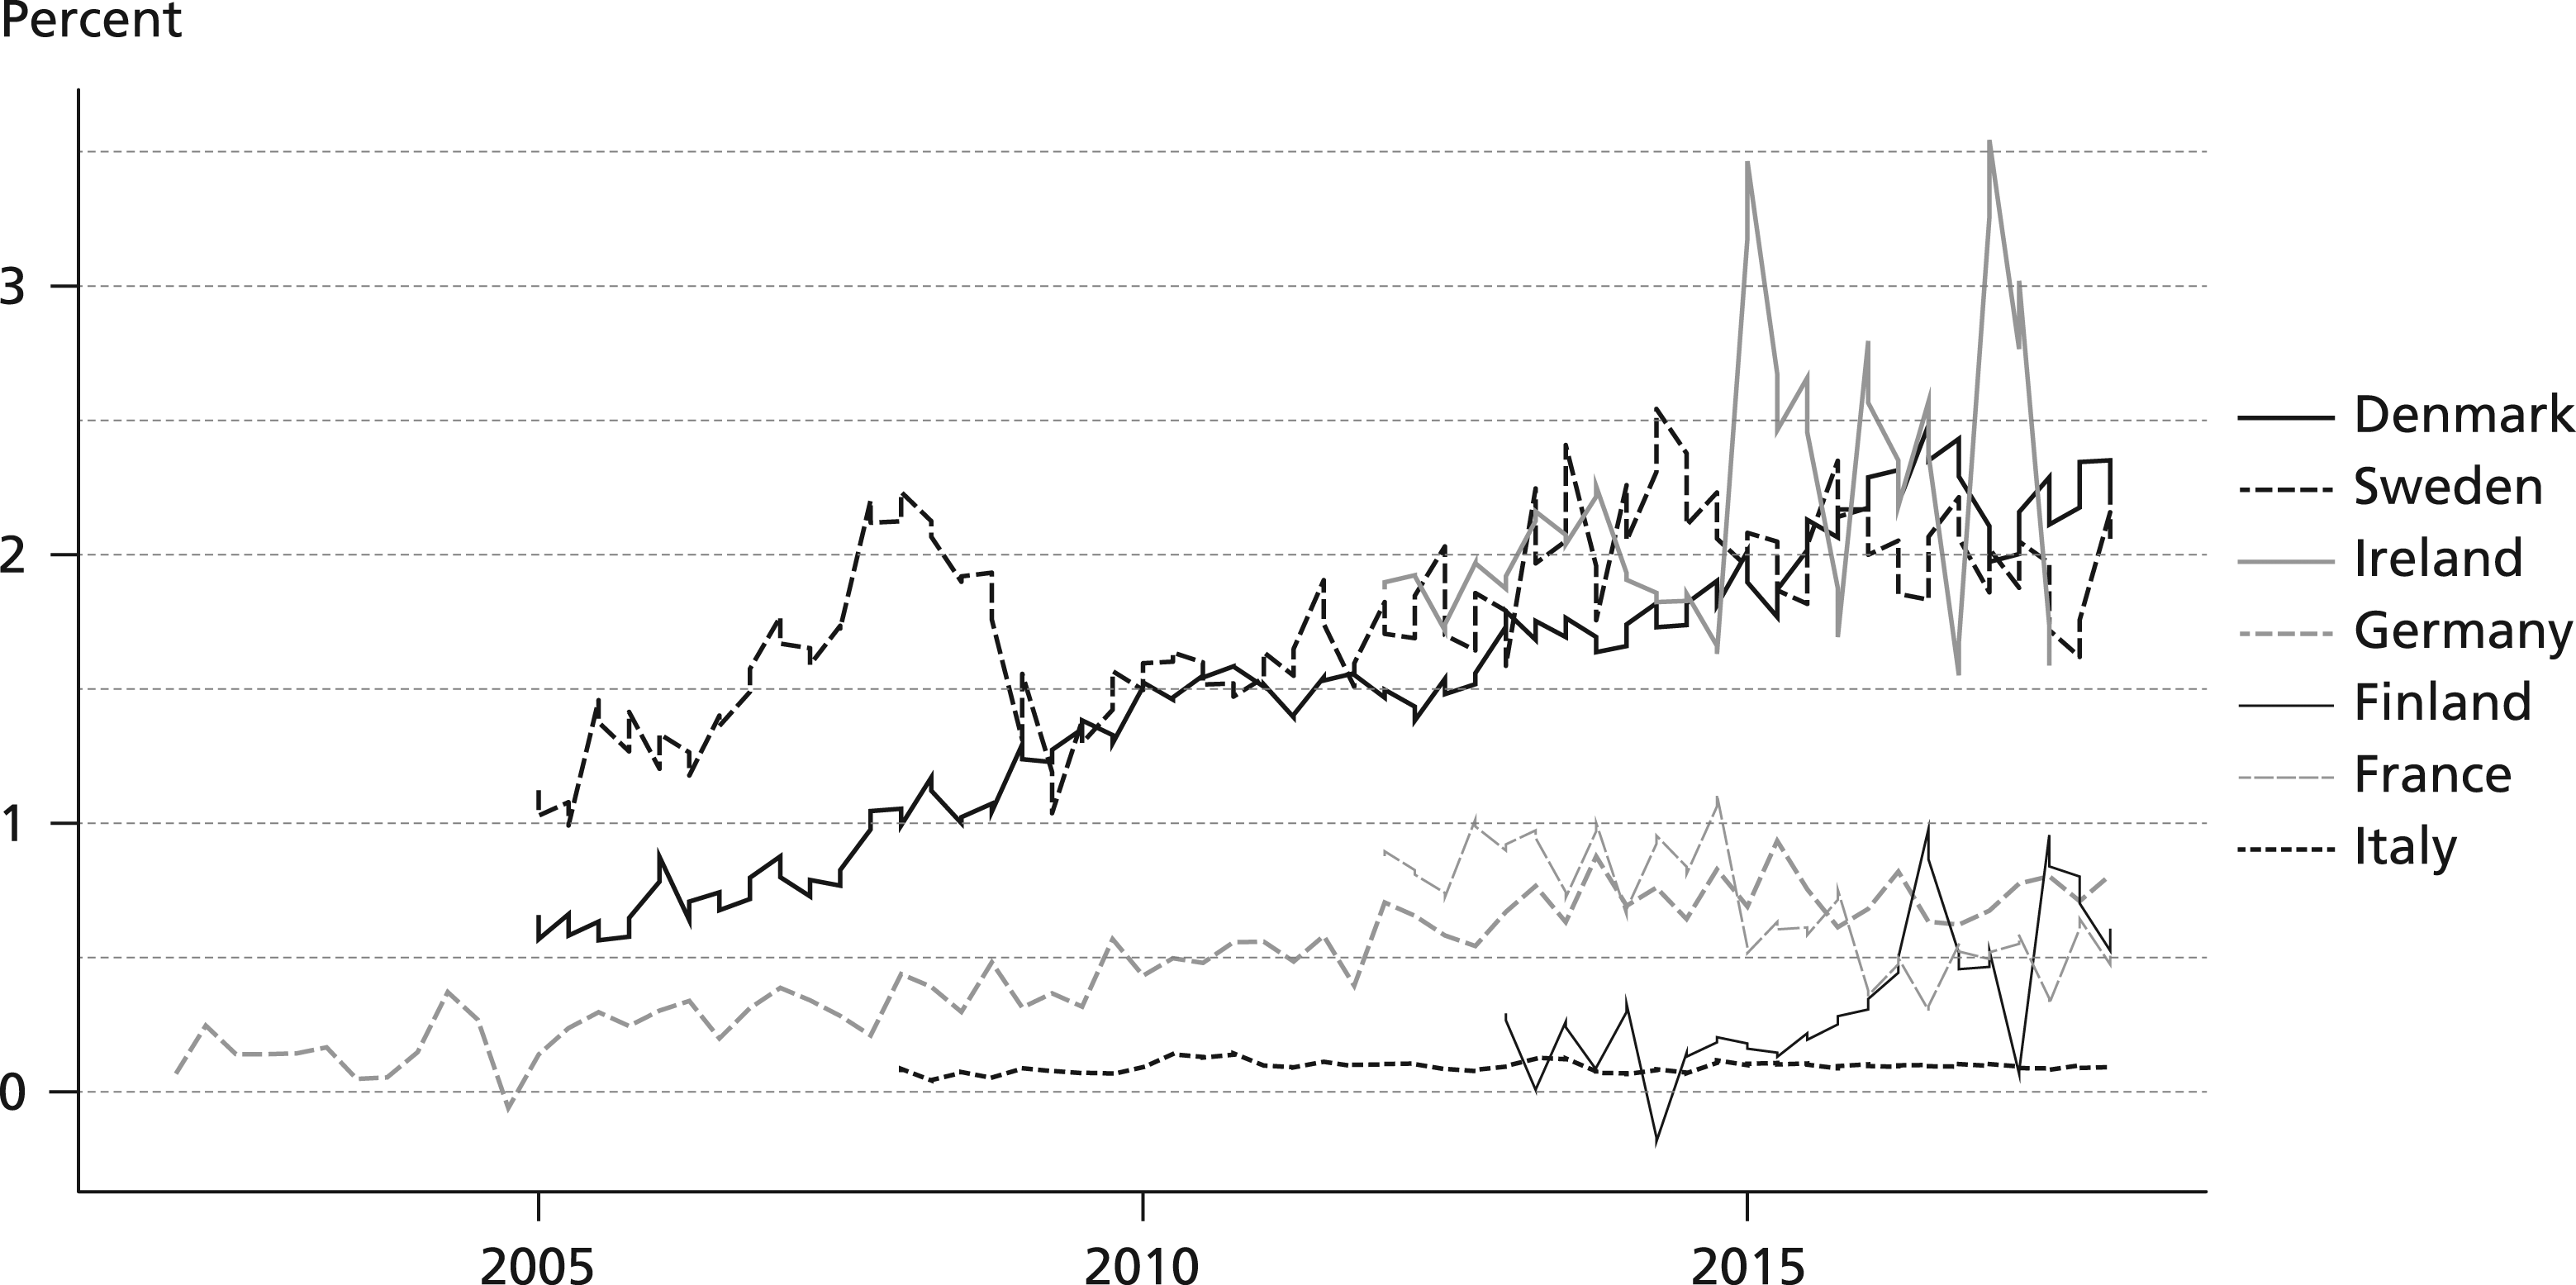
Merchanting “exports” are added to countries’ export figures when resident entities of a country buy goods from an entity in one foreign country and sell them to an entity in another foreign country. Importantly, the goods under merchanting do not officially enter the merchanting entity’s home country (otherwise they would constitute re-exports). The price difference—or “margin”—between the purchasing and sales price of goods under merchanting is booked as a net-export to the merchanting entity’s country of residence. While many countries have for a long time only recorded such net-values, an increasing number of countries have recently begun to amend statistics with gross figures. In these gross figures resident entities’ purchases of goods abroad for the purpose of resale in a third country constitute gross merchanting “imports,” while their sale constitutes a corresponding “export.” Merchanting exports have for a long time only played a significant role in the external balances of nations home to large commodity traders, like Hong Kong and Switzerland (Haller, 2019). In recent decades, their volume has exploded as a consequence of the globalization of production and rampant profit-shifting activities. Few countries document if the parties involved in merchanting transactions are related or unrelated, and the degrees of freedom involved in intragroup pricing (“transfer pricing”) have made it into one of the major accounting categories reacting to MNEs’ profit-shifting activities (Hebous et al., 2021).
According to Eurostat data, the combined volume of Swedish gross merchanting imports and exports has grown from 12% of GDP in the early 2000s to currently over 20%, while net exports of goods under merchanting rose from 0.6% of GDP to more than 2%. They accounted for almost 40% of the Swedish current account surplus in 2017 (Fard et al., 2017). While already impressive on its own, Swedish merchanting exports have expanded considerably faster than those of many of its neighboring economies and, even though they do not reach the levels of some European tax havens (e.g., Luxembourg and Ireland) or commodities trading nations (e.g., Switzerland), they by far outpaced those of Germany, France, or Italy. Only Denmark has shown a similar profile among the non-tax-haven, non-commodities trading industrial nations (Bo et al., 2018).
The explosive growth of merchanting exports in Sweden complicates attempts to characterize the country’s comparative trajectory based on official economic data. The accounting categories related to trade in goods under merchanting pose substantial classificatory problems for comparative research. Up until the sixth edition of the Balance of Payments Manual of 2009 (IMF, 2009), merchanting exports were customarily classified as services exports under the category of Other Business Services (in line with the traditional merchanting activity they used to track). Reflecting the increasing role of merchanting transactions in global value chains and intragroup trade, the Manual today suggests registering merchanting margins as goods exports. As mentioned above, adoption of indicator conventions is in no way universal or centrally coordinated, but should be understood as an ongoing dialogical process.
For countries with substantial merchanting exports, this implies major comparability issues between different studies, databases, and countries—especially with regard to prominent CPE questions about deindustrialization and postfordist restructuring. To give an example, currently available OECD data still include merchanting exports as exports of Other Business Services, lifting total services to a 2.04% net-contribution to Sweden’s current account, compared to a—0.68% retention to Germany’s in 2016. Deducting Eurostat’s net merchanting numbers from the service account brings Swedish numbers into the negative territory (−0.17%), and closer to Germany’s (−1.30%).
The growth of merchanting as a problem for data legibility
Merchanting exports and related concepts make it increasingly difficult to infer a clear comparative picture of the economic fate of countries from economic indicators. Getting from datapoints to qualitative estimates about countries’ economic trajectories requires partly idiosyncratic and increasingly complicated attempts at understanding the indicators’ relationship to the production networks of global firms.
The opacity of merchanting exports is a prime example for this problem. The fact that the activities reported to Swedish authorities as merchanting are “Swedish” in any substantive sense is not reliably implied by the data—even if they belong to the category of Swedish goods exports. Moreover, merchanting exports do not have to imply the same economic characteristics comparative political economists usually associate with “exports,” especially in terms of domestic production and employment. As merchanting exports may in large part be detached from the domestic economy, Swedish experts doubt any positive ripple effects on job and investment growth in Sweden (SEB, 2014; Boumediene and Grahn, 2015). In fact, relocation and outsourcing decisions by Swedish entities today might simply replace one type of recorded export in the goods account with another type of recorded export in the goods account with fundamentally different consequences for what is usually considered to be a cornerstone of a prospering economy.
Tracking down exactly where the rise of merchanting exports in the Swedish balance of payments comes from and what substantial shifts (if any) in Swedish economic life they signify would require detailed industrial research in reporting firms. Still, we aim to demonstrate how a deeper investigation of trade data can help to better situate the rise of merchanting in the political economy of Sweden. The question of the origins and drivers of merchanting exports in Sweden is complicated by the fact that disaggregating net merchanting exports into purchases and sales of goods reveals ample variation between countries. Swedish entities registered a high volume of such transactions as well as significant margins, other countries very high volumes, but low margins, yet others low volumes and high margins (see Figure 2, which excludes tax havens like Luxembourg). Merchanting total volume (sold plus acquired) per GDP, 2000–2020. Source: Eurostat.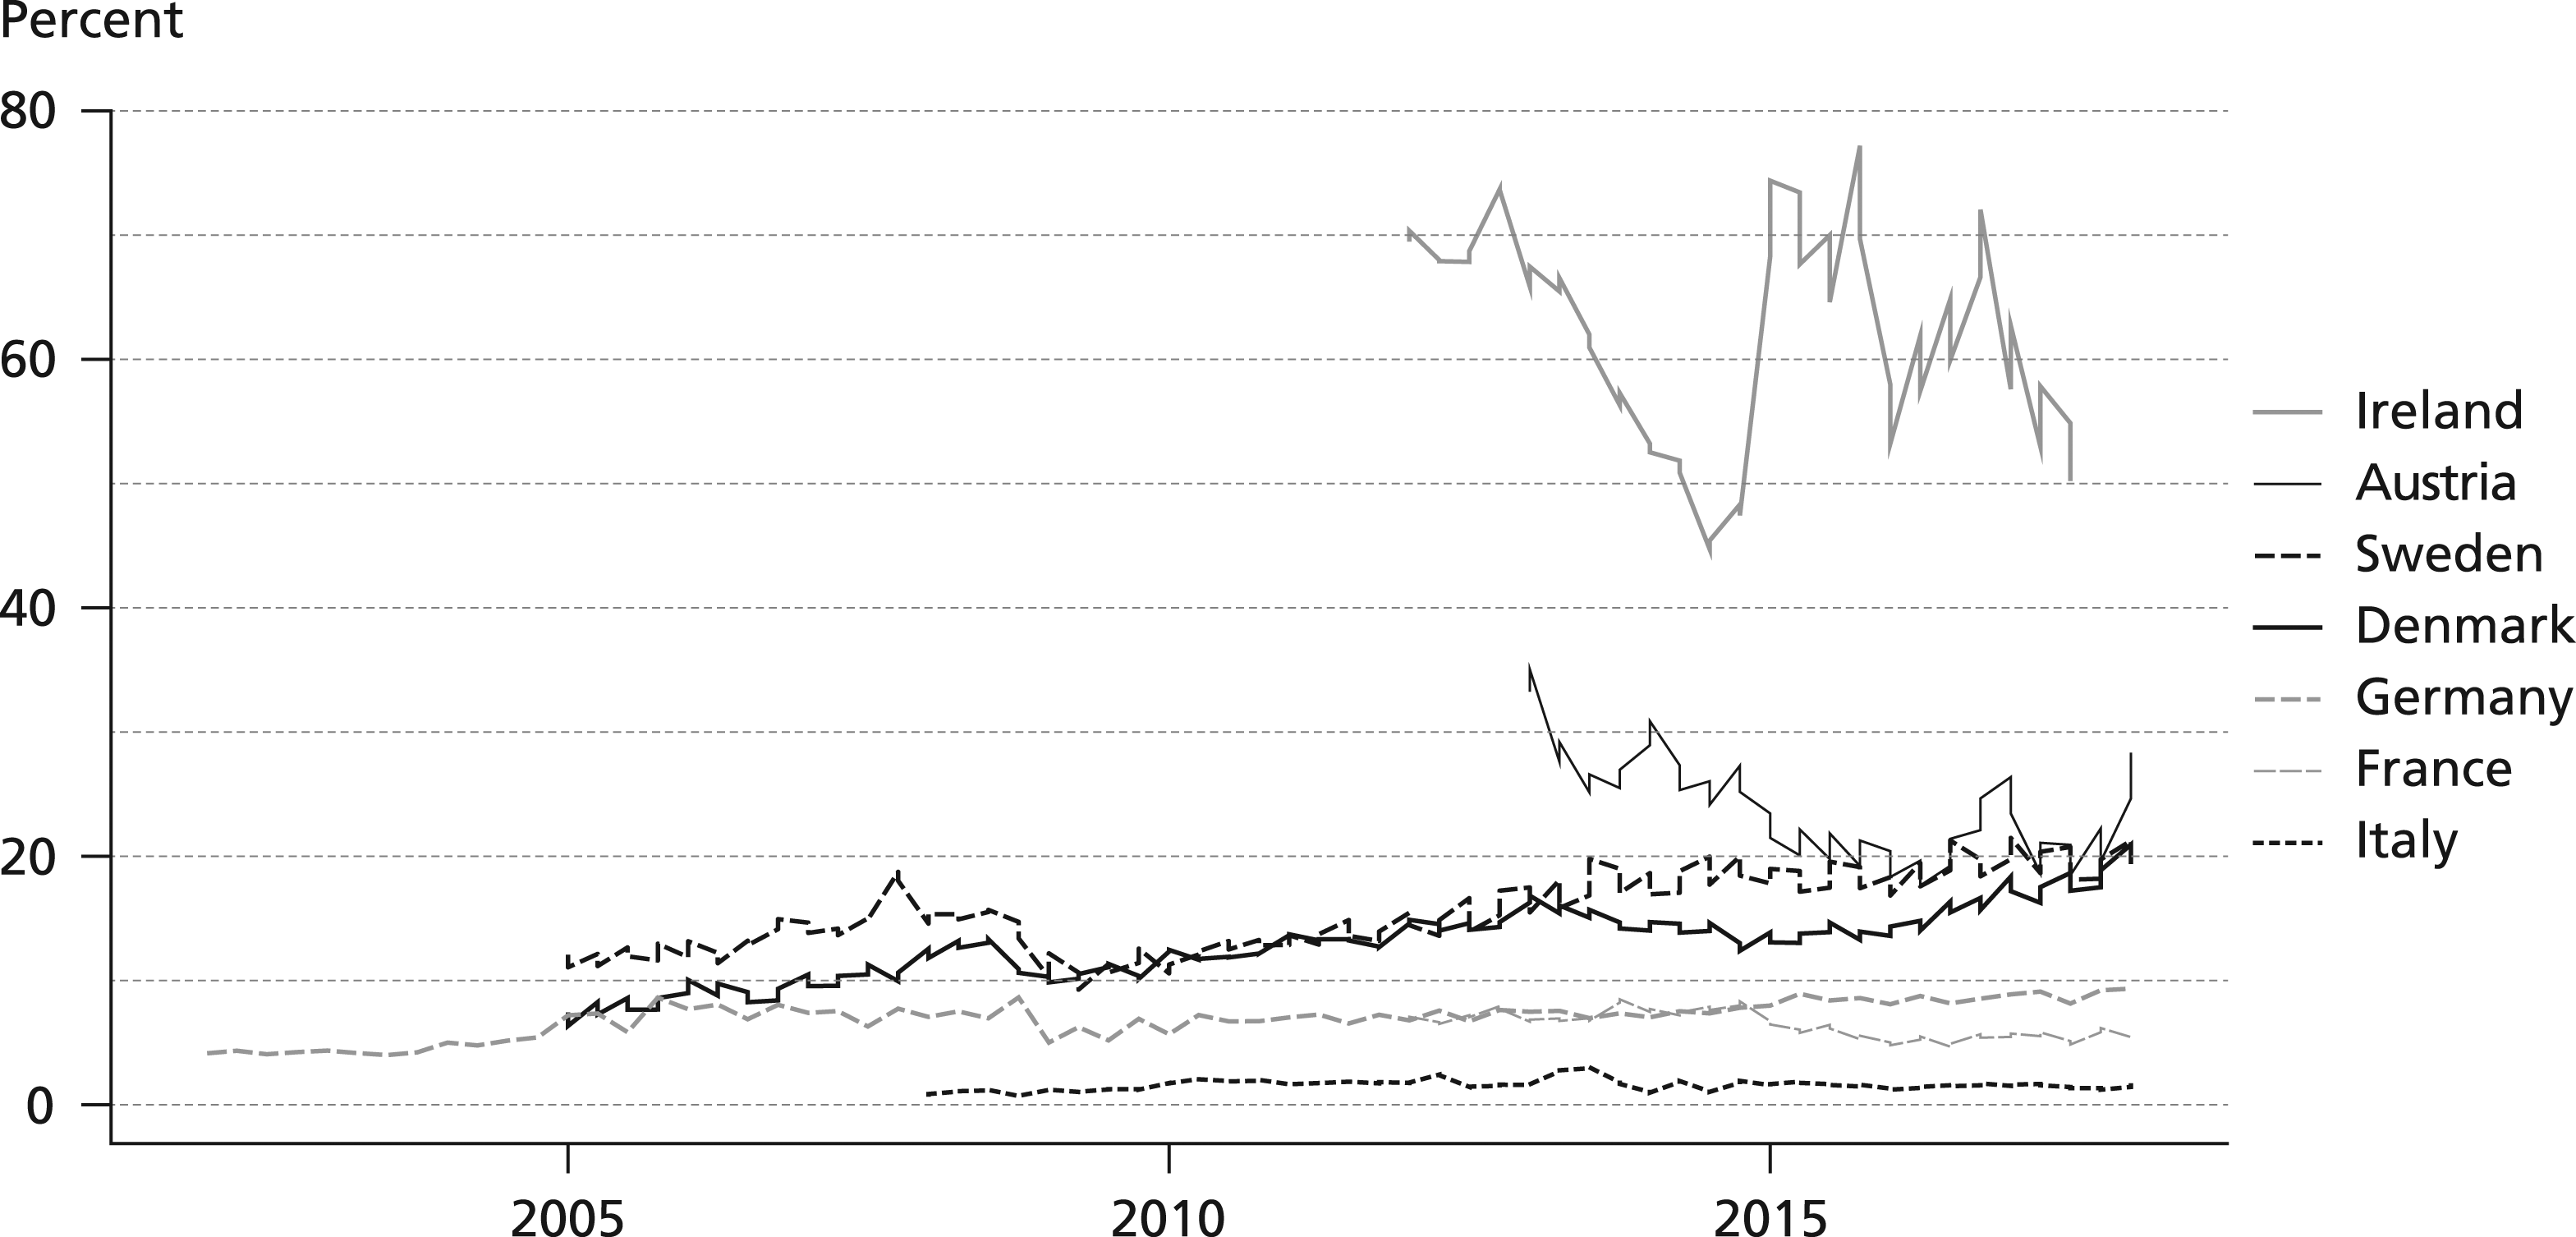
A key data resource to track down the likely economic, organizational, or accounting processes underlying rising merchanting figures are disaggregated figures by firm, trading partner, and industry category. Available Eurostat data generally suggest the strong incidence of very few multinational companies and their specific trading partners and products (Remond-Tiedrez and Rueda-Cantuche, 2019). In many cases, four or five product categories constitute up to 80% of a country’s total merchanting exports, and single industries up to 20%. In addition, merchanting exports are highly clustered in terms of trading partners. For Sweden, merchanting can only be split up by broad trading regions, which reveals that merchanting is pervasive for both intra- and extra-EU trade and differs from the pattern of typical industrial economies such as Germany where merchanting is driven by extra-EU world trade (see Figure 3). Net merchanting exports in Denmark, Germany, and Sweden by trading partner, 2000–2020. Source: Eurostat.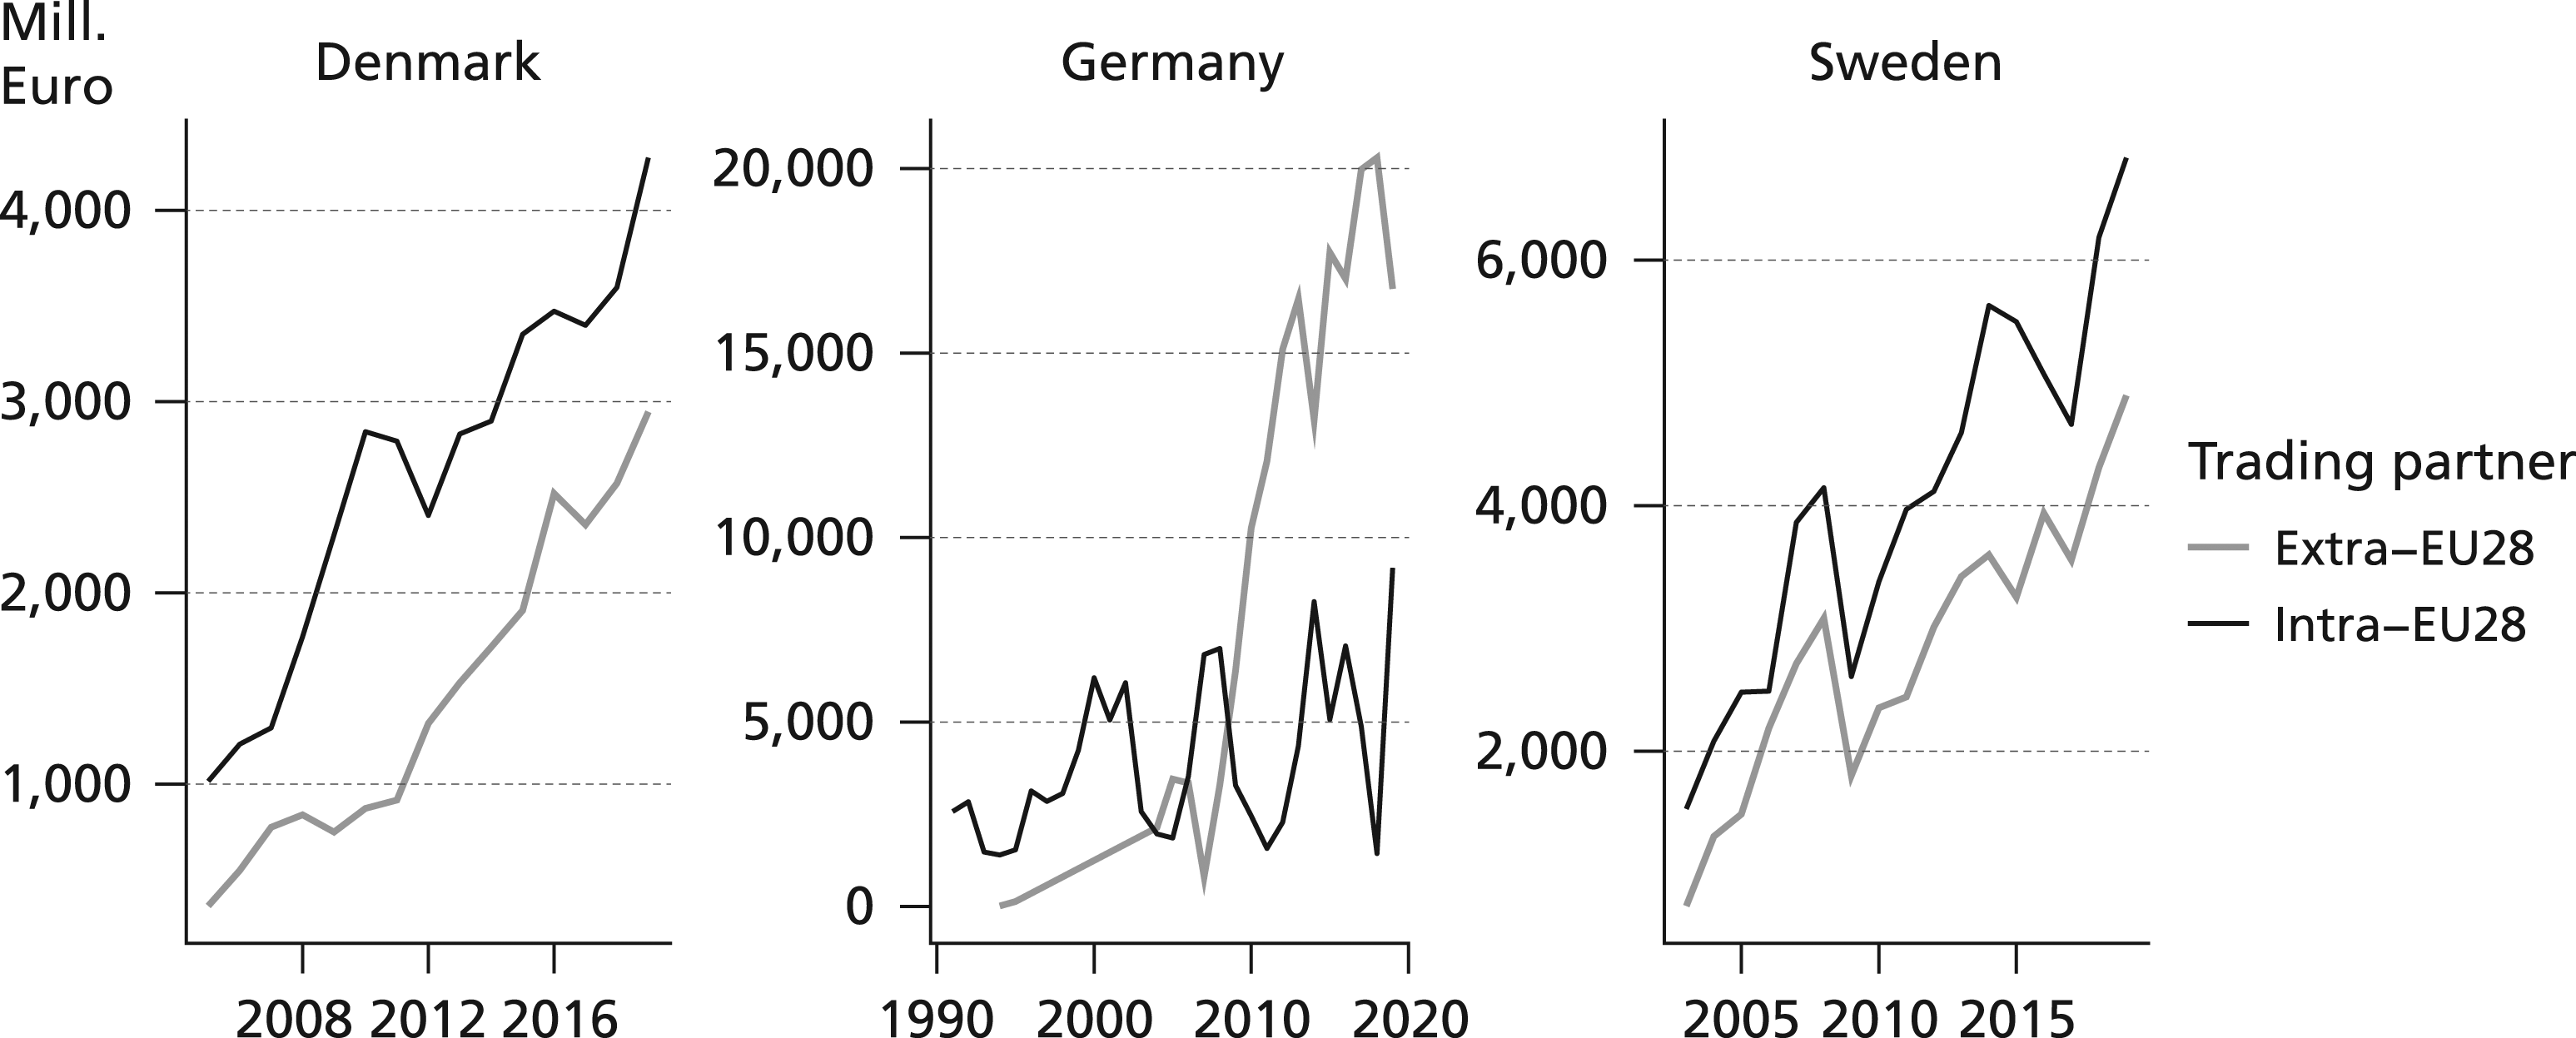
Swedish merchanting data itself is unfortunately not publicly available by further sub-categories. However, country experts have attributed Swedish merchanting growth to two particularities of Swedish multinationals. First, many traditionally Swedish MNEs still have their headquarters in Sweden, where old industrial capital foundations maintain strong minority-ownership control. Ownership structure and residence tendencies have been treated as important explanatory factors for the high Swedish merchanting levels cross-sectionally (Henrekson and Öhrn, 2011). Second, Sweden has seen a particularly deep process of deindustrialization since the 1970s. Especially in comparison to Germany, the decline of Swedish manufacturing employment has been very pronounced. Extensive outsourcing and the organization of value chains along the lines of merchanting transactions would help to explain the constant rise of “exotic” exports.
The comparison to Germany is particularly instructive. German producers have often moved increasing shares of value creation overseas but have retained finishing functions in global value chains, clearly visible in large intermediate goods imports and finished goods exports (Aichele et al., 2013). Such behaviors would be consistent with a comparative Swedish surplus in merchanting and higher “real goods” exports in Germany, as only in the latter case do goods tend to cross the country’s territory.
Cursory case studies have called Sweden’s increasingly prominent model of manufacturing “research-based production,” in which the “physical transformation of the ‘hardware’ is fully outsourced,” but Swedish headquarters engage in design, research and development, and other service-like activities (UNECE, 2015: 16–17). On that basis, transactions recorded as merchanting exports have been described as consisting of the “redistribution” of gross profits “to be used for funding future research” in Sweden (UNECE, 2015: 17). Even if we conceive of net merchanting receipts as headquarters extracting resources from global value chains like many recent reports do (Bo et al., 2018), a straightforward interpretation of merchanting exports as repatriation flows would be difficult. Merchanting incomes need not be transferred to the registering economy to be recorded as “exports” and empirical studies show that merchanting entities regularly keep their earnings abroad (Beusch et al., 2017).
If it is true that Swedish merchanting exports are at their core redistribution and repatriation devices by outsourcing multinationals, the important follow-up question is why Swedish multinationals would systematically use this channel to organize intrafirm transactions, instead of other channels like dividend payments, royalties, or licensing fees. Simple comparisons of Swedish and German registrations of dividend payments do not immediately point to a trivial substitutability between the two channels. While the merchanting channel has the feature that income is not taxed overseas but in Sweden, comparisons of the tax treatment of such proceeds between major countries does not suggest a specifically Swedish strategy of tax avoidance (Fard et al., 2017: 8–9). Given that contemporary MNEs generally seem to be able to shift earnings to extremely low tax locations at will (Zucman, 2014), the purposeful design of MNEs’ transactions towards Swedish tax incidence seems unlikely—or at least in need of further elaboration.
An unsatisfying but likely explanation of the proliferation of what Swedish accounting professionals call “principal structures” in Sweden’s MNEs is that there are no hard economic or institutional causes of these practices. They may well be idiosyncratic conventional practices for organizing the allocation of resources in firms’ internal structures (Fard et al., 2017). The fact that, compared to those of other countries, Swedish corporations do not let their international subsidiaries engage with one another but have them interact through billings to the Swedish parent may simply be a conventional way to organize global production chains. In support of this claim, the Swedish central bank has estimated that “[ten] or so large multinational enterprises are responsible for almost 90 [percent] of the trade margin,” wherein some recorded margins are as high as 100% (ibid., 7). If such descriptions are accurate, a considerable part of the Swedish current account surplus would be unrelated to factors usually looked at in CPE to explain the trajectories of national economies.
The decreasing value of derived indicators
The complications added to the interpretation of accounting categories can pose follow-up problems for derivative indicators and theories. This is especially true for the category of merchanting exports. As mentioned above, a core claim in CPE is that a “high road” of national specialization exists that allows countries to escape the trade-off between wage growth and competitiveness. The growth model literature tries to capture this aspect empirically by comparing the price sensitivity of exports between countries to measure degrees of continued “quality production” (Baccaro and Pontusson, 2016).
Under conditions of today’s extreme globalization of production, one should expect a general decoupling of exports from countries’ price levels (Ahmed Hannan et al., 2015; Hope and Soskice, 2016). Large volumes of plain re-exports and goods imported for processing and further export have lowered the sensitivity of exports to changes in traditional indicators of competitiveness by over half (Ahmed Hannan et al., 2015). This is especially true for countries like Sweden and Germany, but for slightly different reasons. Plain re-exports today dominate some of Sweden’s traditional major export industries. Re-exports make up around two thirds of Sweden’s textile exports and almost all of its exports of mobile phones (Camacho and Lindstrom, 2021). Germany, in turn, has seen massive relocations of intermediate goods production to Eastern Europe and East Asia, which are then often finished into “German exports” (Aichele et al., 2013). While most of these flows are captured in more recent value-added computations of international trade in one way or another (OECD-WTO, 2015), goods sent abroad for processing without changing ownership may only appear in Germany’s services balance, where foreign suppliers’ charges are recorded. 2
The decoupling of exports from traditional measures of competitiveness is even more pronounced for merchanting exports. As the goods under merchanting never cross the merchanting country’s borders, rising merchanting exports decouple a part of net exports from the logic of cost competition. What is more, should intragroup trade play a significant role in Sweden’s merchanting figures, one would have to take into account that transfer pricing in MNEs in practice follows fundamentally different rules than pricing in markets (e.g., Ronen and McKinney, 1970; Holmstrom and Tirole, 1991; Bernard et al., 2006). Within the fluid limits of transfer pricing regulatory enforcement, prices might be set to discipline or control various parts of a multinational enterprise, implement business strategies, or avoid taxation.
More detailed merchanting data are hard to come by, but the IMF covered at least partially some of the countries of interest in the discussion. Data are even available on the quarterly level, which increases case numbers and the sensitivity of measures. Figure 4 thus relates Germany’s (1991–2005), Italy’s (2008–2017), and Sweden’s (2002–2005) quarterly changes in net merchanting exports to quarterly changes in real exchange rates (with forty-two trading partners). It generally supports the intuition that there is no systematic relationship between the two measures. Log changes in net merchanting exports and real effect exchange rates, 1996–2018. Note: Quarterly data, unbalanced panel. Source: IMF (balance of payments and CPI); Darvas (2012).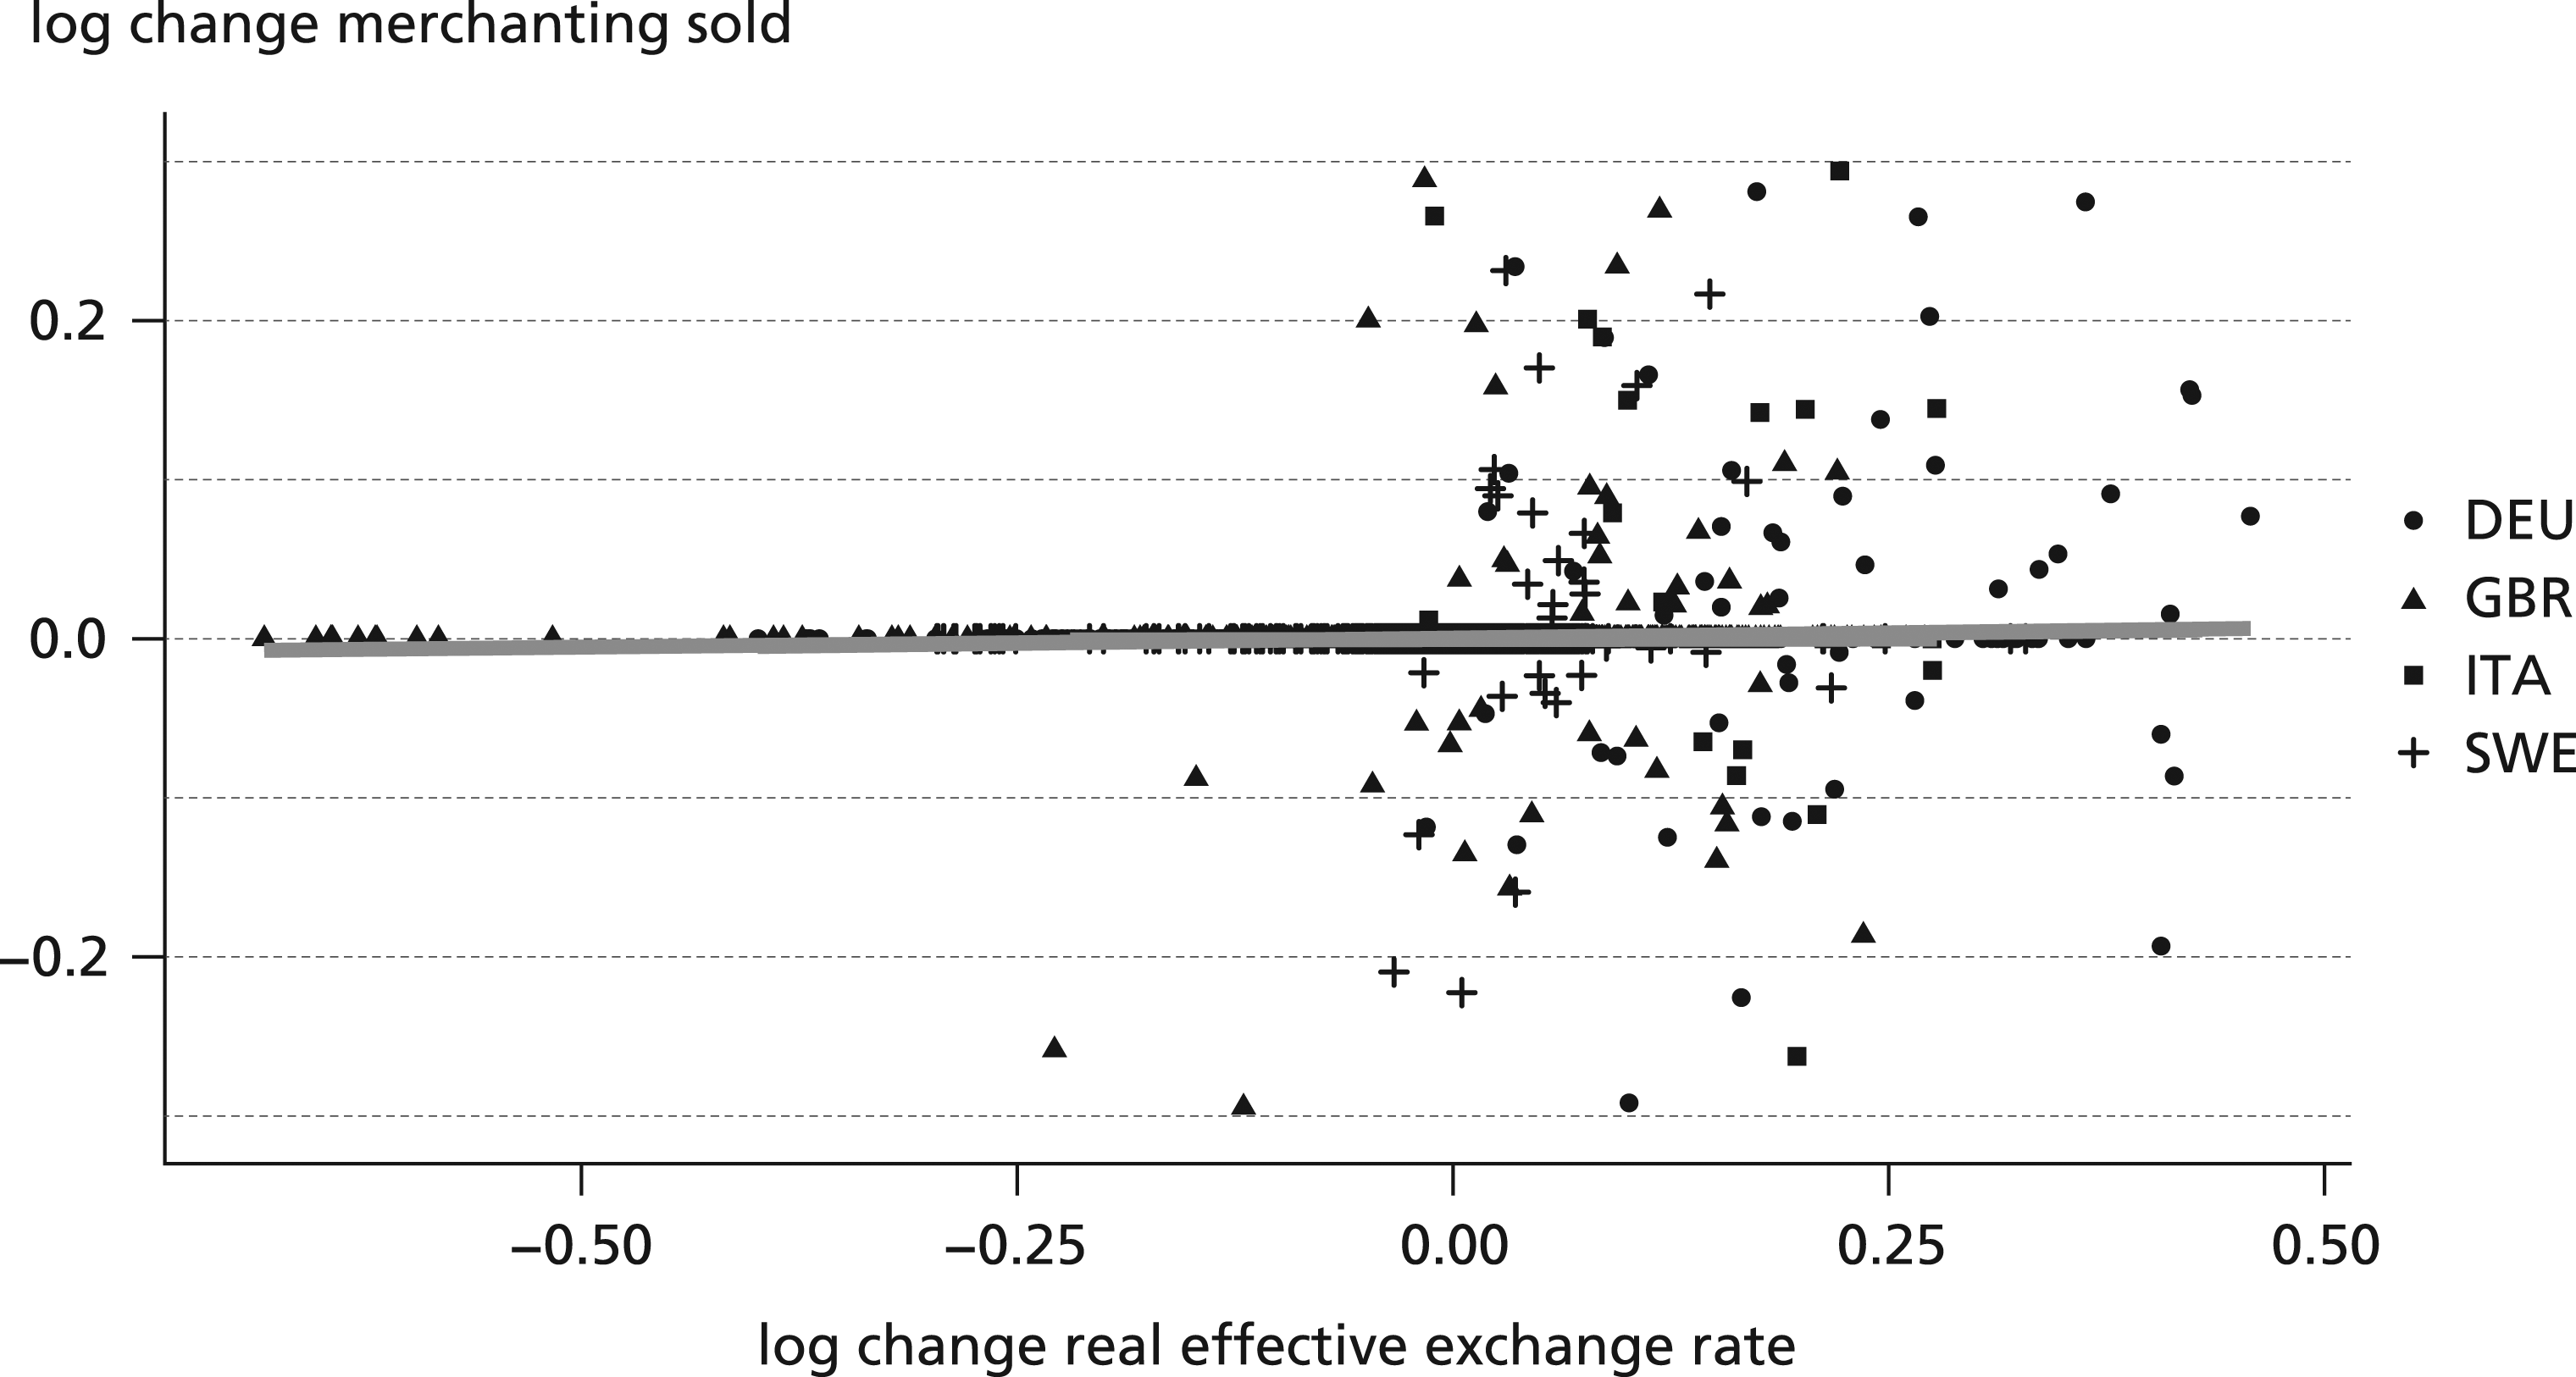
The insights gained from decomposing Sweden’s export renewal should not necessarily be understood as a fundamentally competing argument to the characterization of Sweden in the growth model literature. Capabilities of Swedish entities to extract large amounts of resources from—intra- or interfirm—global value chains may be one variety of postfordist restructuring underlying the macroeconomic trends highlighted by Baccaro and Pontusson (2016). However, our description of Swedish indicator complications should caution against descriptions of countries’ trajectories without accompanying analyses of global value chains and multinationals’ organizational networks. Overall, the growth of merchanting in the Swedish balance of payments data implies uncomfortably high levels of uncertainty when it comes to questions of how Sweden’s economy has fared over the last 30 years.
Not so financialized after all? Firm financialization in France
The concept of financialization is widely used in comparative political economy. It refers to the growth of the financial sector and to the other institutional sectors—households, non-financial firms, and governments—becoming more entangled with financial markets. Whereas the GDP or profit share of the financial sector is easily measured, quantifying the financial exposures of various actors can pose a challenge. The task is most complex for non-financial firms, especially for multinational ones, whose organizational and financial structures tend to be far more complex than those of households or governments. This makes it difficult to measure how firms’ financial exposures, both as creditors and as debtors, contribute to their incomes, expenses, and, crucially, profits.
The purpose of this section is not to critique the concept of financialization (Christophers, 2013). Rather, we will show that specific empirical claims about the financialization of non-financial firms (NFCs), which have come to be treated as stylized facts (Krippner, 2005; Stockhammer, 2008), rest on shaky statistical foundations. Scholars have used two sets of indicators to measure the financialization of non-financial corporations—the degree to which firm behavior is oriented towards investors (primarily the firm’s shareholders), and the degree to which firms themselves operate in financial markets (making financial investments and incurring financial liabilities). The former—shareholder value orientation—is commonly measured via a firm’s payouts to shareholders. These payouts take the form of dividends or share buybacks, which pose few measurement problems (Lazonick, 2014; Palladino, 2020). The second set of indicators is based on firms’ balance sheets and income streams. Following Greta Krippner (2005), a higher share of financial assets in total NFC assets and a higher share of financial income in total NFC income have been widely used as indicators of financialization. This latter approach is more empirically challenging, especially because sprawling corporate structures have made the corporate balance sheet data much more difficult to aggregate and interpret. Nevertheless, we will show that a careful parsing of the available data does reveal a clear picture, and that this picture does not support claims that NFC profits have become more reliant on financial activities.
For comparative political economists, much depends on accurate measures of financialization. Krippner’s (2005) indicators—NFC financial assets and NFC financial income—have been used in a large number of quantitative studies on the link between financialization and various macroeconomic outcomes. In particular, this literature has established that NFCs’ financial income (Stockhammer, 2004; Orhangazi, 2008; Lin and Tomaskovic-Devey, 2013; Tori and Onaran, 2018) or financial asset holdings (Tomaskovic-Devey et al., 2015; Tori and Onaran, 2020) correlate with lower investment and/or lower wages. 3 More recently, however, the data used in several contributions to this literature has been challenged. In particular, Davis (2016), Fiebiger (2016), Rabinovich (2019), and Soener (2020) have used both aggregate and firm-level data to present a much more nuanced analysis of NFC assets and income sources. 4 The upshot from these critical empirical interventions is that previous work in the field has exaggerated the degree of NFC financialization primarily for two reasons. The first reason is that national accounts misleadingly treat FDI and—in the case of the US, intangible assets—as financial assets; the second is the focus on gross financial income (which grew rapidly in the high-interest rate 1980s and 1990s) rather than net financial profits. A naive reading of corporate balance sheet data therefore tends to overstate the degree to which NFC profits depend on purely financial activities.
These points have been established for the mothership of corporate financialization, the United States, which in the following serves as a reference case, akin to Germany in the previous section. The main focus of our analysis will be on France, which can be seen as a second-most unlikely case. Students of French capitalism have long emphasized the highly financialized nature of (large) French firms, albeit mostly through the lens of the corporate governance (Morin, 2000; O'Sullivan, 2007; Johal and Leaver, 2007; Goyer, 2011). More recently, Alvarez (2015), using Krippner’s indicators, has highlighted a seemingly dramatic increase in NFC financialization in France and reproduced Lin and Tomaskovic-Devey’s (2015) much-cited result of a statistically significant, positive correlation between NFC financialization and income inequality. In the remainder of this section, the study by Alvarez serves as our main point of comparison.
Disaggregating financial assets: Components, valuation, concentration
The literature on NFCs often treats the share of financial assets/income in total assets/income as indicators of financialization (Krippner, 2005; Tomaskovic-Devey et al., 2015). The problem with this approach is not with the indicator as such, but with how it has been operationalized and measured. First, “financial assets” in the national accounts is too broad a category. Not all of its components are equally “financial,” as illustrated, above all, by FDI. Second, the literature does not distinguish between the acquisition of new financial assets and the increase in existing stocks of financial assets through valuation effects. Third, aggregate data on the corporate sector as a whole obscure that holdings of financial assets (narrowly defined) are extremely concentrated among the largest firms. We will address each of these measurement problems in turn.
Components: FDI is key
The aggregate category of “financial assets,” as used in national accounting, is too broad to measure the degree to which firms rely on financial investments to generate income. The financial accounts contain data on the aggregate financial balance sheets of institutional sectors, including those of non-financial corporations.
5
Figure 5 reproduces the time series shown in Figures 1 and 2 in Alvarez. It shows the growth of French NFCs’ financial assets, as well as the main components within that category, since 1978. The major change occurred during the two decades between 1980 and the bursting of the dotcom bubble in 2001, when financial assets (expressed as a share of total assets) doubled, from just below 35% to 65%. Although the trend has been flat since then, recent years have seen a notable increase back to 65%. This trend is similar to the one observed for the United States, where the same indicator, over the same time period, doubled from 14% to 27% (Tomaskovic-Devey et al., 2015: 528). Financial assets held by French non-financial corporations as a share of total NFC assets, 1978–2019. Source: Eurostat (NFC financial assets), OECD (NFC total assets), pre-1995 data from Alvarez (2015).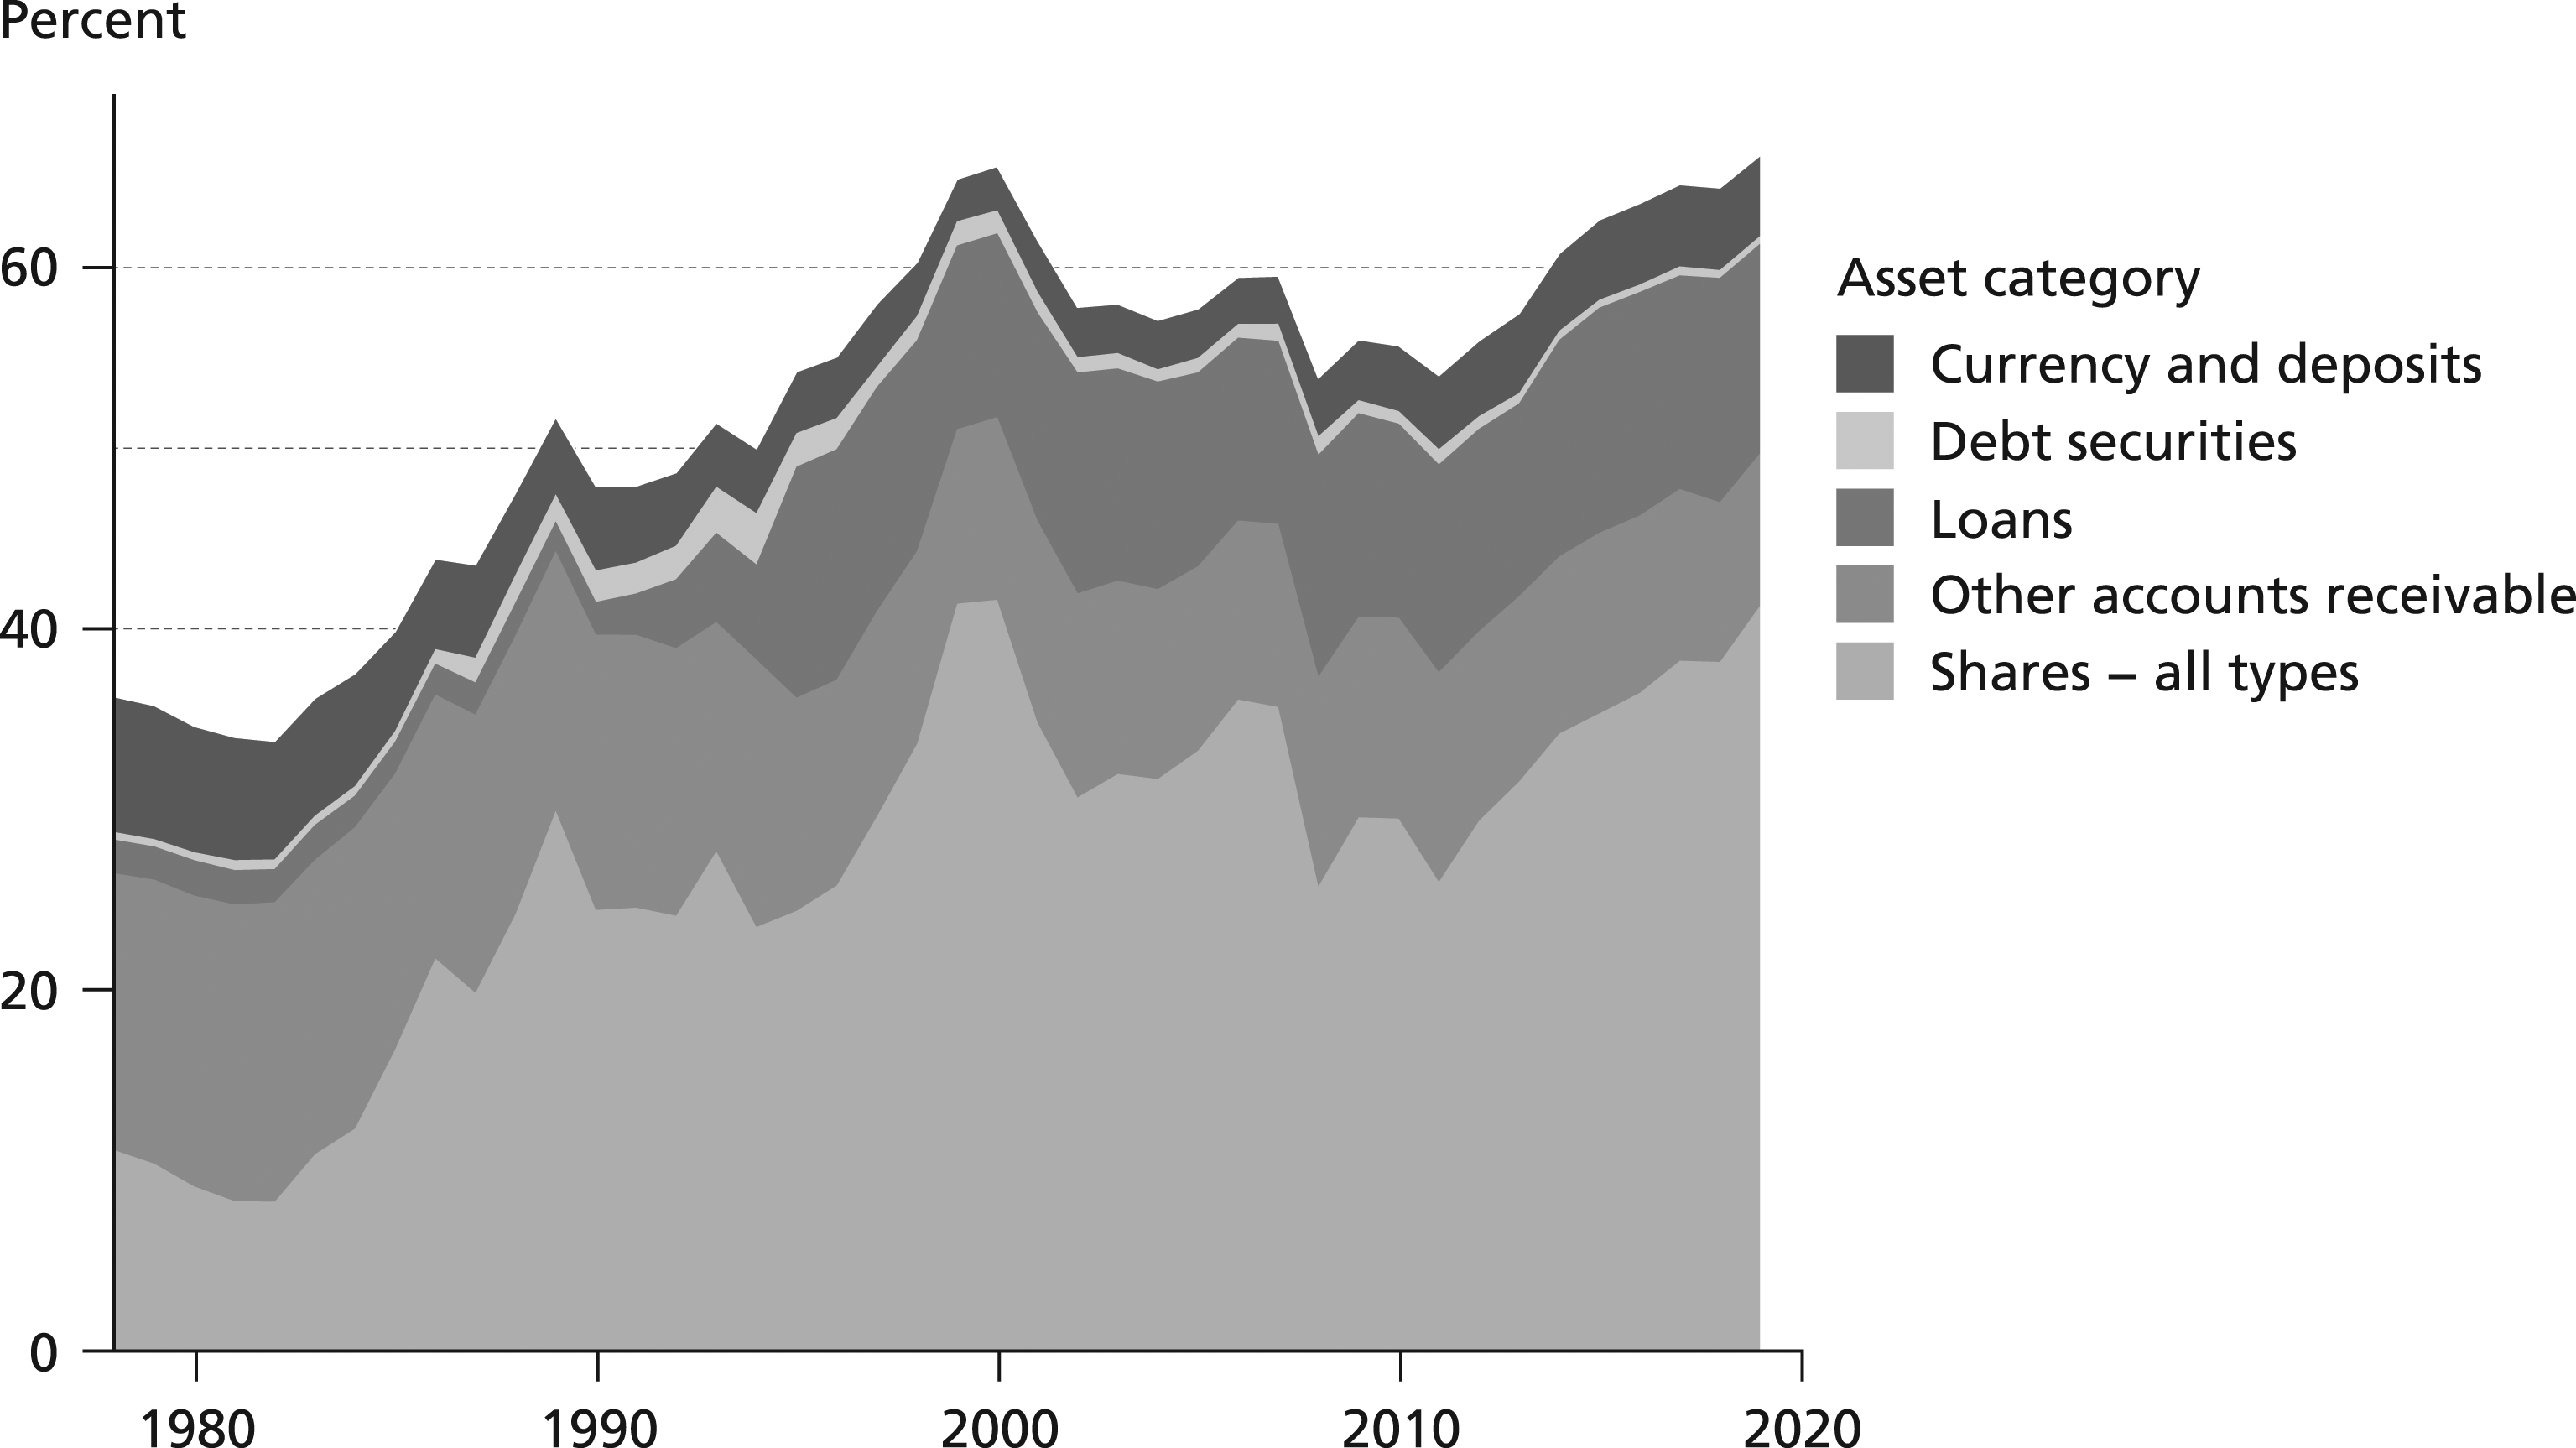
What drove this expansion of financial assets held by NFCs? Based on the data shown in Figure 5, Alvarez (2015: 453) has pointed to the categories of shares and loans as evidence of French firms’ increased financial investments. However, this interpretation of the data is problematic. As Fiebiger (2016) and Rabinovich (2019) have argued, national accounts data on financial asset holdings include FDI, which generally reflects controlling stakes in foreign subsidiaries or affiliates, rather than speculative portfolio investment.
In national accounts data, FDI is hidden in the categories “unlisted shares” and “loans.” Figure 6 therefore disaggregates the category “shares” into its three components under ESA95: listed shares, unlisted shares, and other equity. This disaggregated view shows that the two surges in shares held by NFCs—one during the late 1990s and one since 2011 (pre-1995 data is extrapolated for readability but carries no information)—have been driven by unlisted shares. Unlisted shares have been deemed “especially significant for French financial accounts” (Durant, 2005) and today account for half of French NFCs’ financial assets. Figure 6 also shows the stock of French outward FDI, which surged in the late 1990s, clearly driving the growth of NFCs’ unlisted shares during that period, and thus of NFCs’ overall financial assets. Financial assets held by French non-financial corporations as a share of total NFC assets; stock of French outward FDI as a share of NFCs’ total financial assets, 1978–2019. Note: Pre-1995 data does not differentiate between share types (other equity, listed shares, unlisted shares), which were therefore extrapolated back based on their relative shares in total shares in 1995. Source: Eurostat (NFC financial assets), OECD (NFC total assets), UNCTAD (FDI). Pre-1995 balance sheet data from Alvarez (2015).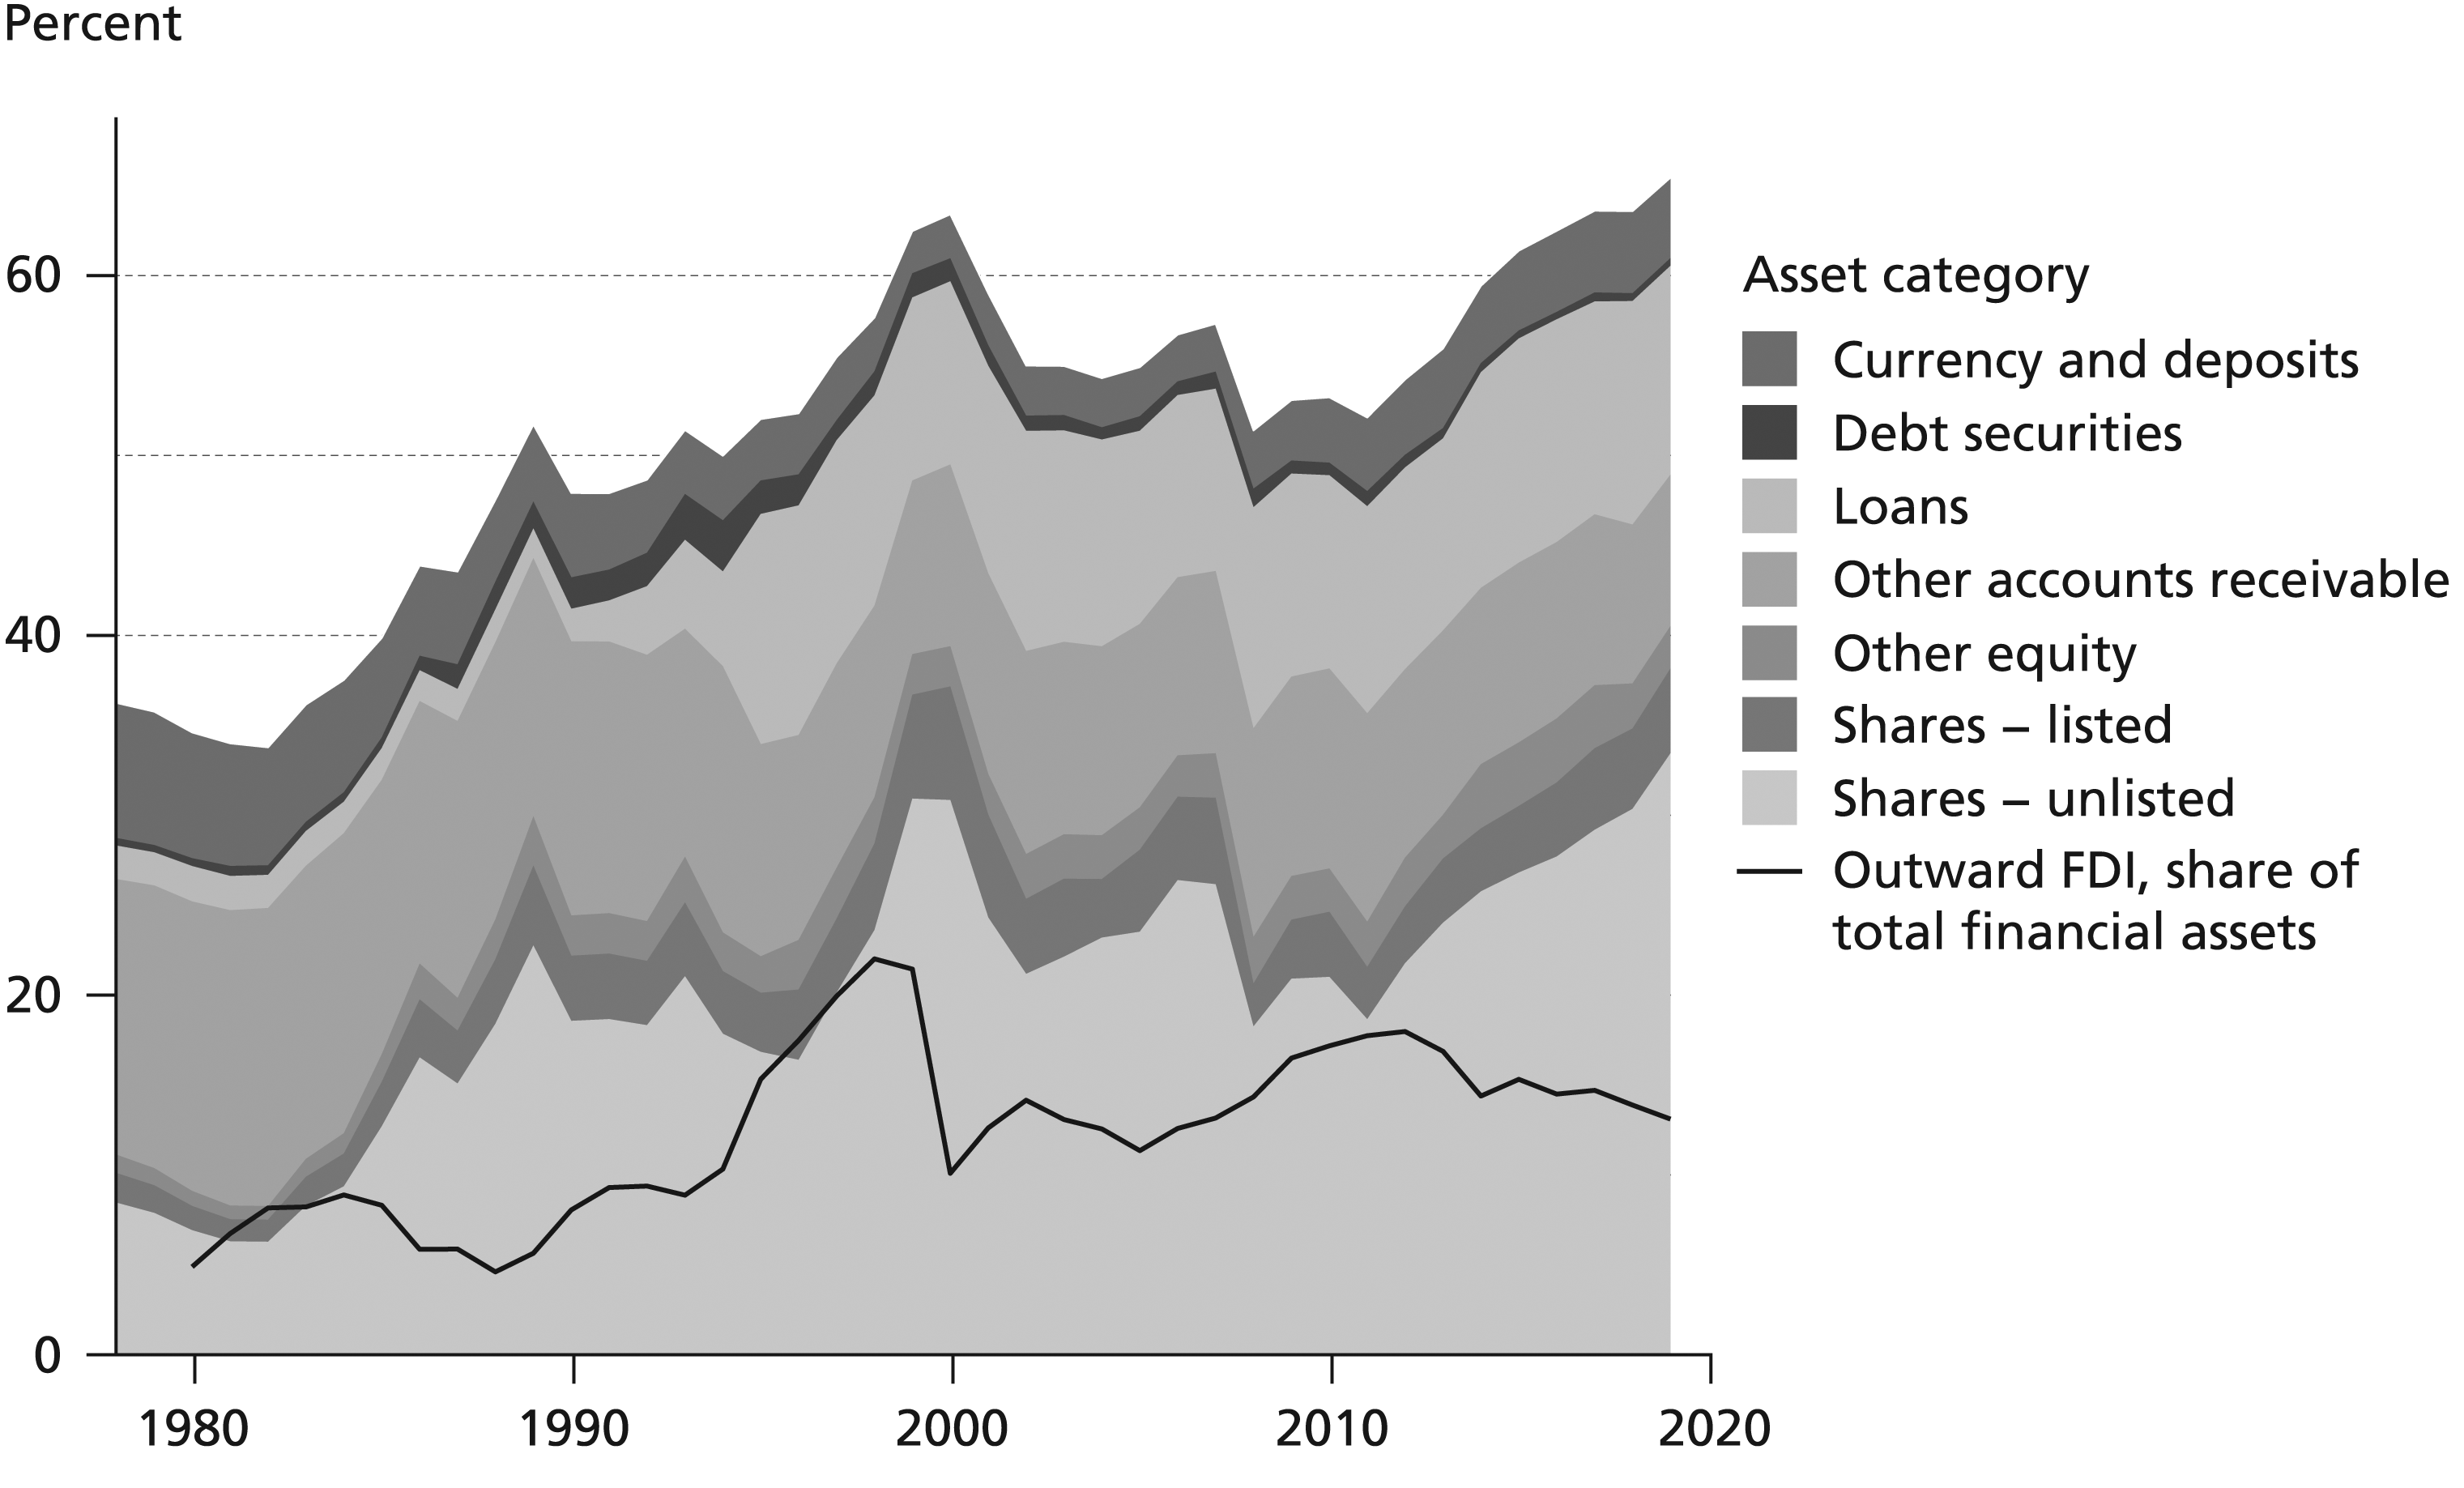
A cross-border investment is classified as FDI if it exceeds 10% “of the ordinary shares or voting power in an incorporated enterprise, or the equivalent for an unincorporated enterprise” (Eurostat, 2013: 102). The FDI category seeks to distinguish investments that firms make in order to exercise control from purely financial “portfolio” investments. While the growth of FDI since the 1980s has been global, and reflects the rise of MNEs, it has been particularly pronounced for France. Alongside their Japanese peers, French NFCs have been world leaders in outward FDI among large rich economies since at least 1980, when the UNCTAD FDI time series begins (Durand and Gueuder, 2018; O'Sullivan, 2007). Since the early 1990s, France’s stock of outward FDI has fluctuated between 50% and 70% of GDP. This growth has been driven by two types of investments. There is genuine long-term investment and lending related to the investing firm’s actual business and globalized value chains (Fiebiger, 2016; De Ville, 2018; Milberg, 2008). On the other hand, there is “phantom investment” in subsidiaries that are often little more than shell companies (Damgaard et al., 2019), distributed across jurisdictions in ways that reflect the “great fragmentation of the firm” rather than the globalization of production (Reurink and Garcia-Bernardo, 2020). The very purpose of phantom FDI is often to turn regular revenue from the sale of non-financial goods and services into pseudo-financial revenue in the form of dividends or interest paid by the subsidiary, with the goal of reducing the overall tax burden at the group level. Although distinguishing between these two types of FDI is important in the context of debates about the validity and interpretation of international economic statistics (Linsi and Mügge, 2019), what matters for the purpose of the present argument is that neither type constitutes a purely financial asset (Rabinovich, 2019: 7; Fiebiger, 2016; Durand and Gueuder, 2018). In a country with large outward FDI stocks, the NFC sector’s financial assets (and income) are therefore overstated by the headline item in the national accounts.
Valuation: The great equities bull market
The second underappreciated reason for changes in financial assets, including unlisted shares, are cumulative revaluation effects. Existing studies of NFC financialization, including Alvarez (2015), overwhelmingly attribute growing financial assets to positive net purchases. In doing so, they ignore the financial transactions account and, especially, the revaluations account, which records, among other things, “market price changes based on unrealized holding gains and losses including write-downs of tradable securities” (OECD, 2017: 147). In other words, the financial assets held by a firm may increase simply because the assets it already holds increase in value. To determine how much of the financial assets held by NFCs at any given point in time can be attributed to net purchases, it is important to deduct cumulative revaluations since the chosen reference date.
Figure 7 shows cumulative revaluations for the main categories of financial assets since 1995. While the valuation of unlisted shares is complex and subject to periodic and significant corrections (Durant, 2005), it generally closely follows that of listed shares, represented by the dotted line in Figure 7. Tracking the threefold increase of listed shares between 1995 and 2019, unlisted shares saw a cumulative revaluation of €2.25 trillion over that period. In other words, 43% of the value of unlisted shares held by French NFCs in 2019 (worth €5.25 trillion) is accounted for by valuation increases since 1995. The picture would look even more dramatic for the period from 1978 (the beginning of Alvarez’s time series) until 1995, when the value of listed shares increased by a factor of more than six. Cumulative revaluations of major components of French NFCs’ financial assets, 1995–2019. Note: The individual bars depict the sum of all previous revaluations. Negative revaluations (in years 2001, 2002, 2008, 2011, and 2019) reduce the height of the bar for that year. Source: Eurostat (revaluation account), St. Louis Fed (listed share prices).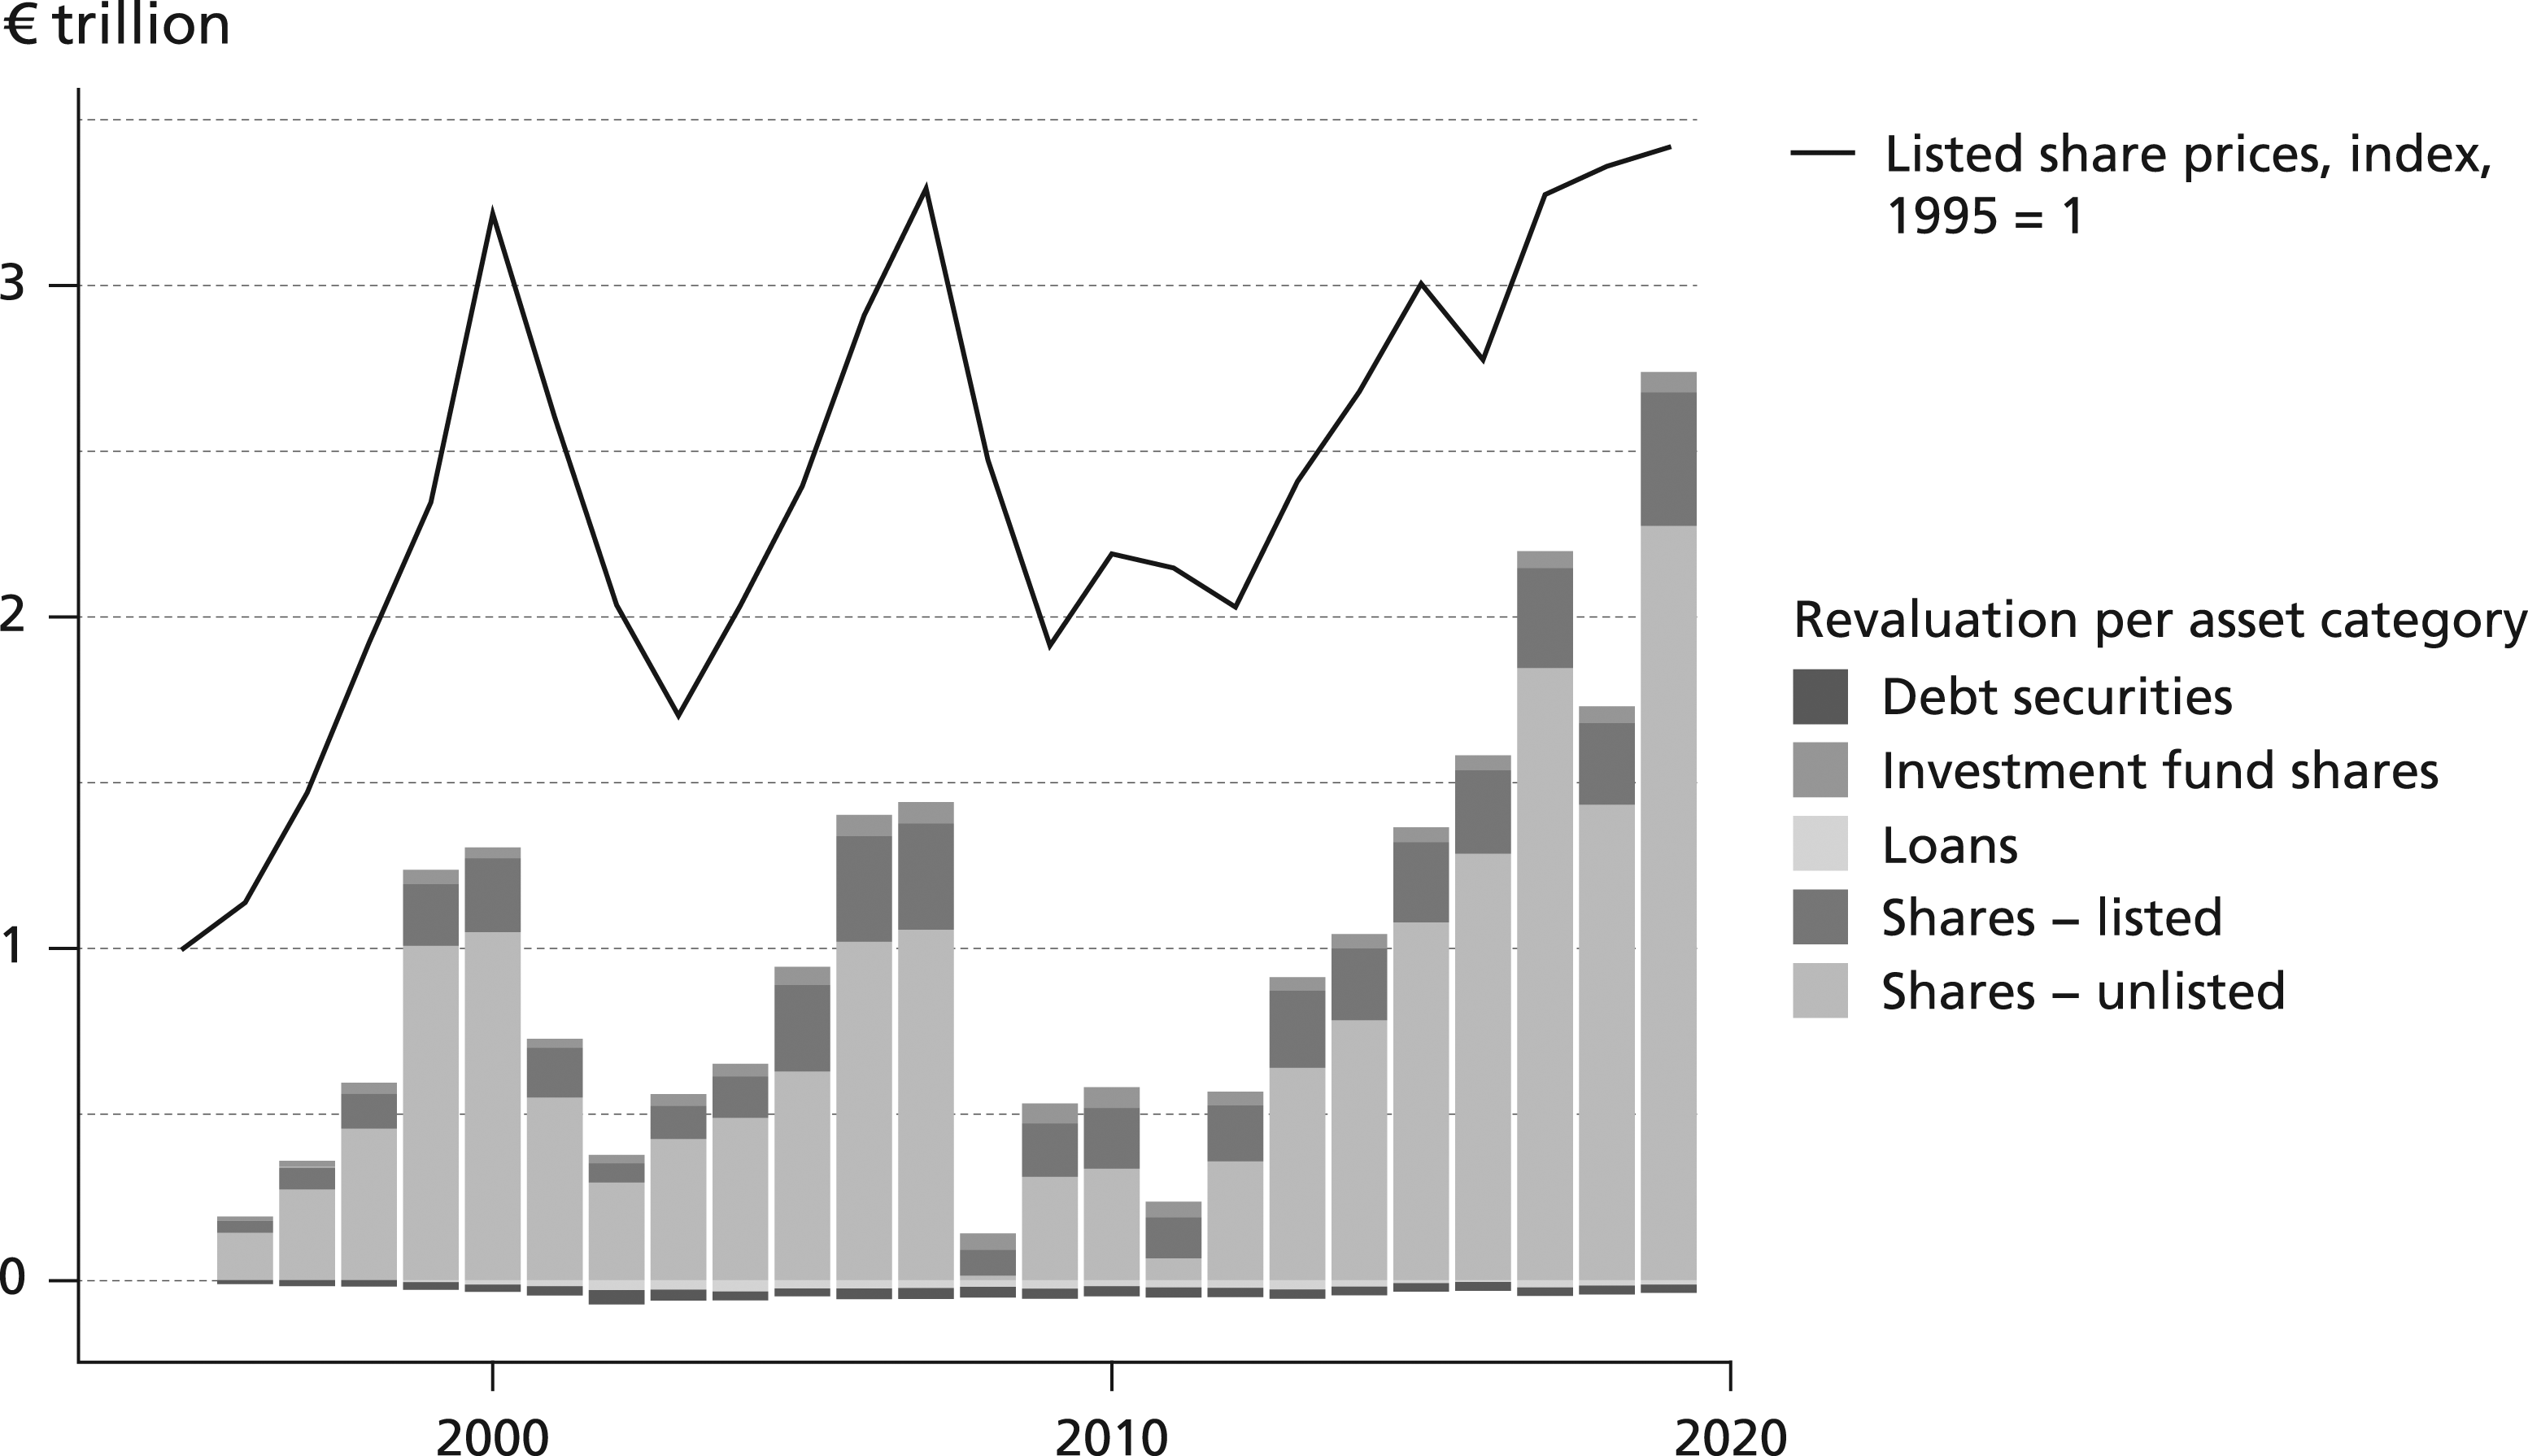
Although this second error has little to do with firm strategy, it distorts not only the empirical measurement of NFC financialization but also its theoretical conceptualization. To see why, note that the period of observation in much of the literature—broadly, the past half century—has coincided with an unprecedented, global explosion in stock market valuations (Kuvshinov and Zimmermann, 2020). In part, these higher valuations of stock corporate shares reflect the power gains of capital vis-à-vis labor as manifest, above all, in a corporate governance regime defined by shareholder primacy (Lazonick and O'Sullivan, 2000). This matters greatly for research designs in CPE—if financial asset holdings of NFCs are, to a significant extent, endogenous to the increased shareholder-orientation of NFCs, then the latter is a much better indicator of financialization than the former.
Concentration: Only large firms invest in long-term financial assets
The third type of mismeasurement arises from the diversity of firms that is not captured by aggregate national accounts data, which does not allow for disaggregation by firm size. Recent work drawing on commercial firm-level data has shown that NFC financialization in the United States is driven by the largest firms (Soener, 2020). Data from individual firms’ financial statements, gathered and recently made publicly available by a network of European central banks, allows us to investigate this question for the French case.
Figure 8 shows three categories of financial assets of French NFCs: cash and bank deposits, long-term financial assets (shares and loans), and short-term financial assets held for trading, each as a share of total assets. For small companies (annual turnover below €10 million), the most important financial asset is cash—hardly an indicator of financialization. Short-term financial assets held for trading are potential indicators of financialization of smaller NFCs but, after a peak around the time of the global financial crisis, have fallen to very low levels. Long-term financial assets also may indicate financialization. This category, which is quantitatively much more significant at 20% of total NFC assets, is overwhelmingly dominated by large companies. As shown in the middle panel, large companies (annual turnover €50 million or more) hold two to three times more long-term assets than their smaller counterparts. (Note, however, that this category includes FDI, which diminishes its value as an indicator of financialization.) Three categories of financial assets as a share of total assets, by size of French NFCs, 2000–2019. Note: “Other financial assets” comprise financial assets, narrowly defined (“held for trading and derivatives”). “Financial fixed assets” comprise long-term, strategic investments, including FDI (“shares in the capital of other entities on a continuing basis, as well as loans made to such entities”). Source: Bank for the Accounts of Companies Harmonized (BACH).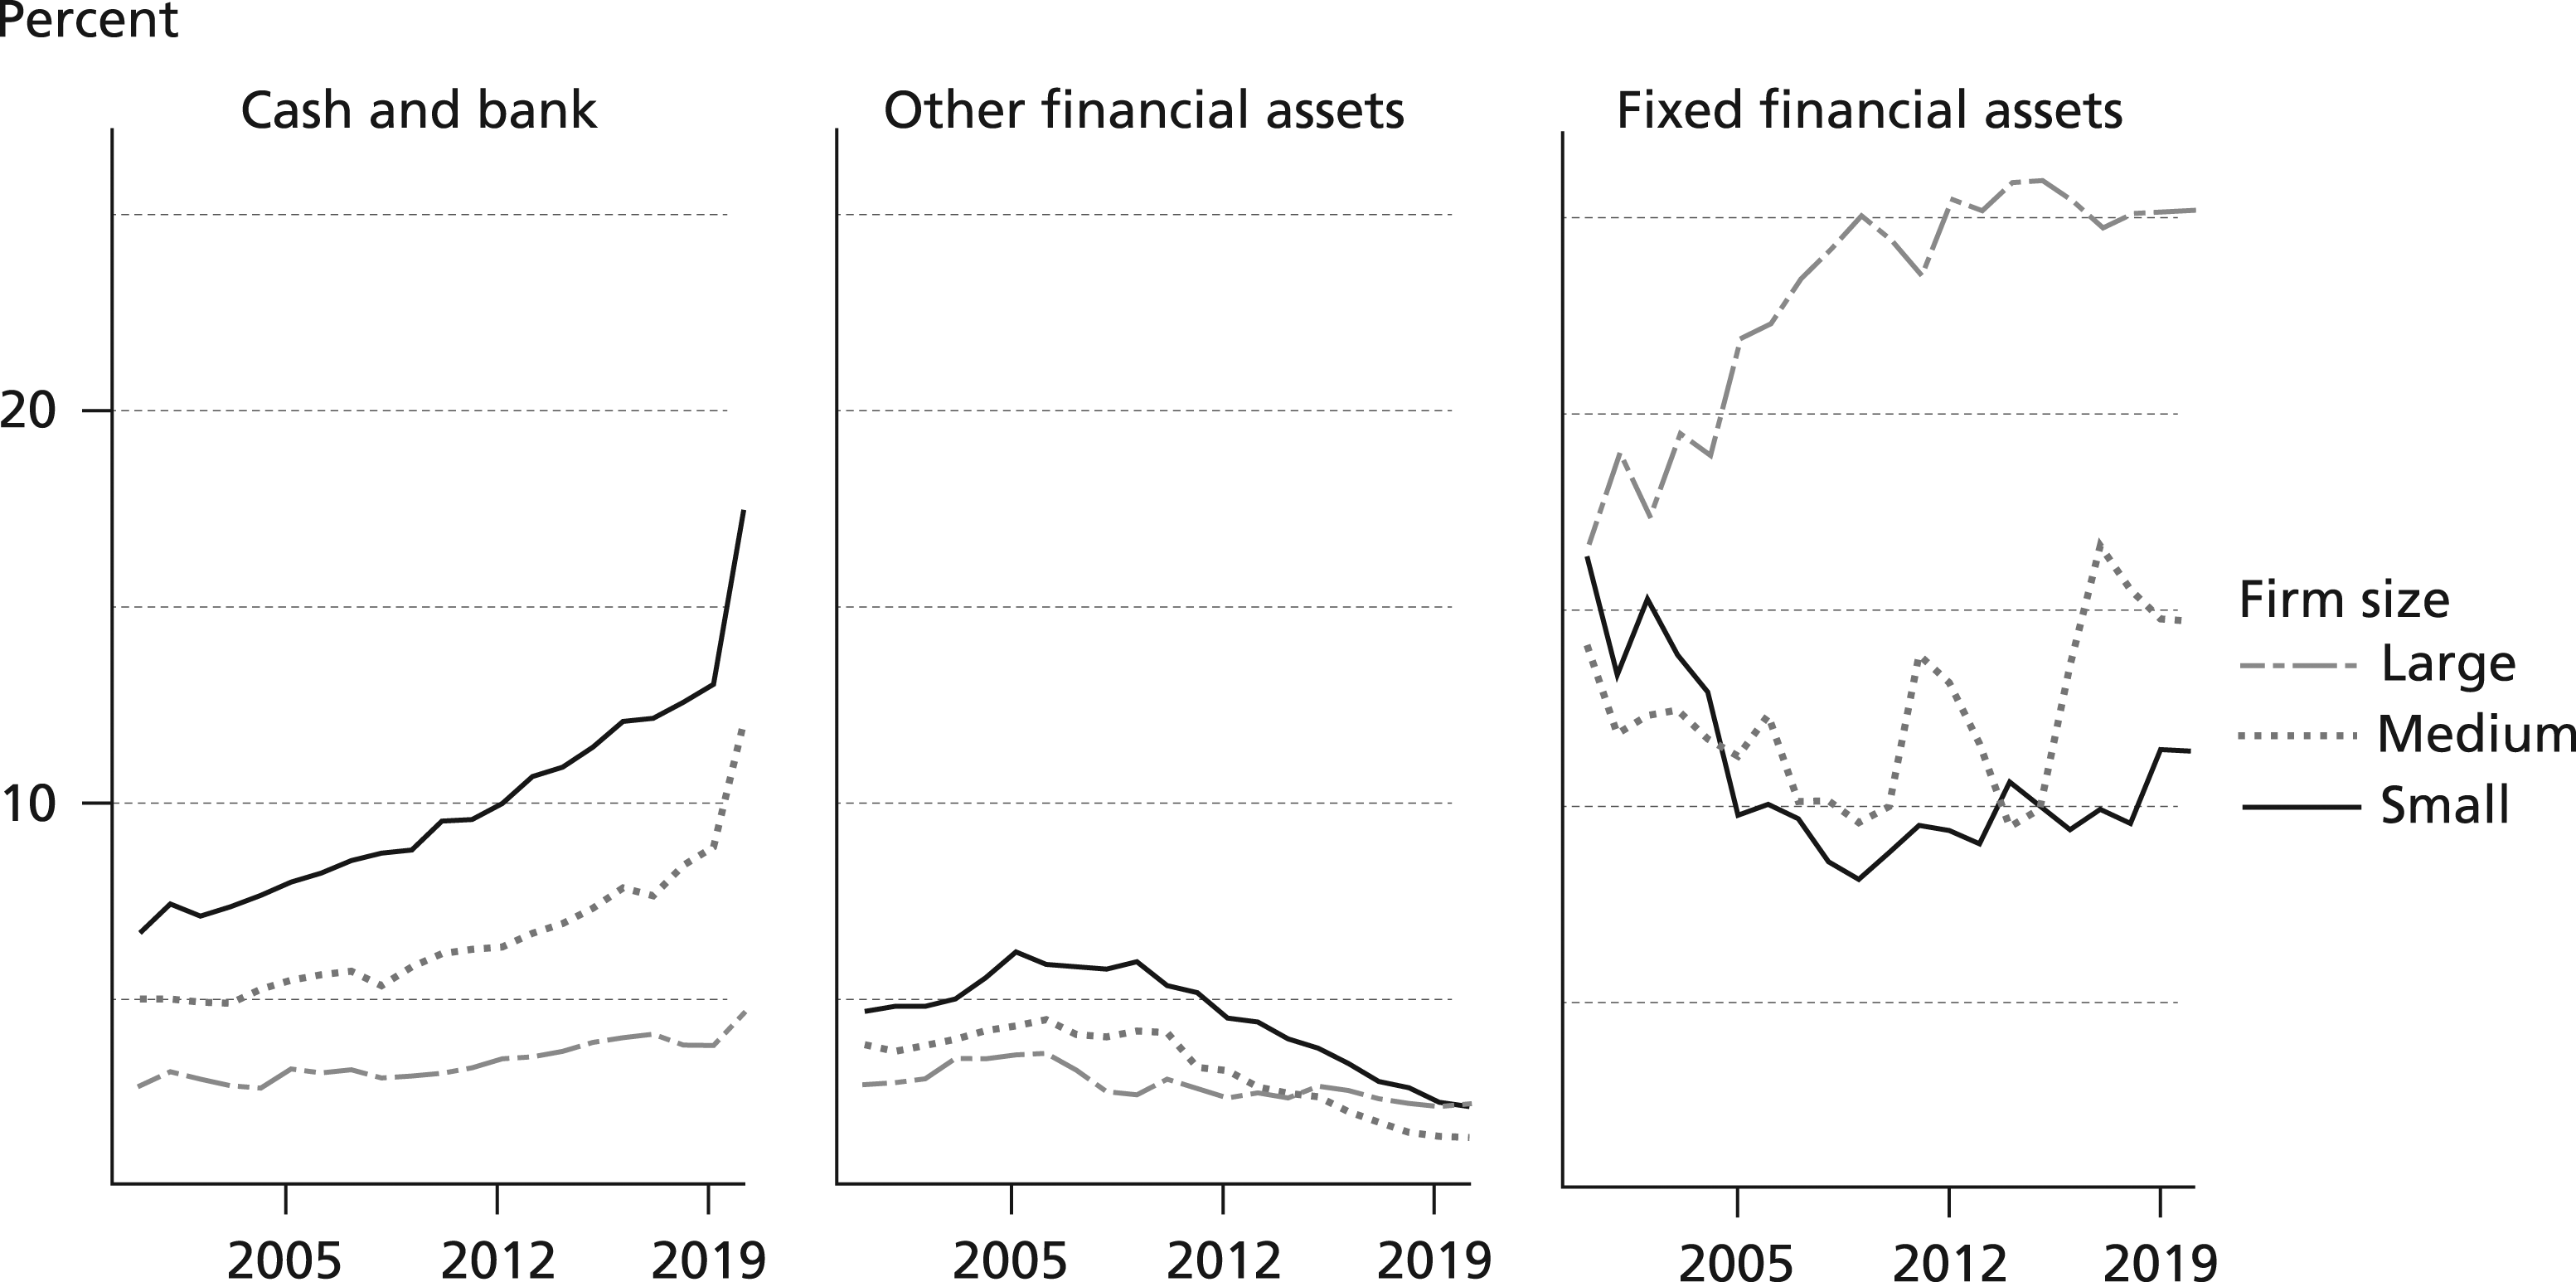
In sum, the growth of FDI (not a financial asset in the strict sense of the term) and the cumulative revaluation of unlisted shares (not the result of deliberate actions taken by NFCs) account for a large share of the increase in financial assets held by French NFCs since the late 1970s. In addition, disaggregated data for the period since 2000 suggests that much of the accumulation of long-term financial assets—as opposed to cash—has been concentrated among the largest companies. Thus, correcting for these three measurement errors fundamentally challenges the notion, widespread in the CPE literature, that NFCs in general, and French NFCs in particular, have increased their financial asset holdings in ways that can be interpreted in terms of financialization.
Financial income: From gross to net
Besides the stock of financial assets held by NFCs, the second widely used indicator of NFC financialization is financial income flows. While the problems afflicting stock measures also, by implication, afflict flow measures, the latter suffer from an additional problem. As argued by Rabinovich (2019), Greta Krippner’s analysis focused only on firms’ gross financial income (interest and dividends received), disregarding firms’ financial costs (interest and dividends paid). In other words, the focus on financial income and assets obscured that NFCs financed the acquisition of those assets by accumulating costly financial liabilities. In reality, US firms consistently lost money on their financial activities, paying more in interests and dividends on their financial liabilities than they received on their financial assets. 6 While gross financial income can be interpreted as an indicator of financialization, what it does not indicate is a growing reliance among NFCs on financial income as a source of profits.
This final measurement error is also relevant to the case of France. In his descriptive analysis—not in his regression analysis—Alvarez (2015) adopted Krippner’s operationalization of NFC financialization, focusing on gross financial income. This gross measure is visualized in Figure 9 by the red line. However, once financial costs are accounted for, financial activities have consistently generated losses for French NFCs. This is, of course, as it should be: if non-financial firms could borrow low and lend high, they would likely be financial firms.
7
Gross financial income versus net financial income of French NFCs, share of gross operating surplus, 1978–2012. Source: OECD.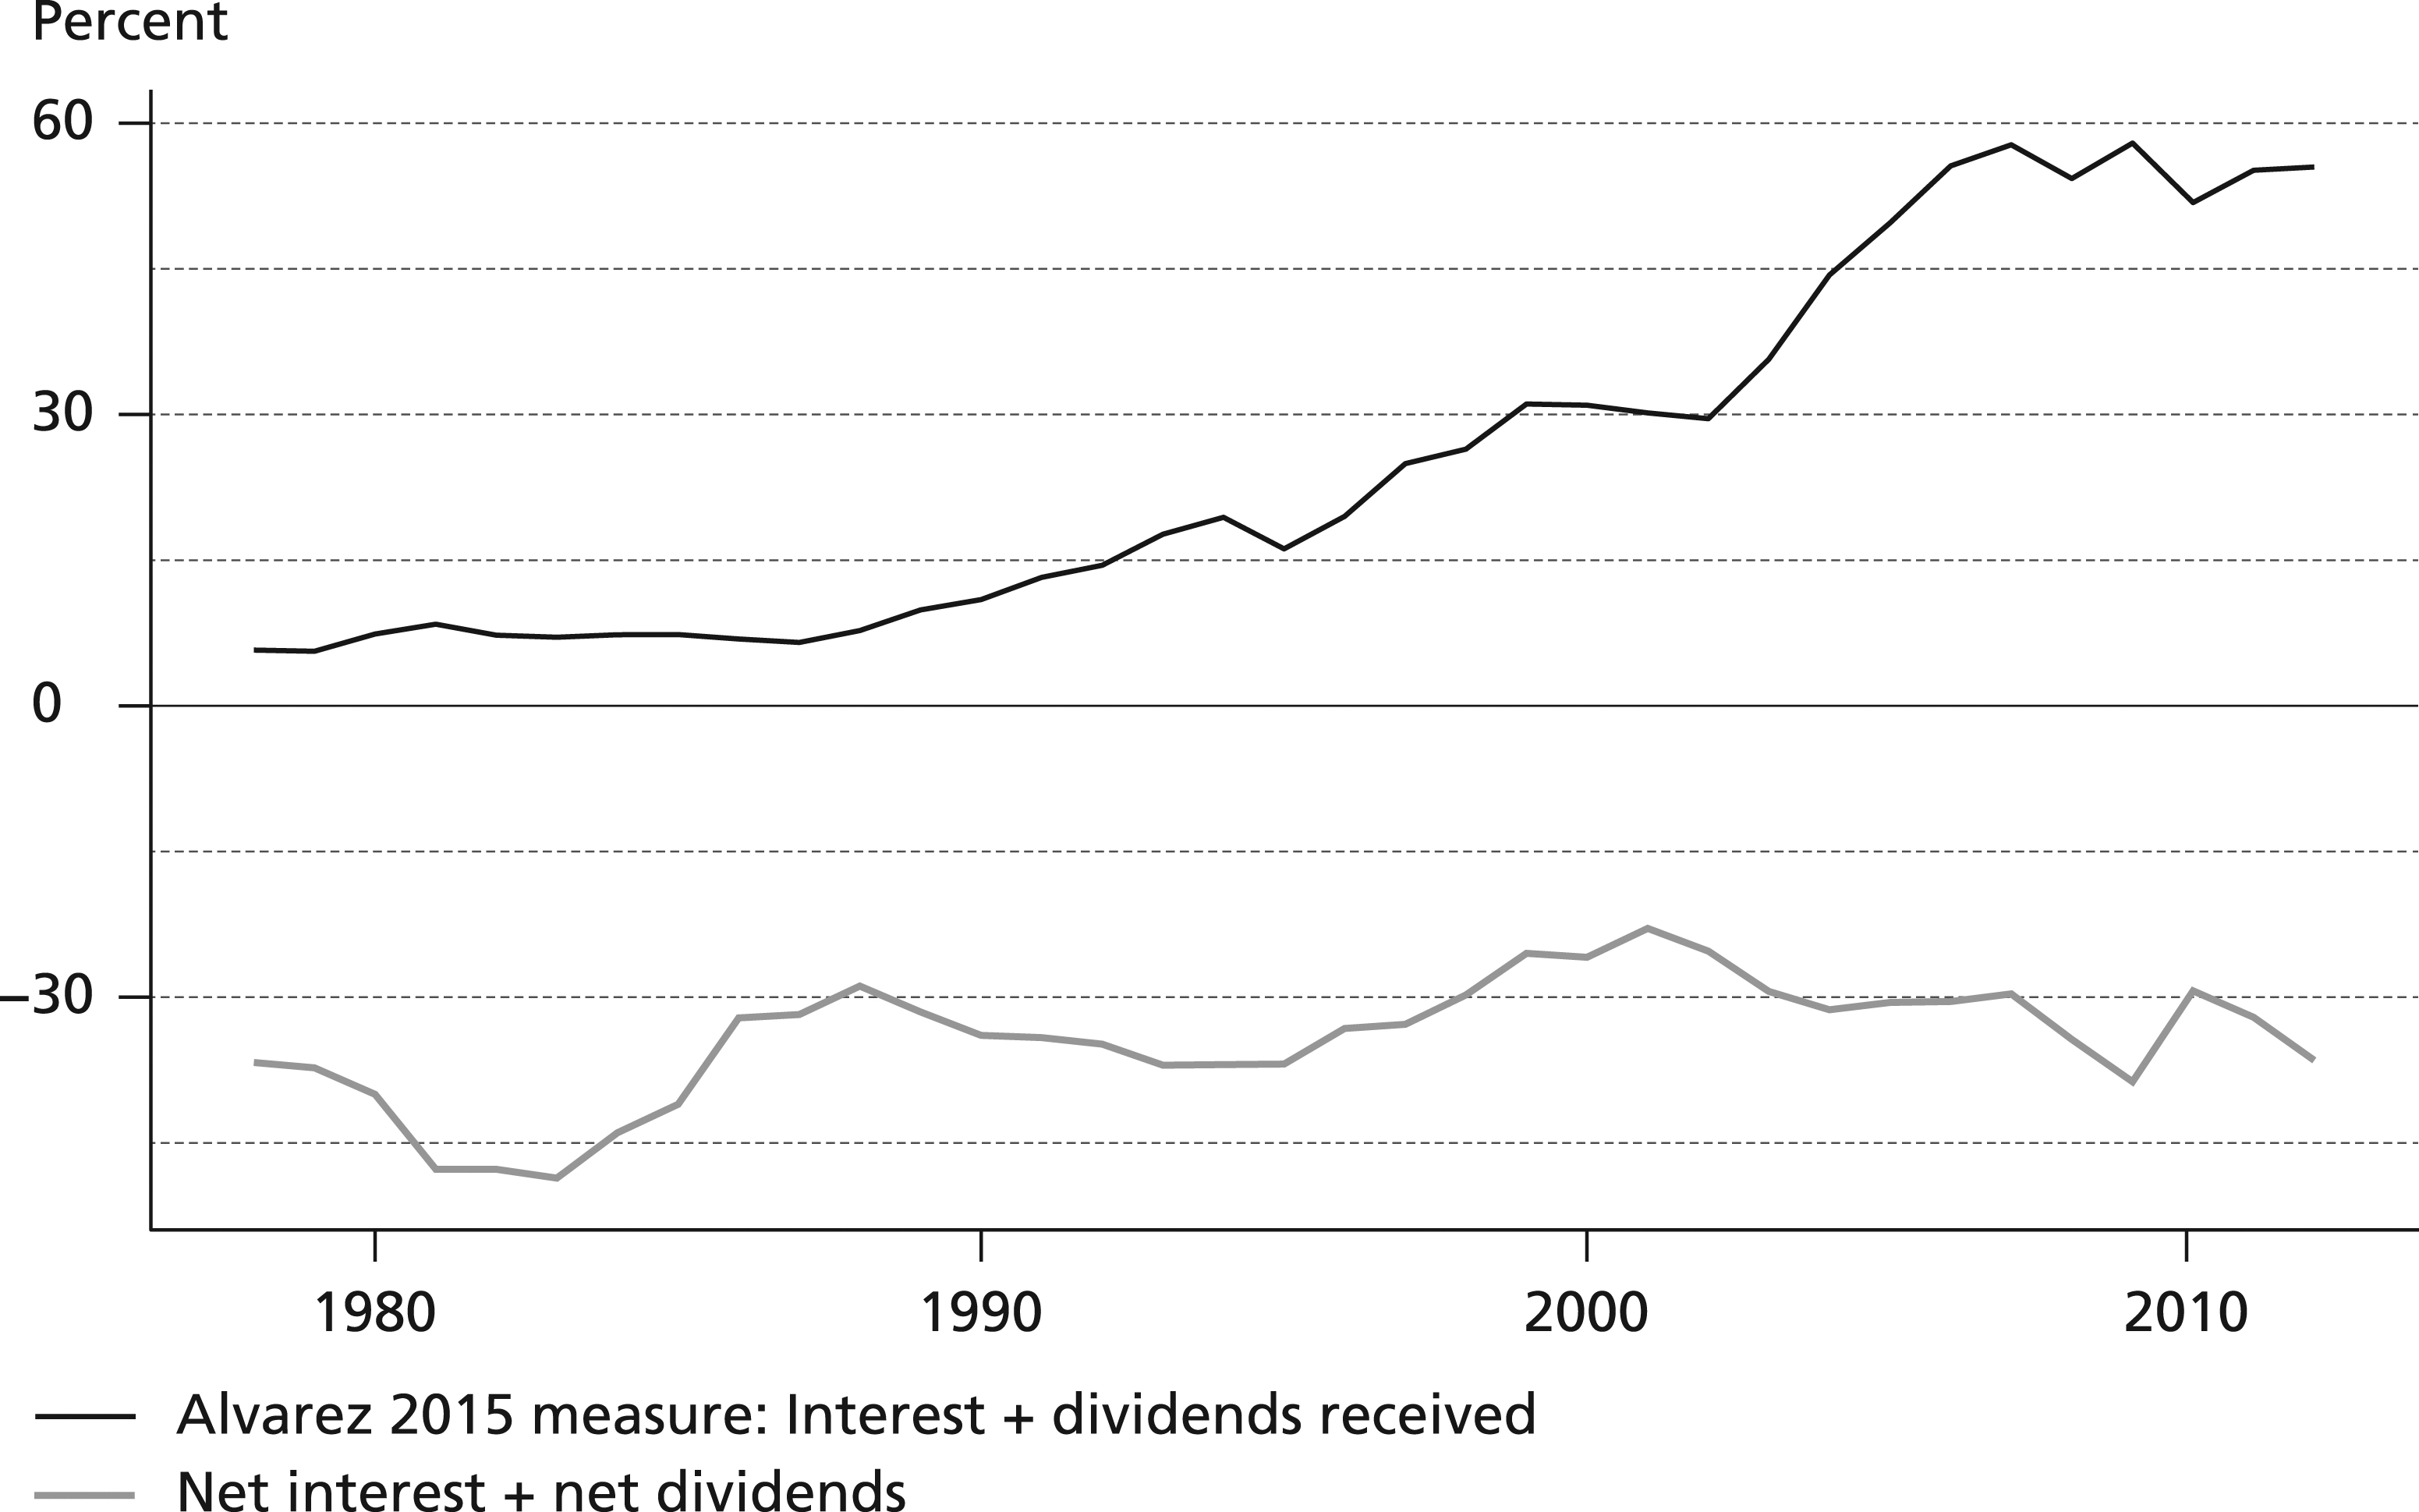
The exceptions to this rule are giant multinational enterprises. The biggest US technology companies in particular have invested large sums of retained overseas earnings in sovereign and corporate bonds. Again, firm-level data assembled by central banks, on listed corporations only, offers a comparative perspective. Figure 10 plots net financial assets (as a share of total assets) and net financial returns (as a share of turnover) for small, medium-sized, and large listed corporations from several European countries.
8
It shows that most small and medium-sized listed corporations have negative net financial assets and returns. Net financial assets are positive only for a minority of large corporations, while the majority of large corporations have positive net financial returns. By contrast, net financial assets and returns are negative for all small and medium-sized listed corporations, including in France. Caution is required with regard to interpreting the positive correlation between net financial assets and net financial returns, which could be driven by the greater financial acumen of larger corporations, or by the increasing indebtedness of struggling, shrinking businesses. Net financial assets and net financial income, by firm size, various countries, 2000–2019. Source: Bank for the Accounts of Companies Harmonized (BACH).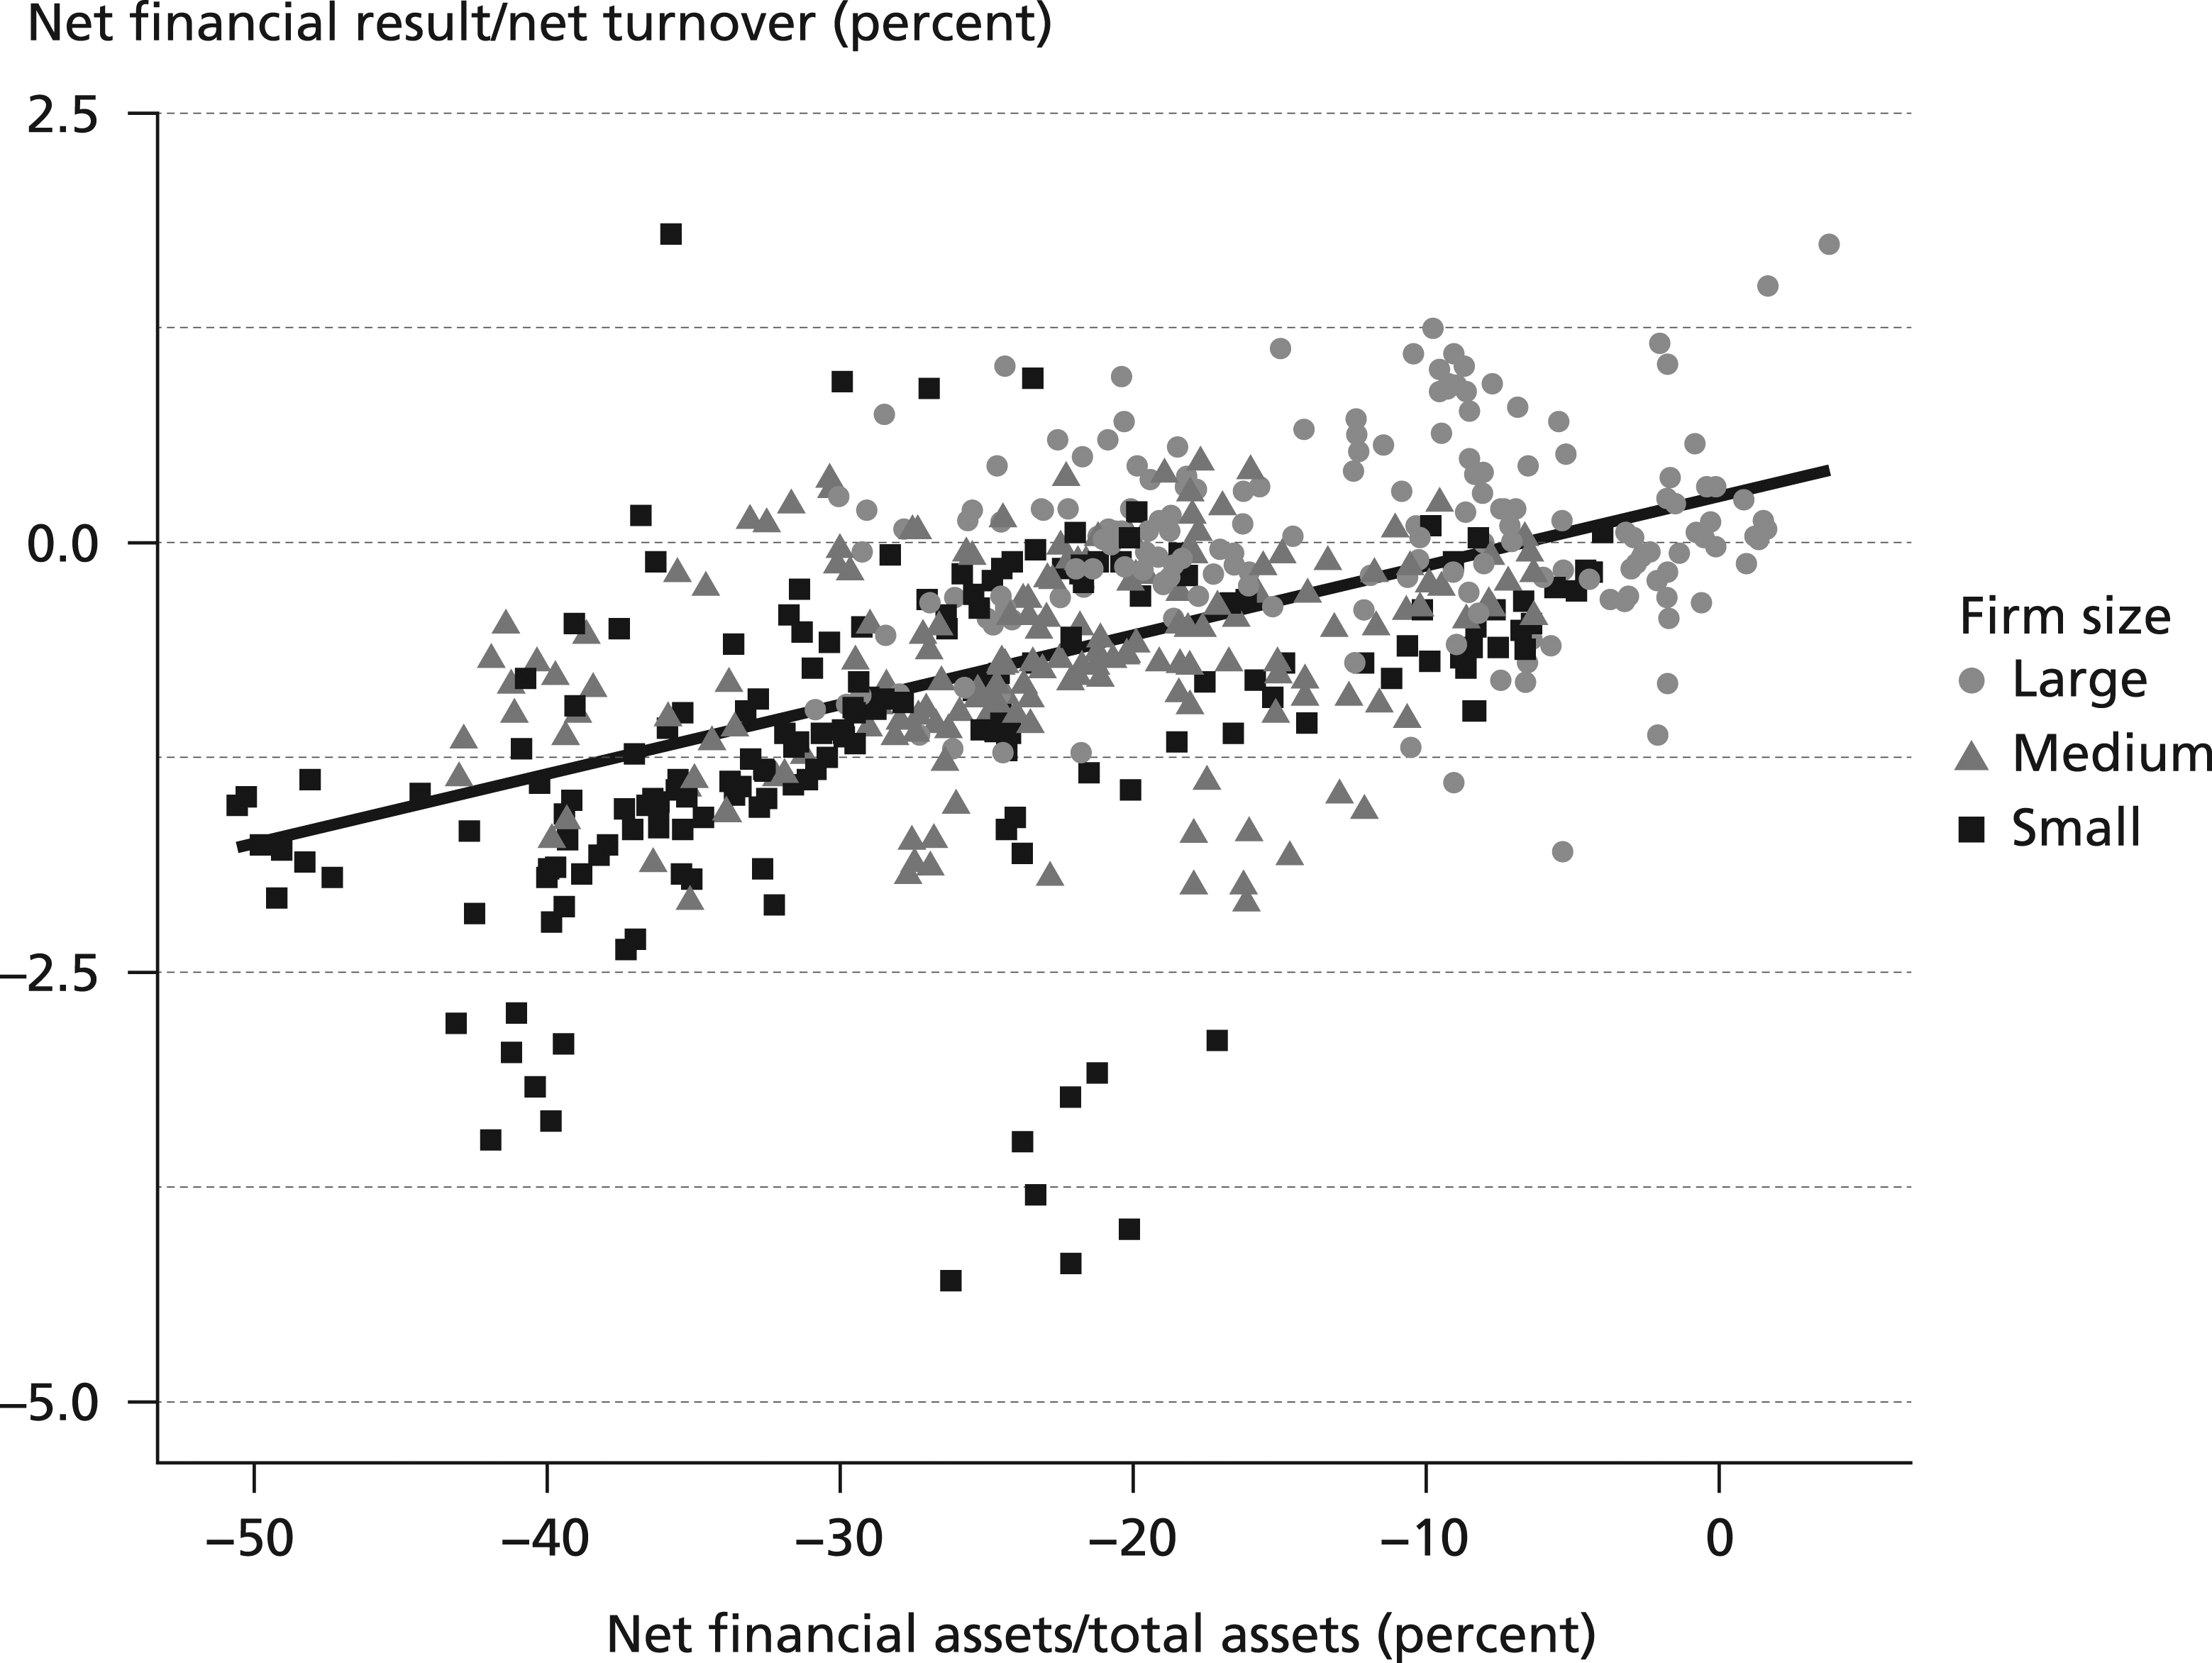
Our analysis of the French case shows that a deep dive into the data on NFC financialization leads to results that differ significantly from results obtained from headline indicators. As in the case of trade indicators for Sweden, common indicators of NFC financialization have been obfuscated through changing corporate practices and structures—they were subject to indicator drift. We do not wish to deny the financial activities of NFCs—which are significant (Karwowski and Centurion-Vicencio, 2018; Baines and Hager, 2020; Davis, 2016; Fernandez et al., 2020)—nor to minimize the distributionally regressive effects of the growth of finance in general. Indeed, we draw the opposite conclusion—our result that non-financial firms have not, in the aggregate, profited from their financial activities bolsters the argument that the financial sector has grown at the expense of the non-financial sector.
Methodological ways forward: Zoom in and disaggregate
Constructivist critiques often study a measure’s historical emergence, the ideas and interests in shaping it, and its discursive and material consequences. This constructivist approach has been highly successful—few defenders of statistical indicator “naturalism” remain today. However, it tends to leave empirical researchers without much practical advice on how to compare political economies based on statistical constructs. In this section, we therefore advocate a pragmatic middle road between constructivist indicator fatalism and naturalist indicator faith.
CPE scholars have, of course, long been aware of economic indicator problems. Many of the field’s key findings can be understood as results originating from efforts to go beyond aggregate indicators in country comparisons (Jackson and Hoepner, 2001; Soskice, 1997). Today, however, distortions to economic statistics induced by globalization and corporate organization cannot be ignored in any empirical study. Recent empirical correction exercises for the national accounts of the United States concluded that no indicator—the savings rate, productivity, the labor share, GDP as a whole—was unaffected by the activities of multinational corporations (Bruner et al., 2018; Guvenen et al., 2019). Common research designs in CPE cannot avoid globalization-induced statistical artifacts that, without additional statistical parsing, create illusions of change or stability over time, or of commonalities or differences across countries, and thereby seriously endanger the validity of empirical studies.
Without case-specific knowledge about corporate structures and practices, it is difficult to read economic meaning into changes in macroeconomic indicators. Such knowledge is available in economic history, economic sociology, political economy, and economic geography, and should be re-incorporated into comparative political economy (Herrigel, 2004; Jones, 2005; Morgan and Kristensen, 2006; May and Nölke, 2018; Schwartz, 2017). We therefore suggest making globalization-focused indicator parsing part of the routine methodological repertoire of CPE. To safeguard against indicator distortions, researchers should both zoom in on concrete corporate practices and disaggregate compound statistics. Organizational sociology can shed light on the multinational actors behind the transnational flows of goods and capital. For instance, understanding corporate structures requires detailed empirical analysis of “global wealth chains” (Seabrooke and Henriksen, 2017). It also involves the study of movements for transnational governance and international norm-setting in areas as different as international accounting, environmental norms, or labor standards (Djelic and Quack, 2011; Lütz, 2011). In some cases, knowledge from qualitative, interview-based research can be essential to improve quantitative comparative work (Hassard et al., 2009). Such knowledge is abundant in the literature on MNCs but has been neglected in the CPE literature on national varieties of capitalism and growth models.
The second strategy is to follow economists in disaggregating economic indicators (Bruner et al., 2018; Guvenen et al., 2019). This strategy becomes more feasible as statistical agencies are moving to expand their offerings with more fine-grained region-, sector- and firm-level data. The OECD’s multiprod database, for example, investigates the micro-drivers behind aggregate productivity trends and Eurostat’s Figaro program is an attempt to clean statistics from undesirable effects, including merchanting. The Amne-database disaggregates international trade statistics into the inward/outward activity of multinational enterprises and is available through the OECD. The OECD, Eurostat, and other statistical agencies also have a long tradition of disaggregating economic activity into sectors (in national accounts or industrial classifications) or firm sizes in structural business databases. Regional disaggregation has a long tradition in geography as well as in the political economy literature focusing on industrial regions within countries (Piore and Sabel, 1984). Central banks have also begun to develop disaggregated data, as in the cases of the BACH and ERICA databases used above. Finally, commercial datasets such as S&P’s Compustat or Bureau van Dijk’s Orbis allow for large-n quantitative work with firm-level data (Soener, 2020; Baines and Hager, 2020; Schwartz, 2021).
Conclusion
This article has outlined the challenges for comparative economic research arising from the activities of large, multinational firms. The activities of these firms create problems with economic indicators that reach deep into the heart of the discipline, complicating the empirical picture on key questions such as national growth models and the financialization of non-financial firms. Since students of economic indicator problems in neighboring disciplines rarely offer pragmatic solutions for CPE scholars, we propose to amend methodological routines in CPE by an indicator parsing step. In particular, we propose to zoom in to understand economic reality at the level of corporate structures and practices, and to disaggregate, to the extent possible, the relevant statistical data.
While the scope of our empirical analysis is focused on European countries, we expect indicator drift to be present across the global economy, albeit with distinct regional causes and patterns. Moving the analysis from rich OECD countries to other regions will almost certainly be accompanied by even graver challenges for disaggregation and data gathering.
Our plea for a systematic response to corporate globalization should not be mistaken for yet another fundamental critique of the comparative enterprise in political economy. Increasing degrees of freedom of large firms to organize activities are compatible with the continued relevance of national institutional configurations for economic activity (Morgan and Kristensen 2006). While our argument focuses on a methodological response to the proliferation of large multinational firms, we believe that closer substantive examination represents an equally pressing problem for comparative research. Different institutional regimes have arguably reacted differently to the fragmentation of the firm and the rise of global production chains (Reurink and Garcia-Bernardo, 2020). Thus, the outsourcing strategies of Swedish and German multinationals have significantly diverged, and the former’s continued domestic hardware production—even if embedded in internationalized supply chains—has likely had important ramifications for industrial policies, labor relations, and macroeconomic policies. In this sense, analyses of multinationals should be understood as complementary to, rather than in competition with, the comparative enterprise in political economy (Kaczmarczyk, 2020).
Bringing the systematic analysis of large firms into CPE may require an extension of the latter’s theoretical toolkit. Swedish corporations’ tendencies to use merchanting as a reallocation channel, or the structure of French corporations’ financial holdings, are arguably not fully determined by interest coalitions, regulatory structures, or ideas in the respective political economy. Explaining the idiosyncrasies of contemporary multinational enterprises does instead require theories of organizational structure and process. Multinational enterprises can be understood as complex organizational arenas, in which multiple material, cultural, and institutional influences are negotiated and enacted (Kristensen and Zeitlin, 2005; Morgan and Kristensen, 2006). Such intra-organizational processes have reached a scale at which they easily overshadow national institutions’ effects on economic activity. Theorizing the organizational structures and practices of multinational firms should become a core part of CPE.
Footnotes
Declaration of Conflicting Interests
The author(s) declared no potential conflicts of interest with respect to the research, authorship, and/or publication of this article.
Funding
The author(s) received no financial support for the research, authorship, and/or publication of this article.