
Abstract
In this paper, we analyse secular stagnation in the eurozone. We adopt a core-periphery perspective and analyse whether the 2007–2008 financial crisis triggered off diverging dynamics in the growth potential of core and peripheral eurozone countries. We find that secular stagnation affects the whole eurozone but is a much more serious concern in the periphery. Among the components of potential GDP, the NAIRU in particular has diverged since 2008. We find that the increase in the NAIRU is strongly related to demand-side factors such as investment demand and the fiscal policy stance, as well as to the technological level of the economy. Labour market institutions seem to play a relatively minor role, which may also change depending on the level of technological development of an economy. In line with these findings, we argue that reforms in the eurozone should focus on levelling out the core-periphery technological gap via industrial policy, and on the creation of homogenous financial and macroeconomic conditions among member countries, rather than on the generalized deregulation of labour markets.
Introduction
The outbreak of the 2007–2008 financial crisis and its transformation into a sovereign debt crisis in the eurozone, dramatically altered the assessment of the euro experiment. In November 2007, Tumpel-Gugerell, a previous member of the ECB executive board, claimed that the introduction of the euro had brought ‘monetary stability, with low inflation and convergence of long-term interest rates towards low levels’, these facts being ‘the best support for sustainable economic growth and employment’. In 2008, an EU Commission report celebrating the 10-year anniversary of the introduction of the euro praised the single currency as a ‘resounding success’. Just two years later, the eruption of the crisis in the ‘periphery’ of the eurozone, and the risk of a disintegration of the eurozone itself, radically changed the mind of policy makers and economists. According to several experts (De Grauwe and Ji, 2015; Eichengreen, 2014), the euro passed from being a ‘resounding success’ to a cause of economic distress.
The above events triggered two interconnected developments in the economic literature. First, since 2008, the economic discipline has rediscovered the concept of ‘secular stagnation’ (Eggertsson and Mehrotra, 2014; Gordon, 2014, 2015; Summers, 2014a, 2015) originally coined by Alvin Hansen (1934, 1939). Second, secular stagnation has been most widely seen as a eurozone problem, given the poor performance of the euro area in the last 10 years (De Grauwe, 2016).
In this paper, we tackle the issue of secular stagnation in the eurozone through a core-periphery perspective. This is a novel contribution of our work with respect to previous contributions on this topic (Anderton et al., 2014; Belke and Klose, 2017; Crafts, 2017; Jimeno et al., 2014). Several papers have already documented the existence of considerable heterogeneity in the development process of eurozone countries. Estrada et al. (2013) and Barkbu et al. (2016) stress the lack (or slowdown) of real economic convergence among eurozone countries even before the outbreak of the 2007–2008 crisis. Landesmann (2015) and Celi et al. (2018) note that when pre-crisis convergence in per-capita GDP occurred (in Greece and Spain, for instance), such processes were accompanied by external imbalances making core-periphery catching-up unsustainable and likely to fail in the long run. Consistent with structuralist core-periphery theory, Simonazzi et al. (2013), Celi et al. (2018), and Grabner et al. (2020a, 2020b) provide evidence about differences in the technological capabilities of European countries. In their views, persisting or even increasing intra-European technological gaps significantly contributed to the unsustainability of macro convergence among euro countries, to the asymmetric response to the 2007–2008 shock, and eventually to the generation of the eurozone crisis itself. Despite this evidence, previous work about secular stagnation and/or persistent high unemployment in the eurozone ignored the possibility that such phenomena might be somehow related to technological divergence between the core and the periphery of the euro area. Our work aims to fill this gap and bring together the above two streams of literature by documenting how technological differences among core and peripheral eurozone economies, and the way they may interact with macro policies, may have ignited (or reinforced) long-run diverging dynamics in potential GDP, and in the non-accelerating inflation rate of unemployment (NAIRU) more specifically, in the aftermath of the common 2007–2008 financial shock.
In this paper, we first empirically analyse whether the 2007–2008 financial shock has triggered secular stagnation in the core and the periphery of the euro area. Following Jimeno et al. (2014), Gordon (2015), Storm (2017) and Crafts (2017), we take the dynamics of potential GDP as the main indicator of secular stagnation. Second, we focus on the components of potential GDP that have changed the most in the wake of the crisis and that may represent relevant sources of deepening core-periphery divergence. The key component that arises from this analysis is the NAIRU, which is the focus for the rest of the paper. Our analysis departs from the standard mainstream explanation of the NAIRU as driven predominantly by supply-side factors, i.e. labour market institutions. Instead, we adopt a structuralist/post-Keynesian approach. We first analyse the influence of different technological capabilities in core and peripheral eurozone countries on the NAIRU. This follows Storm and Naastepad (2015a, 2015b) and Storm (2017), who argue that peripheral eurozone countries ‘are locked in to lower and middle levels of technology’ (Storm and Naastepad, 2015a: 969). Secondly, we investigate the role of demand-side forces in shaping diverging NAIRU dynamics between core and peripheral eurozone countries, and the way such demand-side factors may have interacted with the above-mentioned technological capabilities. Consistent with Stockhammer and Klär (2011) and Heimberger et al. (2017), we emphasize the importance of investment demand as a relevant determinant of the NAIRU. Differently from them, we extend our analysis to the role played by fiscal policy. To the best of our knowledge, this is the first paper to explore both fiscal policy and technological capabilities together in an empirical analysis of the NAIRU.
Four different findings of our work are worth mentioning. First, while post-crisis secular stagnation seems to appear as a concrete reality in the whole eurozone, it is much more acute in the periphery. Since 2008, pre-crisis core-periphery convergence has turned into deep macro divergence. Capital accumulation and the level of the NAIRU are the components of potential GDP that have been most affected by the recessionary forces triggered by the worldwide financial crisis. Since 2008, the NAIRU in the periphery of the eurozone has increased substantially, while it has slightly decreased or remained constant in the core.
Second, with the exception of active labour market policies, institutional factors affecting the functioning of the labour market do not play a consistent, clear or relevant role throughout eurozone core and peripheral countries. They seem to be relatively minor determinants of potential GDP and of the NAIRU with respect to structuralist-type technology and demand-side factors.
Third, the technology capability of eurozone economies may play an important role in explaining the level of the NAIRU and the ensuing dynamics of potential GDP. This is particularly so in the periphery of the eurozone. The technological weaknesses characterizing these economies may contribute to raise the NAIRU, making it much higher than that recorded in the core.
Fourth, the NAIRU (and, hence, potential GDP) seems to be correlated with demand-side factors. On the one hand, our analysis confirms what has already been pointed out by Stockhammer (2004) and Stockhammer and Klär (2011): investment demand seems to negatively affect the NAIRU. On the other hand, we find a significant positive correlation between the NAIRU and fiscal cuts in the public budget. In the eurozone, tough fiscal austerity after 2010 has significantly drained aggregate demand and may have contributed to increasing the NAIRU.
The paper is organized as follows. The next section reviews the concept of secular stagnation. The subsequent section illustrates the rationale for the core-periphery perspective adopted in this paper and addresses the long-lasting macroeconomic consequences of the 2007–2008 crisis in the core and the periphery of the eurozone. The penultimate section points out the respective roles of ‘mainstream-like’ labour market institutions, structuralist-type technological factors and demand-side factors in the determination of the NAIRU. The last section concludes and drives policy implications stemming from the above findings.
Secular stagnation and the dynamics of potential GDP
The concept of secular stagnation has neither a well-established definition nor a clear method of how to measure it. Similarly, a consensus does not exist about its causes and solutions. In 1938, the US economist Alvin Hansen defined the ‘essence of secular stagnation [as] sick recoveries which die in their infancy and depressions which feed on themselves and leave a hard and seemingly immovable core of unemployment [italics is ours]’ (Hansen, 1939: 4). He had first introduced this concept five years earlier however, saying that ‘the secular stagnation of business [is] incident to the accumulation of a surplus of funds unable to find an adequate outlet in profitable investment’ (Hansen, 1934: 19).
Hansen’s reference to saving-investment matching as the possible missing economic adjustment leading to secular stagnation may have misdirected most of the recent mainstream contributions on secular stagnation from its original meaning, causes and solutions. On the one hand, these works take the Wicksellian theory of interest rate-driven adjustments to full employment as the proper theoretical framework to address the problem of secular stagnation (see Blanchard et al., 2014; Claeys, 2016; Eggertsson et al., 2017; Eichengreen, 2015). On the other hand, mainstream empirical analyses concentrate their attention on estimating the existence of a negative natural interest rate as proof of secular stagnation (see Belke and Klose, 2017; Hamilton et al., 2016). A critique of these approaches is out of the scope of this paper. 1 What it is relevant for our purposes is that Hansen himself considered interest rate-led adjustments and the Wicksellian theory to be largely irrelevant to explain secular stagnation (Hansen, 1939: 5). According to Hansen, the roots of secular stagnation lie in a structural lack of profitable investment opportunities, or in other words, a lack of investment demand caused by structural forces such as the slowdown in population growth, a narrowing scope for innovation, the closing of the Western US frontier and a lower exploitation of natural resources.
The concept of potential GDP did not yet exist when Hansen first talked about secular stagnation (Gordon, 2014). Nonetheless, the long-run structural perspective characterizing Hansen’s view makes the association between the idea of secular stagnation and the evolution of potential GDP quite straightforward. 2 According to Teulings and Baldwin (2014), three different (but rather close) approaches have recently emerged after Larry Summers rediscovered secular stagnation in his 2013 IMF address in honour of Stanley Fischer. The first one, consistent with Gordon (2014), links secular stagnation to the decline in the growth rate of potential GDP. The second one focuses on a one-off reduction in the level of potential GDP regardless of a possible slowdown in its trend growth. In both views, a slowdown in potential GDP is mainly explained by supply-side forces such as a negative exogenous shift in the dynamics of productivity or excessive labour market rigidities (causing persistent post-crisis increases in the NAIRU). A third Summers-like approach ‘measures’ secular stagnation according to the gap between actual and potential GDP.
In the first part of this paper, we analyse post-2008 secular stagnation in the eurozone, and the possibility such a phenomenon might have taken different orders of magnitude in the core and the periphery. We analyse the dynamics of potential GDP for two reasons. First, using the output gap as a measure of secular stagnation is highly questionable. As Summers (2014b) himself admits, a squeeze in the output gap may come from a reduction in potential output itself rather than from a rebound in actual output towards its pre-crisis potential trend. Indeed, this is what has happened in Japan in the 1990s and, more recently, in the US and EU. As a consequence, the output gap may disappear, even though the economy remains depressed with widespread unemployment. Second, we follow Storm and Naastepad (2015b) and Storm (2017), and we depart from standard mainstream explanation of potential GDP as determined by supply side factors related to labour market institutions (or the regulation of the goods market). In this paper, we analyse the evolution of potential GDP, and of some of its components, by taking on board suggestions from structuralist and post-Keynesian theory. In line with structuralist theory, we investigate whether differences in the potential GDP of eurozone countries, and in the NAIRU in particular, may be influenced by differences in their levels of technological capability and productive complexity. Following Storm and Naastepad (2015b), different technological capabilities may in fact give rise to different dynamics of labour productivity, which, ceteris paribus, may in turn lead to different values of the NAIRU. Consistent with post-Keynesian theory, we admit for the possibility that demand factors may also influence potential GDP, and the NAIRU more specifically. Buoyant aggregate demand, for instance, may raise productivity dynamics via the Kaldor-Verdoon effect, thus reducing the NAIRU and increasing potential GDP (Storm, 2017; Storm and Naastepad, 2015b). 3 In this context, the NAIRU may thus change endogeneously due to demand-related factors (Ball, 2009; Stockhammer, 2004; Stockhammer and Klär, 2011), and may be path-dependent with respect to actual unemployment (Ball, 2009). 4
Potential GDP is a theoretical construct that cannot be directly observed from available economic data. The definition of potential GDP commonly adopted by international institutions and national economic bodies refers to the maximum quantity of output that can be produced at stable inflation. It is usually estimated by applying a standard production function (say a Cobb-Douglas production function) to filtered macro data on GDP, capital stock, labour force and total factor productivity (TFP). This is explicitly pointed out in equation (1), where Y* stands for potential output, TFP* and N* represent trends values for TFP and the available labour input
5
respectively, and Kt is the available capital input at time t. In equation (1), u* stands for the NAIRU, i.e. the rate of unemployment of the labour force that ensures inflation to remain constant.

There are several critiques to the above definition of potential GDP and to the way it is estimated. Palumbo (2015) and Fontanari et al. (2019) criticize the fact that the concept of potential output is theoretically biased, as it incorporates the mainstream theory of inflation and unemployment, i.e. the NAIRU, 6 and its computation is based on filtered macro data fitted onto a mainstream production function. According to them, this approach does not actually measure the real production potential of an economy and tends to systematically underestimate output losses during recessions. This criticism is well grounded. Nevertheless, a critical appraisal of the definition and measurement of potential GDP and of its components is far beyond the scope of this paper. For the sake of comparability with previous mainstream studies of this topic, we maintain the same methodological approach. In a way, this is a critique ‘from inside the mainstream’ by starting from the same data and estimation techniques used by mainstream analyses. However, the theoretical framework of our study is much broader as it embraces relevant insights coming from structuralist core-periphery theory and from post-Keynesian economics. This way, we show how economic mechanisms central to structuralist and post-Keynesian theory may provide more effective explanations for the economic phenomena usually interpreted through the narrow lenses of mainstream economics.
The 2007–2008 financial shock, the dynamics of potential GDP and secular stagnation in the eurozone: A core-periphery perspective
The fact that the last financial crisis may have induced a prolonged economic slowdown, if not stagnation, in the euro area is not new in the economic literature (Summers, 2014b). Nonetheless, only a few works have addressed this issue from an empirical point of view. Anderton et al. (2014) perform a detailed empirical analysis of the main components of potential output for the eurozone as a whole and detect an unprecedented decline in the speed of capital accumulation and a symmetric increase in the NAIRU after 2008. Ollivaud and Turner (2015) conduct a similar analysis for OECD countries, eurozone Member States among them, reporting evidence of post 2008 changes in potential output for each economy.
The above contributions provide clear evidence of the possible long-lasting negative effects of the 2007–2008 shock on the economy of eurozone countries. However, by analysing the Eurozone as whole, they miss the considerable degree of heterogeneity within the monetary union. This is not a trivial shortcoming. Indeed, following Storm and Naastepad (2015a) and Celi et al. (2018), the fact that eurozone countries responded asymmetrically to a somehow symmetric shock is related to the way their different technological capabilities and productive structures interacted with the process of monetary integration itself. Since late 1990s until the outbreak of the crisis, quite abundant capital flows moved from the core of the eurozone to technologically weaker peripheral countries, attracted by temporarily higher yields and by the apparent disappearance of the exchange rate risk. Such capital flows gave rise to economic accelerations in the periphery, and signs of core-periphery macro convergence. However, they also fed deepening imbalances. The technological gap dividing the periphery of the eurozone from the core, and the lack of non-price competitiveness in the periphery, was mirrored by widening current account deficits in the former set of countries, and by persistent surpluses in the latter. The financial crisis brought this process to an abrupt end (Merler and Pisani-Ferry, 2012). Sudden stops, capital reversals and the ensuing sovereign debt crisis, eventually led to structural adjustment in the periphery, much like those frequently observed in the periphery of the world economy since the 1980s.
Technological capabilities, and the core-periphery technological gap, may influence the relative (core-periphery) dynamics of potential GDP and the NAIRU in different ways. In this paper, we put emphasis on two different but connected mechanisms. First, in a broad development perspective, Chang and Lebdioui (2020) stress that the accumulation of technological knowledge and the connected diversification of the productive system are fundamental conditions to ensure sustained and sustainable growth and macroeconomic stability. Expanding technological capability is the most promising way to boost productive investment and increases in labour productivity. Following Storm and Naastepad (2015b), fast growing labour productivity ultimately leads to higher potential GDP by reducing, ceteris paribus, the NAIRU. 7 Second, following Stockhammer (2008), the NAIRU may change endogenously through time due to long-lasting effects of demand shocks. The endogenous nature of the NAIRU comes, among other factors, from the relation between insiders and (long-term unemployed) outsiders in the labour market and the ensuing hysteresis in the distributive conflict between workers and capitalists. In this context, a more technologically advanced, more diversified and innovative economy that ensures stronger resilience to economic downturns and may feature lower levels of long-term unemployment (Dosi et al., 2018), may actually contribute to reduce hysteresis and the NAIRU.
The magnitude of the technological gap possibly shaping the relative economic dynamics and the economic interaction between core and peripheral eurozone countries is well captured by the so-called ‘Cepalitec’ index originally computed by ECLAC for Latin American countries (ECLAC, 2016). The index takes a simple average of two normalized indicators: one related to a country’s export share of medium/high-tech engineering-related manufactured goods over total (country) exports (
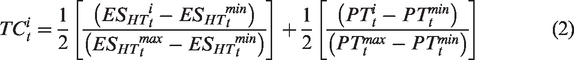
In equation (2), ‘i’ stands for countries, while ‘t’ indicates time.
Figure 1 portrays the evolution of the weighted average of the technology capability index for both core and peripheral eurozone countries 9 from 1984 to 2018, as well as an indicative measure of the core-periphery technological gap as captured by the ratio between the two sub-samples ‘TC’ indexes.
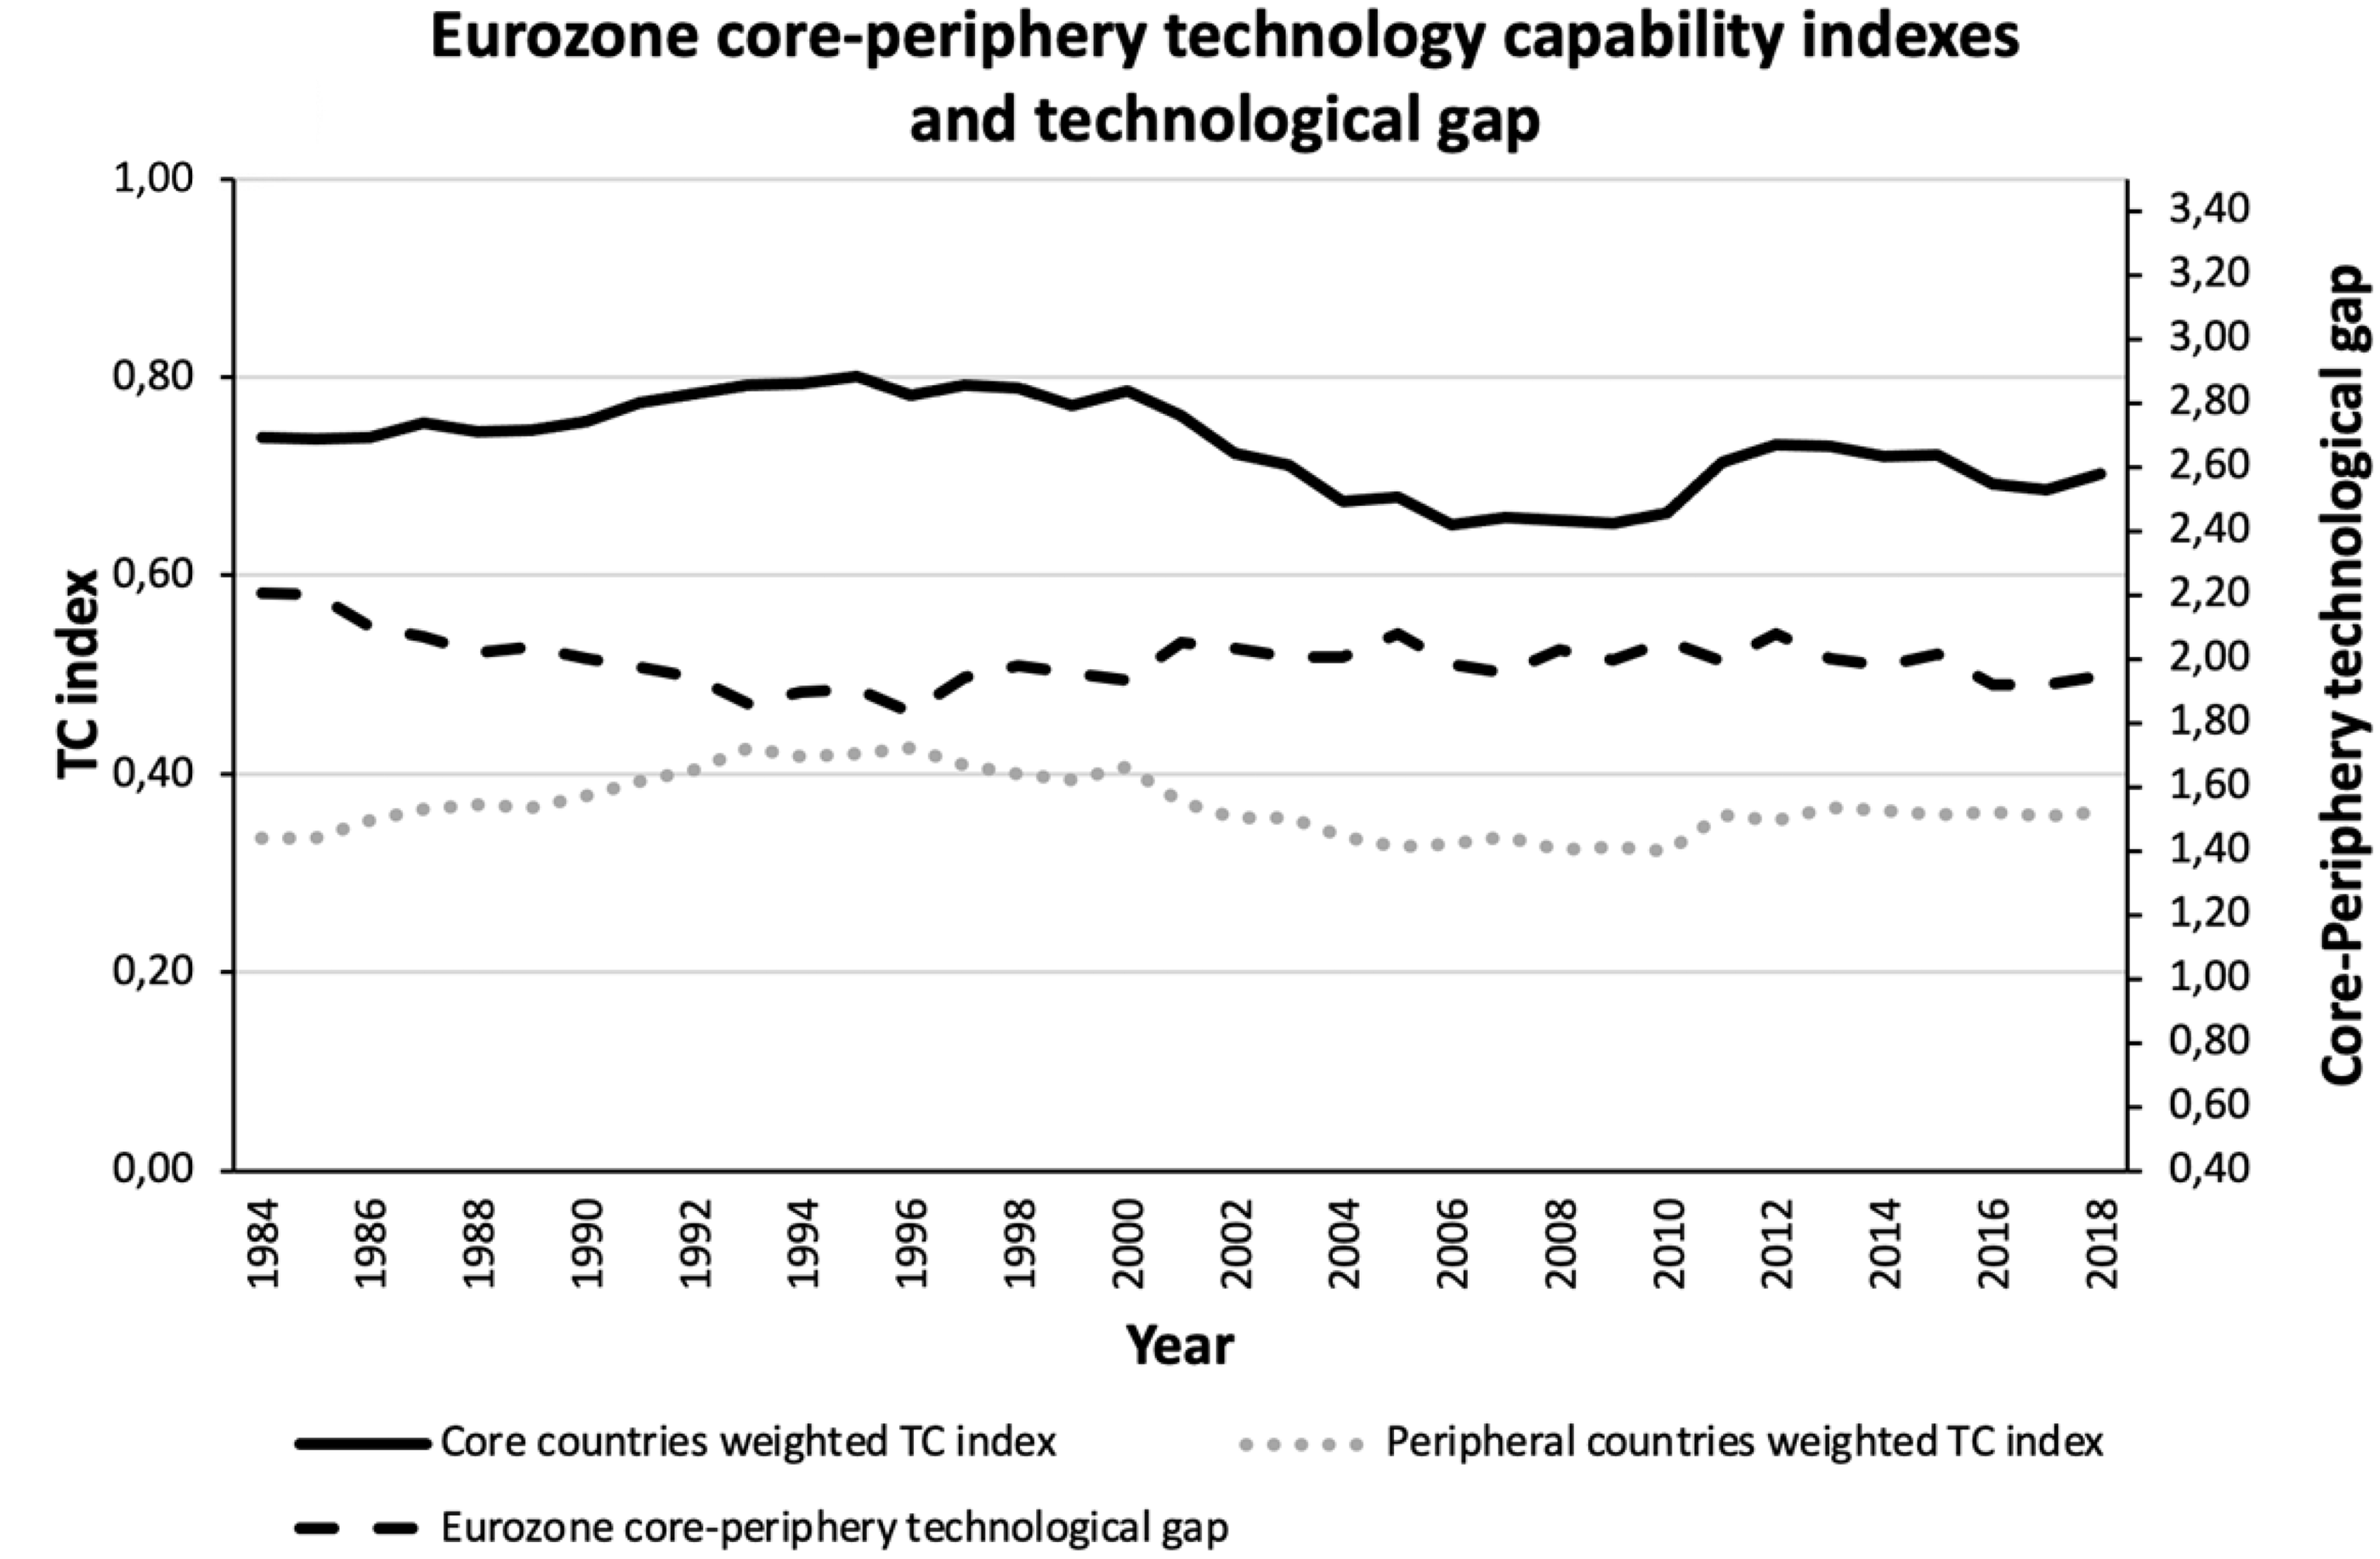
Technology capability index in core and peripheral eurozone countries and core-periphery technological gap, 1984–2018.
The TC index provides a ranking of eurozone countries by technology capability. From Figure 1, it is easy to see how core economies (black solid line) have persistently positioned above peripheral countries (grey dotted line) in the technological ladder. Greece has permanently remained at the bottom of this technological hierarchy, while Germany at the top. 10 Figure 1 also reveals that there were signs of core-periphery technological catching-up before mid-1990s (see black dashed line). The technological gap, however, never closed and has even widened since 1996. Consistent with Simonazzi et al. (2013), and Celi et al. (2018), such a newly established technological divergence between core and peripheral eurozone countries is linked to the enlargement of the European Union towards East European countries (the so-called ‘catching-up countries’ in Grabner et al. (2020a)). The relocation of some manufacturing productions towards East European countries has in fact partially displaced those in Southern European economies, thus pushing their technological capabilities downwards.
The empirical evidence portrayed by Figure 1 gives a clear idea of persisting technological differences between core and peripheral eurozone countries and explains the rationale for the adoption of a core-periphery approach for our analysis of secular stagnation in the eurozone. In this paper, we adopt a rather ‘standard’ classification of eurozone Member States. We define peripheral economies as those hit the most by the 2007–2008 financial shock and/or by the sovereign debt crisis, i.e. Portugal, Ireland, Italy, Greece and Spain. We include Austria, Belgium, Finland, France, Germany and the Netherlands in the core. Our classification is different from the one put forward by Grabner et al. (2020a) because we restrict our analysis to the eurozone only, and not to the wider European Union. Moreover, we exclude from our sample very small economies such as Luxemburg, Malta and Cyprus, or eastern economies that joined the eurozone during or after the outbreak of the 2007–2008 financial crisis. The inclusion of France among core economies is controversial. Celi et al. (2018) document the progressive process of ‘peripheralization’ of the French economy since 1980 as due to its industrial decline (of the automotive sector, in particular), and the ensuing emergence of persistent external imbalances (read current account deficits). Grabner et al. (2020b) define France as an intermediate case between core and peripheral countries, but eventually include it in the periphery as a consequence of widening technological gaps with respect to core economies. In this paper, we take a different approach, considering France as a core economy. We do this for three different reasons. First, albeit French de-industrialization is undeniable, France’s technological capabilities seem to be closer to those of the core than the periphery (see Figure 1). This is likely due to the fact that the TC index we compute in this paper does not exclusively rely upon trade statistics as Grabner et al. (2020b) do. 11 When data about the outcome of innovation processes are also considered, France seems to be better placed in the technological hierarchy. This view is supported by data about investments in R&D and employment in scientific and high-tech sectors (Botta, 2014). Second, the post-2008 increase in unemployment and slowdown in potential GDP (i.e. the variables at the basis of this study) registered in France seem to be much weaker than those recorded in the periphery (Botta et al., 2018). Third, in the aftermath of the 2007–2008 shock, France has not been exposed to acute financial turbulences and/or did not have to rely on bail-out programs, giving it more room for expansionary fiscal policy than in the periphery.
Given such classification, we have collected data for potential GDP and its components from 1998 to 2017 for all the countries in the sample. 12 The statistical information comes from AMECO and Eurostat datasets. Consistent with the above-mentioned production function technique, we have computed average annual growth rates for the following components of potential GDP: trend TFP growth; net capital formation and the growth rate of working age population. We have finally taken average levels of labour force participation and the NAIRU. After constructing the dataset, we have computed simple averages for the core and the periphery for the sub-periods from 1999 to 2008 and from 2009 to 2017. We have checked for the occurrence of any structural break from one period to the other, and between core and periphery economies, by performing a two sample t-test on computed averages for all the variables at stake. The results of this analysis are reported in Table 1.
Potential GDP growth rate and its components: Pre-crisis (1999–2008) and post-crisis (2009–2017) structural break analysis and core-peripheral gap.
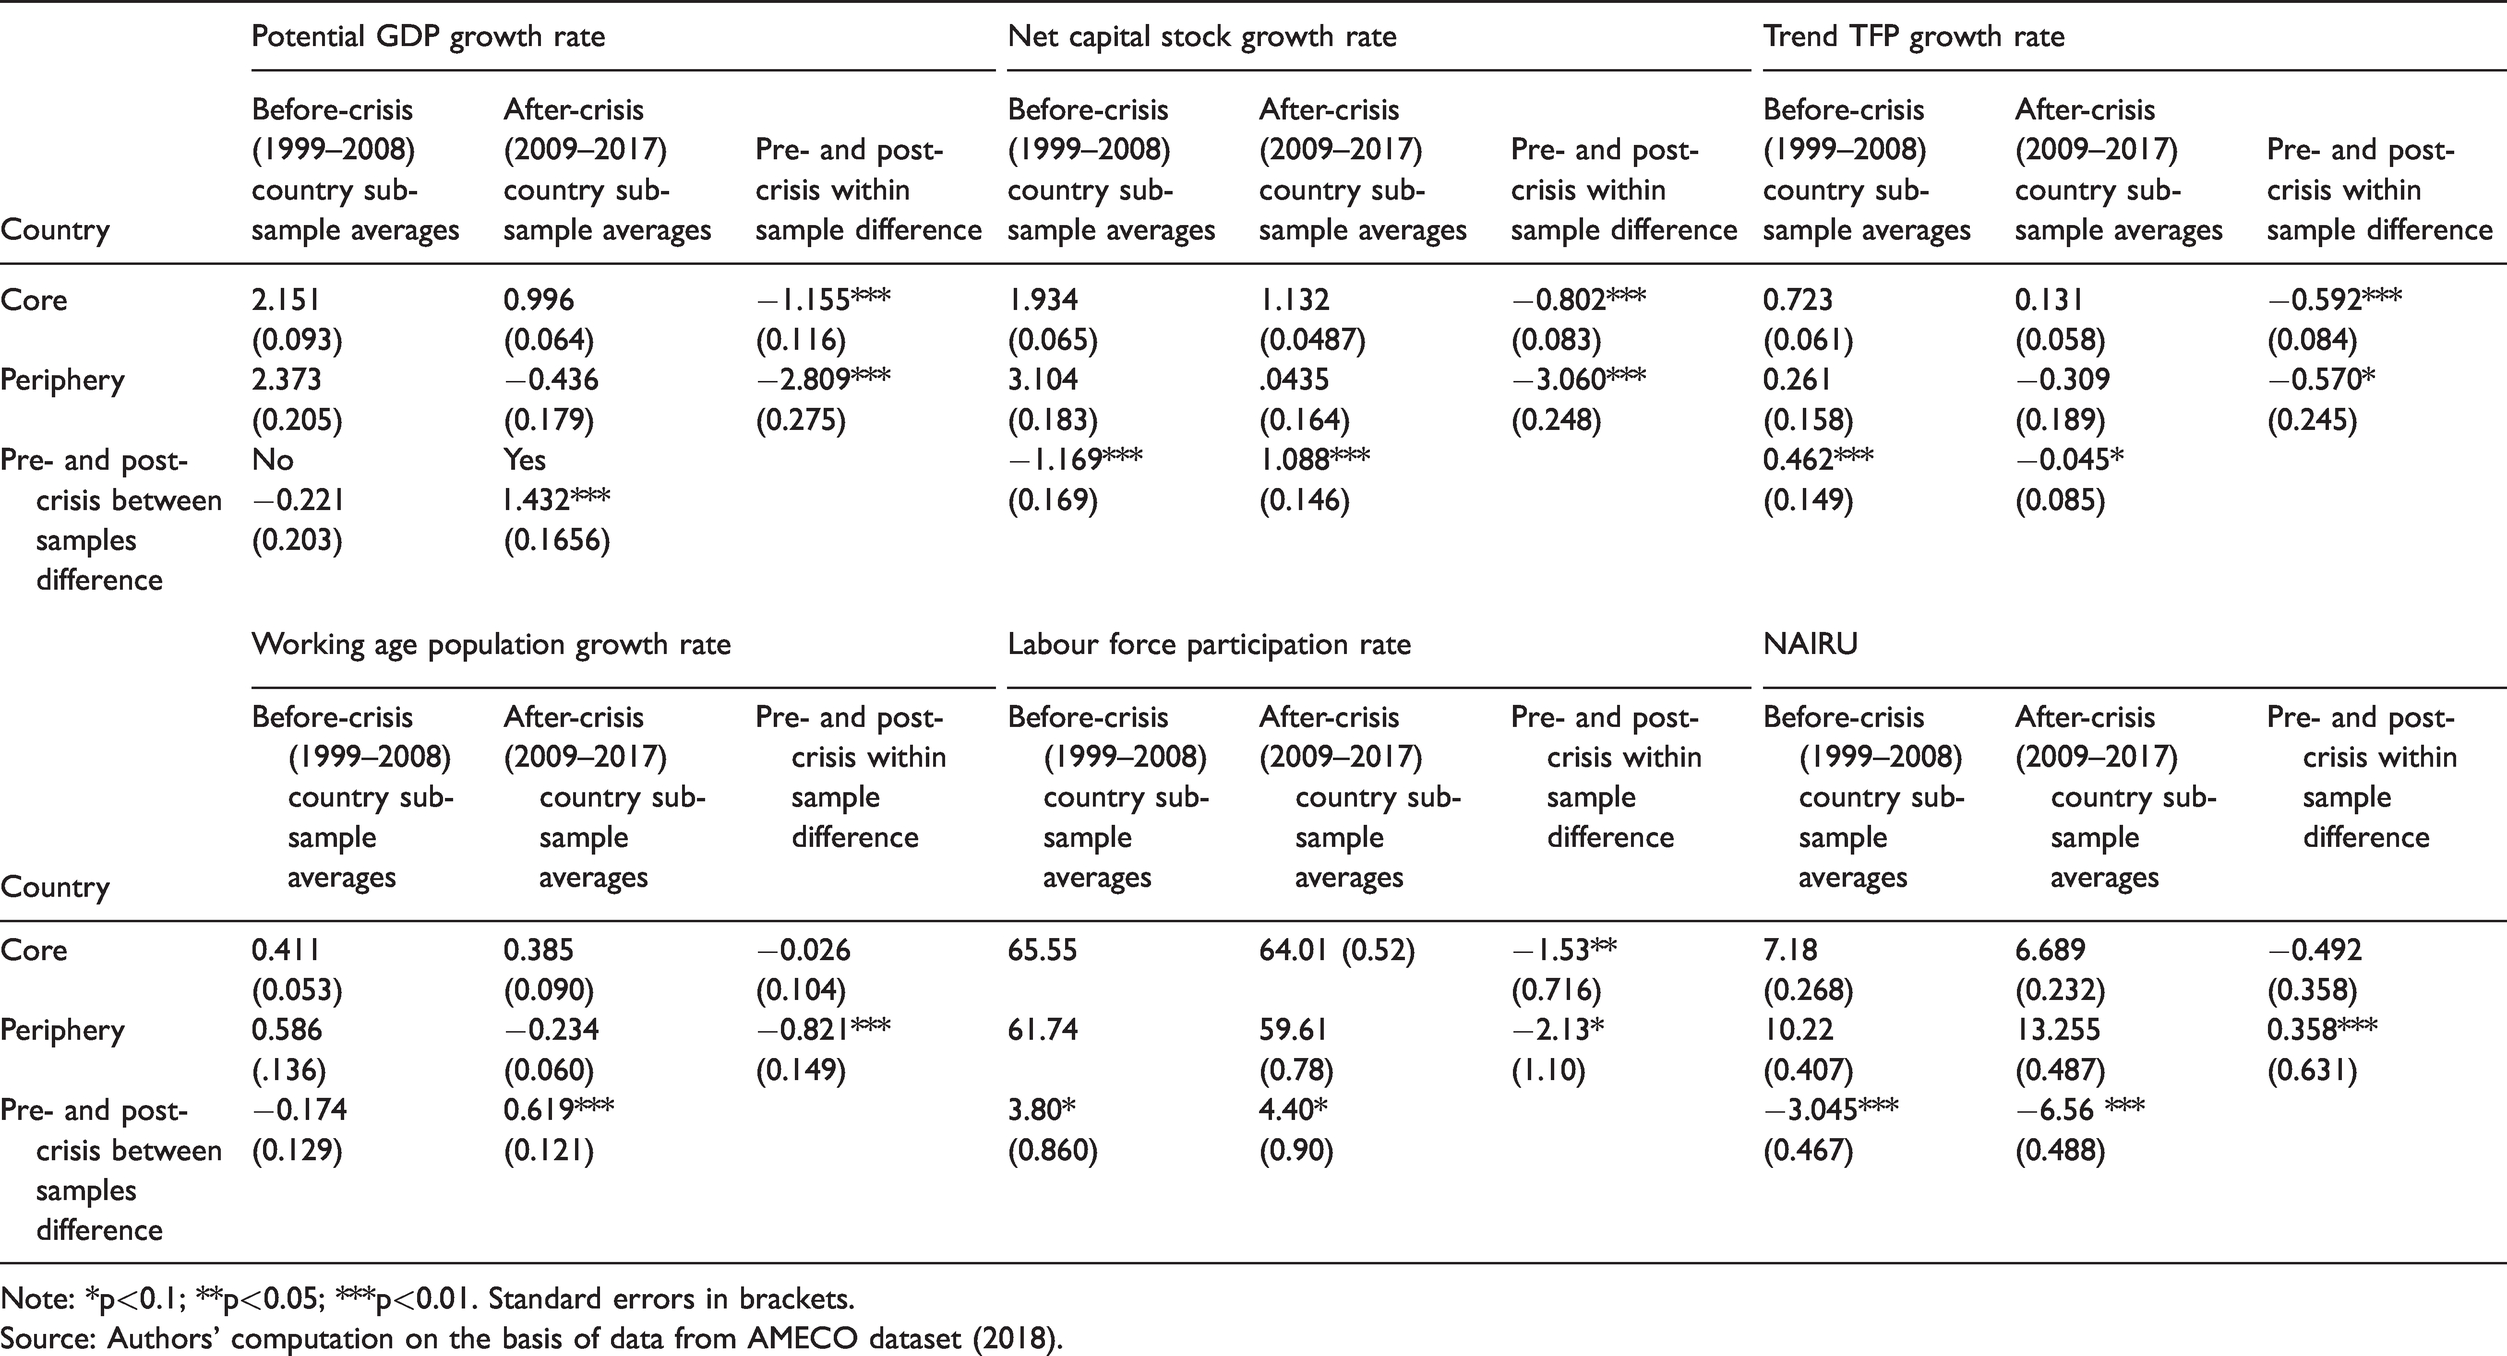
Note: *p<0.1; **p<0.05; ***p<0.01. Standard errors in brackets.Source: Authors’ computation on the basis of data from AMECO dataset (2018).
From Table 1, pre-crisis potential GDP growth in the periphery was slightly higher, although not statistically different, with respect to what was recorded in the core. The outbreak of the crisis gave rise to a considerable and statistically significant drop in potential growth in both sets of countries. If we take a reduction in potential GDP growth as a sign of secular stagnation, this has clearly characterized the economic dynamics of both the core and periphery of the eurozone since 2008. The reduction in the periphery, however, has been much more pronounced (indeed around 2.5 times deeper) than the decline registered in the core of the euro area. Whilst potential growth in the core is still positive (albeit 1.1 percentage points lower than pre-crisis average), potential output dynamics has turned negative in the periphery. As a consequence, from 2009 to 2017, there is solid empirical evidence for core-periphery divergence in the evolution of potential output.
When it comes to the components of potential output, our results show that capital accumulation and TFP growth have been significantly (and negatively) affected by the financial crisis in both peripheral and core economies. Once again, reductions in the periphery have been as large as or deeper than what was observed in the core. Capital accumulation was significantly faster in the periphery than in the core from 1999 to 2008 – a positive sign of intra-eurozone convergence. In the wake of the financial crisis, however, things have reversed, with core countries now investing much more than what economic actors do in the periphery. As to TFP growth, the dynamics of productivity has been persistently higher in the core than in the periphery both before and after the financial shock. This may be taken as additional evidence of the persistent core-periphery technological gap that peripheral economies have never managed to reduce, due to the periphery’s productive specialization in relatively low-tech industries with reduced scope for innovation and productivity growth, compared to the medium-high tech sectors at the centre of core economies’ productive systems (Celi et al., 2018; Storm and Naastepad, 2015b, 2016). What has changed following the crisis however is that average TFP growth in the periphery of the eurozone has turned negative.
Table 1 also shows that core and peripheral countries recorded similar rates of working age population growth before the 2007–2008 financial shock. Indeed, this variable was slightly higher in the periphery but not statistically different with respect to what was observed in the core. On the contrary, post crisis trends are statistically different and show different signs between the core and the periphery. While working age population has kept on growing in core economies (albeit at a lower rate), it has declined in the periphery. This outcome should not come as a surprise. Indeed, it is consistent with the increasing evidence of intra-euro area migration, with part of the labour force in the periphery moving towards core economies in search for better employment opportunities (Fries-Tersch et al., 2016). While, on the one hand, this fact may partially alleviate the problem of mass unemployment in certain peripheral countries (see Greece and Spain in particular), migration can give rise to a brain drain in the periphery and be an additional factor leading to divergence.
Finally, Table 1 portrays the results of our two-sample t-test analysis related to the NAIRU. As Table 1 clearly shows, the NAIRU has been persistently higher in the periphery than in the core regardless of whether we are looking at the period before or after the crisis. Before the outbreak of the 2007–2008 financial crisis, the NAIRU was, on average, 3 percentage points higher in peripheral eurozone countries than in core economies, this difference being statistically significant. This fact notwithstanding, it is worth noting that such a gap has significantly widened in the post-crisis period. On the one hand, average NAIRU has slightly decreased in core economies, with no sign of a structural break. On the other hand, it has increased remarkably in peripheral countries by around 3 percentage points. The statistically relevant dimension of this change suggests that a perverse structural break in the level of the NAIRU has indeed occurred in the periphery following the financial and sovereign debt crisis.
Once accepted that changes in the NAIRU may play a significant role in determining the level, if not the growth rate, of potential GDP (see Anderton et al., 2014), it is important to identify which factors may determine the NAIRU itself. In the next section, we will address this point by testing which factors have contributed most to the relative dynamics of the NAIRU in the core and in the periphery of the eurozone.
Secular stagnation and the NAIRU in core and peripheral eurozone countries
There are contesting theories about the determinants of the NAIRU. In this section, we test the contribution of these alternative theories in the core and the periphery of the eurozone. Our econometric analysis extends the previous empirical contributions by Stockhammer and Klär (2011), and Heimberger et al. (2017). We estimate a model with four sets of explanatory variables. First, we consider institutional labour market-related variables. According to mainstream theory, these factors might impact the NAIRU by increasing the rigidity of the labour market. Second, we consider a range of ‘macro shock’ variables (Blancard and Wolfers, 2000; Stockhammer and Klär, 2011) such as the long-run real interest rate, changes in terms of trade and the TFP growth rate. The long-term interest rate may contribute to the NAIRU by affecting capital accumulation. In a core-periphery perspective, it may also capture the uneven effects of ECB monetary policy in different sets of eurozone countries. Terms of trade and TFP shocks are usually interpreted as supply shocks that may impact the NAIRU via wage bargaining and/or price setting rules. In the specific context of the eurozone, the terms of trade variable may also control for the relative importance of price-competitiveness in influencing economic performance, and hence the NAIRU, in core and peripheral economies. Third, the ‘Keynesian’ demand components of our analysis are represented by investment demand, as measured by the gross rate of capital formation, and the fiscal policy stance, here gauged by the cyclically adjusted primary balance. While the inclusion of the former is standard practice in the analyses about the NAIRU, the consideration of a fiscal policy variable is a novel contribution. After 2010, the implementation of fiscal austerity has been a distinguishing feature of policy making in the eurozone. By incorporating a fiscal policy variable in our econometric analysis, we test whether fiscal austerity, together with the decline in capital accumulation, may have increased the NAIRU, depressed potential GDP and eventually caused secular stagnation. As discussed in previous sections, we finally extend the set of explanatory variables by considering country-specific technological capabilities as a structuralist factor influencing the NAIRU.
Data and estimation methodology
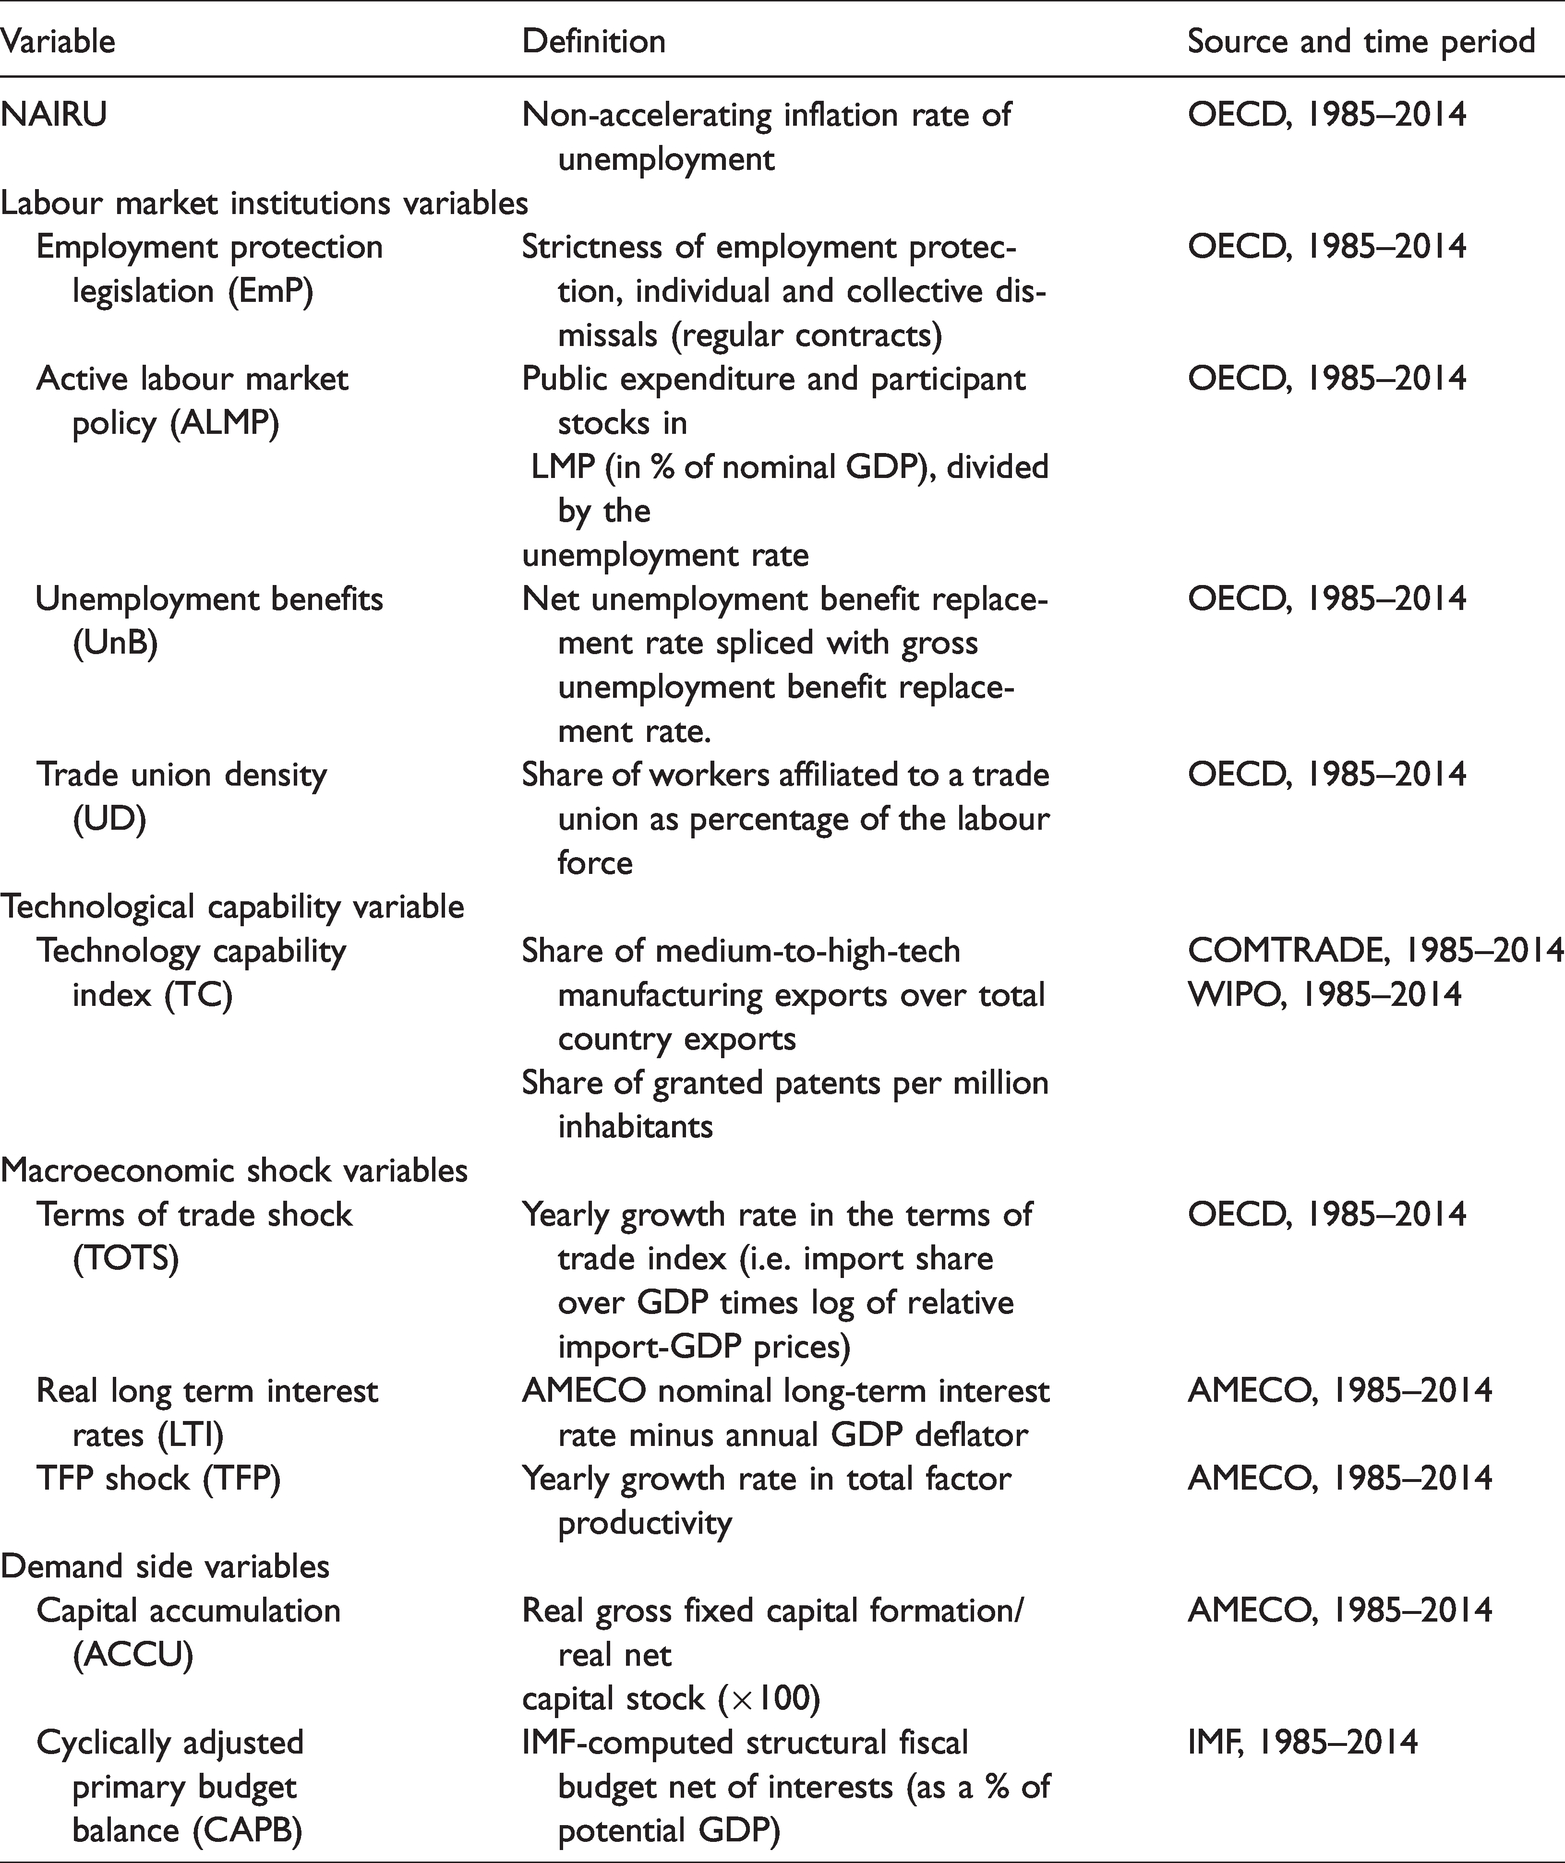
The data for institutional factors are based on the OECD dataset about labour market variables. To keep data source homogeneity as high as possible, we also use the OECD estimations for the NAIRU, the unemployment rate and TOTS shocks. Data for the long-term real interest rate, capital accumulation and TFP growth are in turn collected from AMECO. None of the abovementioned datasets provide data for cyclically adjusted primary balances (CAPB) over a sufficiently long time period. Hence, we calculate CAPB in the eurozone as structural government budget balance minus net interest payments, as a ratio to potential GDP, using data provided by the IMF. Table 2 provides the full list of variables and related sources used in our analysis, while Table 4 provides a summary of descriptive statistics.
List of variables in the regression analysis: Definition, data source and time spell.
In this paper, we extend the period of analysis in Heimberger et al., (2017), which covered the period from 1985 to 2012. Our regression model uses data for the period of 1985–2014. 2014 is the last year for which comprehensive information about labour market institutions are available. Due to the lack of data for CAPBs for the full sample, estimations including CAPB are based on an unbalanced dataset.
Before proceeding with the estimation of the model, we first checked for the presence of unit roots. Results from the Fisher test 13 (see Table 5 in Appendix 1) reject the null hypothesis for the presence of unit roots at 1 per cent confidence level for all the variables but Employment Labour Protection measures (EmP). In the case of EmP, the null hypothesis is rejected at 5 per cent confidence level. Panel data may also be characterized by heteroskedasticity, cross-sectional dependence and autocorrelation. In order to check for these features, we run the Woolridge, Pearson and LR Maximum likelihood tests (see Table 6). They all confirm the presence of heteroskedasticity, cross-sectional dependence and autocorrelation. As a consequence, we follow Orlandi (2012) and Heimberger et al. (2017) and adopt an Ordinary Least Square Panel Data Corrected Standard Error (OLS-PCSE) estimation method. According to Beck and Katz (1995), this methodology is well suited when dealing with panel data where the time dimension is not much larger than the cross-section size. It ensures that our estimations and significance analysis are appropriately corrected for the presence of cross-sectional dependence, heteroskedasticity and autocorrelation.
For the sake of comparability, we maintain a similar structure of the regression model with respect to Orlandi (2012) and Heimberger et al. (2017), as well as to Blancard and Wolfers (2000), and Stockhammer and Klär (2011). In line with these contributions, we do not include a lag of the NAIRU or of the unemployment rate in our main specifications. Nonetheless, we do include the first lag of the actual unemployment rate as an additional explanatory variable in a robustness check of our main findings. The inclusion of the lagged unemployment rate allows us to control for the fact that the NAIRU is a rather persistent variable that is not likely to move strongly from one year to the other. We include the lag of the actual unemployment rate rather than the lag of the NAIRU for three reasons. Firstly, including the lag of the NAIRU would result in Nickell bias, given our use of country fixed effects (Nickell, 1981). While in theory this problem could be addressed by using a GMM estimator which instruments the lag of the dependent variable, practically GMM cannot be used on our sample due to the small N and large T. We use the lag of the actual unemployment rate as an instrument for the lag of the NAIRU. Secondly, unlike the NAIRU, the actual unemployment is not subject to filtering that, by construction, correlates past values to contemporaneous values of the NAIRU. Thirdly, the lag of the actual unemployment rate more intuitively captures hysteresis in the evolution of unemployment records, as hysteresis refers to the persistent effects of past actual unemployment shocks on current unemployment and, therefore, the NAIRU.
Equation (3) shows the full model we estimate to analyse the determinants of the NAIRU in core and peripheral eurozone countries: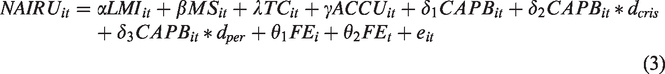
LMIit is a vector of labour market institutions for country i in time t including employment protection legislation (EmP), active labour market policies (ALMP), trade union density (UnD) and the unemployment benefit replacement rate (UBR). 14 Table 5 in Appendix 1 provides a detailed description of the variables and data sources. MSit is the vector of macro shock variables (i.e. the level of the real long-term interest rate (LTI), the growth rate of total factor productivity (TFP), and the growth rate of terms of trade (TOTS)). TCit is the technology capability index. 15 Finally, ACCUit and CAPBit represent the demand-side factors: capital accumulation and fiscal policy stance, respectively. The fiscal policy variable is also interacted with the dummy variable dcris, which is equal to 1 during 2008–2010, and zero otherwise. At the peak of the financial crisis, eurozone governments implemented costly bail-out plans of financial institutions. These measures led to deep public deficits and significantly worsened CAPB without preventing a rise in unemployment (they might have tamed its increase with respect to the ‘hypothetical’ counterfactual scenario with no bail-out). 16 A ‘spurious’ negative correlation between a lower CAPB and a higher NAIRU is likely to emerge in the midst of the financial crisis. The interaction dummy checks for the significance of this possible bias and helps to remove it from the correlation between fiscal policy and the NAIRU that would emerge in ‘normal’ times. Following Stockhammer and Klär (2011), Orlandi (2012) and Heimberger et al. (2017), we also include time-fixed effects (FEt) and country-fixed effects (FEi).
Estimation results
We estimate three different sets of estimations. The first set of estimations (I, I.C and I.F) includes labour market institutions and the technology capability index only. Specification (I) refers to the full sample of eurozone countries. Specification (I.C), in turn, focuses on core economies, while specification (I.F) looks at peripheral eurozone countries. The second set of estimations (II) expands the set of explanatory factors by considering macro-shock variables and capital accumulation for the full sample (estimation II), for core countries (II.C) and for peripheral economies (II.P), respectively. Estimations (III)–(IV) introduce the fiscal policy variable. In estimation (III), we add the fiscal policy variable to the set of explanatory variables while not considering the technology capability index. In regression (IV), we take both factors into account. Due to the reduced availability of observations, we run this set of regressions for the full sample only. However, we consider an additional dummy variable (dper) which, once interacted with CAPB, may capture periphery-specific effects of fiscal austerity. 17 Table 3 reports the results of our main estimations. As a robustness check, we re-estimate these specifications including the first lag of the actual unemployment rate. The results of such a robustness check are presented in Table 7.
Estimation results – Correlation between labour market institutions, technological capabilities and demand factors and the NAIRU, 1985–2014.
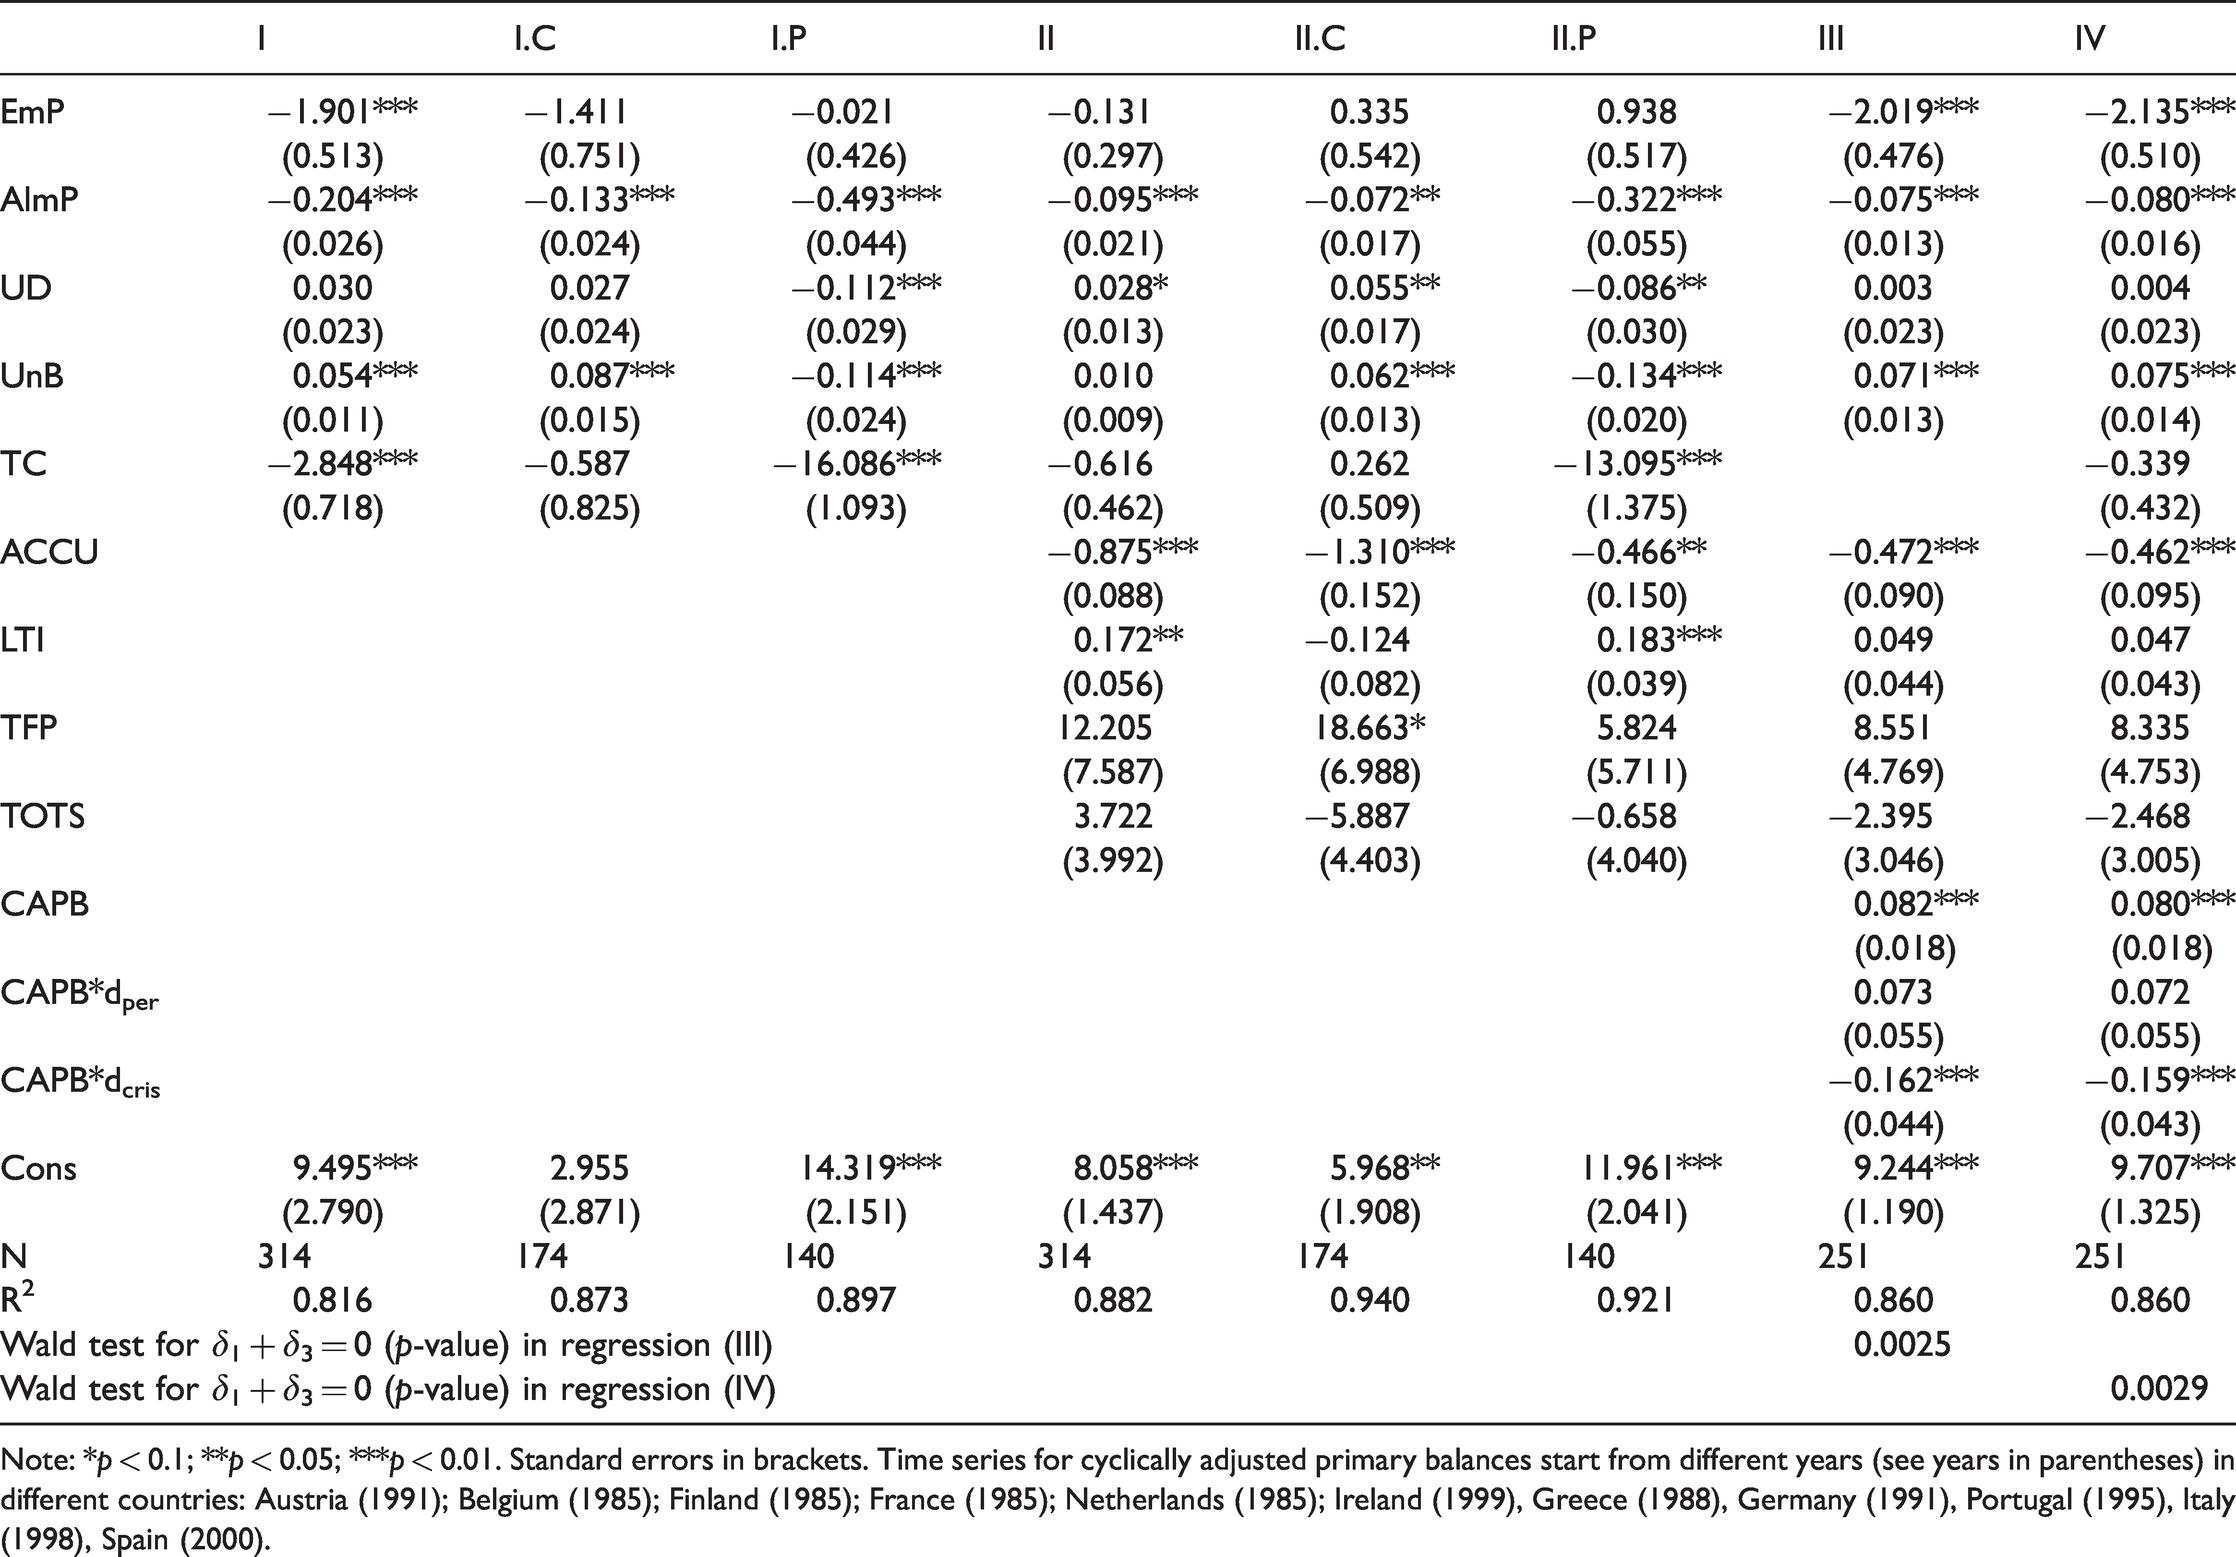
Note: *p < 0.1; **p < 0.05; ***p < 0.01. Standard errors in brackets. Time series for cyclically adjusted primary balances start from different years (see years in parentheses) in different countries: Austria (1991); Belgium (1985); Finland (1985); France (1985); Netherlands (1985); Ireland (1999), Greece (1988), Germany (1991), Portugal (1995), Italy (1998), Spain (2000).
The coefficients of the regression analysis reported in the first three columns tell us that technological capabilities are negatively correlated with the NAIRU, as expected. An increase in the technological capability of an economy may thus reduce the NAIRU. This effect seems to be statistically significant for the regression over the full sample, and for the periphery in particular. It is not significant, albeit with the correct sign, for core countries. This fact could be related to a sort of threshold effect in the accumulation of technology: its virtuous effects over the NAIRU may tend to weaken once a certain level of technological capability is achieved.
The inclusion of the technological capability index in our regressions seems to bring some changes in the effects usually attributed to some labour market institutions by mainstream theory, and indeed found in a standard ‘mainstream-type’ model considering LMIs variables only. 18 More specifically, our analysis seems to reveal an asymmetry in the way trade union density (UD) and unemployment benefits (UnB) correlate with the NAIRU in the core and in the periphery, respectively. While higher values for (UD) and (UnB) are positively correlated with the NAIRU in the core, the opposite happens in the periphery. The rationale for this result could be due to the fact that, as previously stressed by Storm and Naastepad (2015a, 2015b) in technologically weaker economies, domestic sources of demand play a leading role in the generation of employment opportunities. In these economies, labour market institutions that help to increase wages, stronger union density and more generous unemployment benefits among others, could stimulate sustained growth and fast productivity dynamics, eventually reducing the NAIRU. Policies aiming at internal devaluation, instead, may exacerbate economic stagnation and raise the NAIRU. At the same time, following Hartmann et al., (2017), low (high) levels of technological capabilities may be associated with lower (higher) levels of union density and unemployment benefits. 19 In the end, our findings tend to suggest that the role played by labour market institutions in influencing the NAIRU cannot be taken in isolation from other fundamental factors such as the level of technological capabilities characterizing an economy. The inclusion of the technological capability index in our regression analysis may help to capture the interplay of these factors in influencing the NAIRU.
Table 3 also reports the results from the expanded regressions (II), (II.C) and (II.P) where macro shocks variables and capital accumulation are added to the picture. Consistent with Stockhammer and Klär (2011) and Heimberger et al. (2017), capital accumulation always displays a negative and statistically significant correlation with the NAIRU through all the regressions. The coefficient associated to the long-term real interest rate (LTI) is positive and statistically significant in the full sample regression (II). This outcome is consistent with economic theory: an increase in the long-term real interest rate may discourage capital accumulation and hence, increase the NAIRU. When we split the sample into core and periphery, results are more nuanced. LTI’s coefficient remains positive and significant in the periphery (regression II.P), but is insignificant (and with a negative sign) in the core. We interpret these results as evidence of diverging financial and monetary conditions in periphery and core eurozone countries since 2008. In core economies, net capital inflows partially related to the repatriation of capital previously invested in the periphery led to reduced, even negative, long-term interest rates, while the periphery suffered from financial turmoil and the sovereign debt crisis. Implicitly, our results seem to suggest that ECB’s monetary policy was initially ineffective in avoiding the fragmentation of eurozone financial markets and in levelling the ‘financial’ playing field among core and peripheral eurozone countries. Such core-periphery financial asymmetry likely contributed to deepen economic stagnation and raise the NAIRU in the periphery.
When we include capital accumulation, the effect of technological capability on the NAIRU at the aggregate level becomes insignificant, albeit it maintains the expected negative sign. This might be due to the fact that the technological capability of a country and capital accumulation is somehow positively correlated, 20 as capital accumulation has both a supply and demand effect on the NAIRU (see Stockhammer and Klär, 2011: 443). On the one hand, the more technologically advanced a country, the stronger may be the incentives to invest. On the other hand, as to the supply side effect of capital accumulation, technological progress is likely to be embedded, at least partially, in new capital goods, so that capital accumulation may capture some of the explanatory power associated to technology. We corroborate this interpretation by re-estimating regression (II) in Table 3 by excluding capital accumulation. As expected, we find that the effect of TC is negative and significant. For the sake of space, we do not include the outcome of this regression in this paper, but results are available from the authors on request. In regression (II.P), the effect of technological capability on the NAIRU remains significant in the periphery of the Eurozone even with capital accumulation included in this specification, reinforcing the suggestion that technology may display non-linear effects on the NAIRU, which are particularly strong in (relatively) technology less advanced economies.
The terms of trade variable TOTS are always insignificant (and with mixed signs) throughout all the regressions. Contrary to what claimed by Sinn (2014) and consistent with Storm and Naastepad (2015a), this could be taken as a sign of the irrelevance of price-competition in explaining economic decline in the periphery. Technological capabilities perhaps related to non-price competitiveness seem to be much more prominent factors in the periphery instead. The coefficient associated to the TC index remains strongly negative and significant in regression (II.P), while it is insignificant for the full sample (with the expected negative sign) and in the core (with a wrong positive sign).
Finally, the effects of some labour market institutions are not robust and often at odds with what mainstream theory would expect. Active labour market policies (AlmP) are the only one consistently displaying the expected negative effect over the NAIRU. Employment protection policies (EmP), instead, are insignificant in most of the regressions. Regressions (II.C) and (II.P) reinforce our findings as to the asymmetric role of trade union density (UD) and unemployment benefits (UnB) in core and peripheral economies.
The final two columns in Table 3 present the results obtained when the full list of explanatory factors is considered, and CAPB is included as the fiscal policy-related demand variable. In regressions (III) and (IV), the correlation coefficient of fiscal policy displays the expected positive sign and is statistically significant across the full sample of eurozone countries. Fiscal austerity, i.e. increases in the cyclically adjusted fiscal primary balance, might raise the NAIRU. Once again, demand side factors matter in the determination of the NAIRU. The effect of CAPB on the NAIRU might become stronger in the periphery of the eurozone. The Wald test confirms that the overall contractionary effects of fiscal austerity in the periphery (i.e. δ1 + δ3 = (0.155; 0.152)) is statistically different from zero although δ3, taken alone, is not. This result can be taken as complementary to the findings of Delong and Summers (2012), and Fatas and Summers (2018) about the permanent effects of fiscal austerity on actual and potential GDP. It also provides direct support to Jump and Stockhammer (2019) when they claim that demand shocks likely affect the NAIRU.
In Table 3, the interacted dummy variable CAPB * dcrisis for the peak years of the financial crisis is statistically significant with the expected negative sign. This is likely related to the fact the financial shock may be source of a spurious relation between CAPB and the NAIRU in those years. In fact, the crisis jointly led to the deterioration of the cyclically adjusted primary balance through bail-outs to the financial sector, and to an increase in the NAIRU.
The introduction of the fiscal policy variable in regressions (III) and (IV) significantly reduces the coefficient associated to capital accumulation. It remains negative and statistically significant, but with a much lower absolute value. One potential explanation for this is that fiscal austerity may directly curtail public investment and, hence, cause a rise in the NAIRU. Furthermore, in a recession, fiscal expansion may tame the reduction in economic activity and encourage entrepreneurs. Fiscal austerity may instead exacerbate the recession and spread ‘pessimistic’ expectations, leading businesses to downsize investment further and cause an escalation in the NAIRU.
Technological capability remains insignificant at the aggregate level in estimations (III) and (IV). This insignificance is driven again by the inclusion of capital accumulation. When we re-estimate regressions (III) and (IV) without the capital accumulation variable, the effect of technological capability on the NAIRU is negative and significant.
Table 7 shows that our results are robust to alternative specifications. Estimations (i–iv) include the lagged value of the unemployment rate to control for the persistent endogenous effects of actual unemployment on the NAIRU (i.e. hysteresis). The novel findings of this paper are robust to these specifications. Fiscal policy and technological capability are always significant and with the expected signs. In fact, once we include the lag of the unemployment rate, the technological capability index shows a significant and negative correlation with the NAIRU both in the core and in the periphery, its coefficient remaining significantly bigger (in absolute terms) in the latter than in the former.
We can gauge the economic relevance of the above statistical findings by computing the elasticity associated to the most relevant explanatory variables included in our analysis. We do so by using the coefficients reported in Table 3 together with the mean values of the variables at stake. Taking the full-sample regression (IV) as our main point of reference, technological capability, employment protection policies and capital accumulation all have similar elasticities. A 1 per cent increase in each of these variables may lead to about a 0.4–0.6 percentage reduction in the NAIRU. By looking at peripheral eurozone countries more specifically, the prominent role of technological capability stands out. According to our estimation, a one percentage increase in the level of technology characterizing these economies may lead to a reduction in the NAIRU from 1.57 up to 1.92 per cent.
Fiscal policy, albeit statistically significant and not negligible, plays a much less relevant economic role. In the periphery, an expansionary fiscal policy in the order of a 1 per cent reduction in the cyclically adjusted primary balance may lead to a modest 0.01 per cent reduction in the NAIRU. This outcome seems to suggest that expansionary fiscal policies, albeit useful, cannot compensate for the negative effects that a lack of technology development and low investment have on the NAIRU. Accordingly, policy makers should focus their attention to the possible synergies between fiscal policy, capital accumulation and improvements in a country’s technological capability. Fiscal expansions aimed at supporting public investment and industrial policy that crowds-in private investment and the accumulation of technological knowledge may significantly contribute to a reduction in the NAIRU.
Conclusions
In this paper, we address the problem of secular stagnation in the eurozone in the aftermath of the 2007–2008 financial and economic crisis. We adopt a core-periphery perspective to address this issue, to analyse whether secular stagnation manifested itself with different degrees of intensity in the core and the periphery of the eurozone.
We find that secular stagnation, i.e. a statistically significant slowdown in the dynamics of potential GDP, is a eurozone-wide problem. The depth of the problem, however, differs remarkably in the core and in the periphery, and the emergence of diverging trends is clear. After 2008, the dynamics of potential GDP slowed down dramatically more in peripheral countries than in the core. In the same vein, while the NAIRU did change in the latter, it has risen dramatically in the former. Post-crisis NAIRU in the periphery is now twice that observed in the core.
Given this evidence, we then investigate the determinants of the NAIRU in both sets of countries. Capital accumulation is always significant in all specifications and in all sets of eurozone countries. The fiscal policy stance also matters. In normal times, austerity measures may increase the NAIRU directly, by cutting public investment, and indirectly, by depressing entrepreneurs’ animal spirits and private investment even further. Both facts show that demand-side factors might be extremely relevant, if not major determinants of the NAIRU.
We also find that ‘supply-side’ factors matter in the determination of the NAIRU. However, while mainstream theory focuses on labour market institutions determinants, we find that the technological capability of an economy plays a much clearer role in explaining the NAIRU, particularly in the periphery of the Eurozone. We also find that technological capability may affect the NAIRU by reshaping the way some labour market institutions correlate with the NAIRU itself. In this regard, labour market institutions, when significant, do not display consistent effects on the NAIRU throughout core and peripheral economies, and their effects may often be at odds with what is suggested by mainstream theory. For instance, stronger union density and more generous unemployment benefits may help to reduce the NAIRU in peripheral economies.
There are several important policy implications of these findings. First, eurozone cross-country heterogeneity in labour market institutions does not explain the cross-country post-crisis heterogeneous changes in the NAIRU. What seems to be more relevant, at least for peripheral countries, is the level of technological capability, and the macro conditions enabling such countries to implement expansionary policies boosting demand. In technologically weaker peripheral economies, internal demand is relatively more important than external demand as a source of employment and economic dynamics. As a consequence, the exposure of peripheral eurozone countries to much more volatile financial turbulences and the implementation of fiscal austerity may explain most part of post-crisis eurozone core-periphery divergence. Second, the persistent emphasis of EU institutions on labour market deregulation as the main way to reduce and homogenize the NAIRU across eurozone countries looks misplaced and even counterproductive. In our view, two different sets of policies are far more urgent and important. On the one hand, the asymmetric responses of core and peripheral eurozone countries to common shocks have their roots in long-lasting differences in technological capabilities. It is of paramount importance to first reduce the core-periphery technological gap via long-term industrial policies. On the other hand, European policy makers should better look at reforms ensuring homogeneous macro-financial conditions across eurozone countries and avoid the exposure of the periphery to fierce financial turbulences. The completion of the eurozone banking union and the creation of a central fiscal authority are in order. Such macro reforms, together with industrial policies targeting the persisting eurozone core-periphery technological gap, are the only credible responses to the centrifugal forces (and the ensuing uneven development), that were dormant before 2008 but awoken by the financial crisis.
Footnotes
Acknowledgements
The authors would like to thank Ozlem Onaran, Alexander Guschanski, Daniele Tori, Thomas Rabensteiner and the three anonymous reviewers for their insightful comments on earlier versions of this paper.
Funding
The author(s) received no financial support for the research, authorship, and/or publication of this article.