
Abstract
Background
While obesity is an established risk factor for osteoarthritis (OA), the differential impacts of regional body composition is not well understood. This study aimed to examine the associations of whole-body and region-specific (arms, legs, and trunk) fat-to-muscle mass ratio (FMR) with OA prevalence, as well as the mediating effects of systemic inflammation in this relationship.
Methods
Data from adults aged ≥40 years were collected from the 1999–2006 & 2011–2018 cycles of National Health and Nutrition Examination Survey. Total and region-specific FMR was assessed using dual-energy X-ray absorptiometry, with OA status determined by self-report. Logistic regression was used to analyze the associations between total or regional FMR and OA prevalence. Mediation analysis was conducted to determine the mediating effect of the systemic immune-inflammation index (SII).
Results
Among the 9,504 participants included, 953 (10.63%) had OA. The odds ratio (95% confidence intervals) for OA by arm, leg, trunk and total FMR were 1.122 (1.082–1.163), 1.156 (1.101–1.213), 1.142 (1.094–1.192), and 1.194 (1.131–1.260), respectively. Compared to the lowest quartile, the highest quartile of arm, leg, trunk, and total FMR had 75.4%, 115.7%, 113.6%, and 161.3% increased risk of OA, respectively. Restricted cubic spline curves indicated a linear relationship between leg, trunk and total FMR with OA. The discriminatory performances of FMR measures were modest (area under the curve 0.635–0.656). SII mediated 2.4%–2.6% of the association between FMR and OA.
Conclusion
A higher FMR in all body regions is associated with a higher risk of OA, which is partially mediated by systemic inflammation.
Keywords
Introduction
Osteoarthritis (OA) is a prevalent degenerative joint disorder that affects multiple joint structures, including the articular cartilages, subchondral bone, and synovial membrane. Clinically, OA manifests as chronic debilitating joint pain, stiffness, and functional impairment, most commonly in the knees, hips, hands and feet. According to the 2021 Global Burden of Disease Study, OA affects 7.6% of the world’s population, representing a 132.2% increase in total cases since 1990. 1 While multiple etiological factors contribute to OA, such as traumatic injury, metabolic derangements, and joint malalignment, obesity remains the most prevalent and modifiable risk factor. Studies indicate that a 5 kg/m2 increase in body mass index (BMI) elevates OA risk by 35%. 2 Notably, weight-loss interventions, including bariatric surgery, have been shown to substantially reduce OA risk. 3 However, BMI does not discriminate skeletal muscle mass from fat mass. Emerging evidence suggests that excess adiposity is metabolically harmful and promotes OA development. 4 In contrast, skeletal muscle plays a protective role by distributing mechanical load across joints. Low muscle mass and reduced muscle strength may disrupt joint biomechanics, accelerating degenerative changes. 5
The fat-to-muscle mass ratio (FMR) is an emerging anthropometric index that quantifies the balance between adiposity and muscle mass, capturing their opposing metabolic effects. Accumulating evidence suggests that elevated FMR is strongly associated with an increased risk of cardiometabolic diseases, independent of BMI.6,7 Moreover, FMR offers a unique advantage over traditional measures by allowing for the distinct evaluation of the individual contributions of fat and muscle mass to disease risk.
To the best of our knowledge, the associations between whole-body and region-specific (arms, legs, and trunk) FMR and OA prevalence have not been investigated. In addition, previous studies have implicated systemic inflammation derived from the adipose tissue in OA pathogenesis. 8 Thus, we hypothesized that a higher FMR is related to an increased risk of OA, an association that is potentially mediated through systemic inflammation. To test this hypothesis, we analyzed data from the US National Health and Nutrition Examination Survey (NHANES) to examine the associations between whole-body and regional FMR with OA prevalence, as well as the mediating role of the systemic immune-inflammation index (SII).
Methods
Data source and study participants
The NHANES is an ongoing nationwide, cross-sectional survey conducted by the National Center for Health Statistics biennially to collect data from US children and adults through interviews, physical examinations, and laboratory measurements. The NHANES was conducted in accordance with the Declaration of Helsinki with ethical approval from the Research Ethics Board of the National Center for Health Statistics and informed consent was obtained from all participants.
In this study, we limited our study participants to the 1999–2006 & 2011–2018 cycles of NHANES. The 2007–2010 cycles were excluded due to unavailability of dual-energy X-ray absorptiometry data, which is essential for calculating FMR. We also applied the following exclusion criteria: (1) participants aged less than 40 years; (2) those with a history of cancer; (3) those with missing information on OA or dual-energy X-ray absorptiometry; and (4) those with missing covariates. This results in a final analytic sample of 9,504 individuals. Participant selection and exclusion process was presented in Figure 1. Study flowchart demonstrating the process of participant selection of US adults from the 1999–2006 & 2011–2018 cycles of National Health and Nutrition Examination Survey (NHANES). DXA, dual-energy X-ray absorptiometry. FMR, fat-to-muscle mass ratio.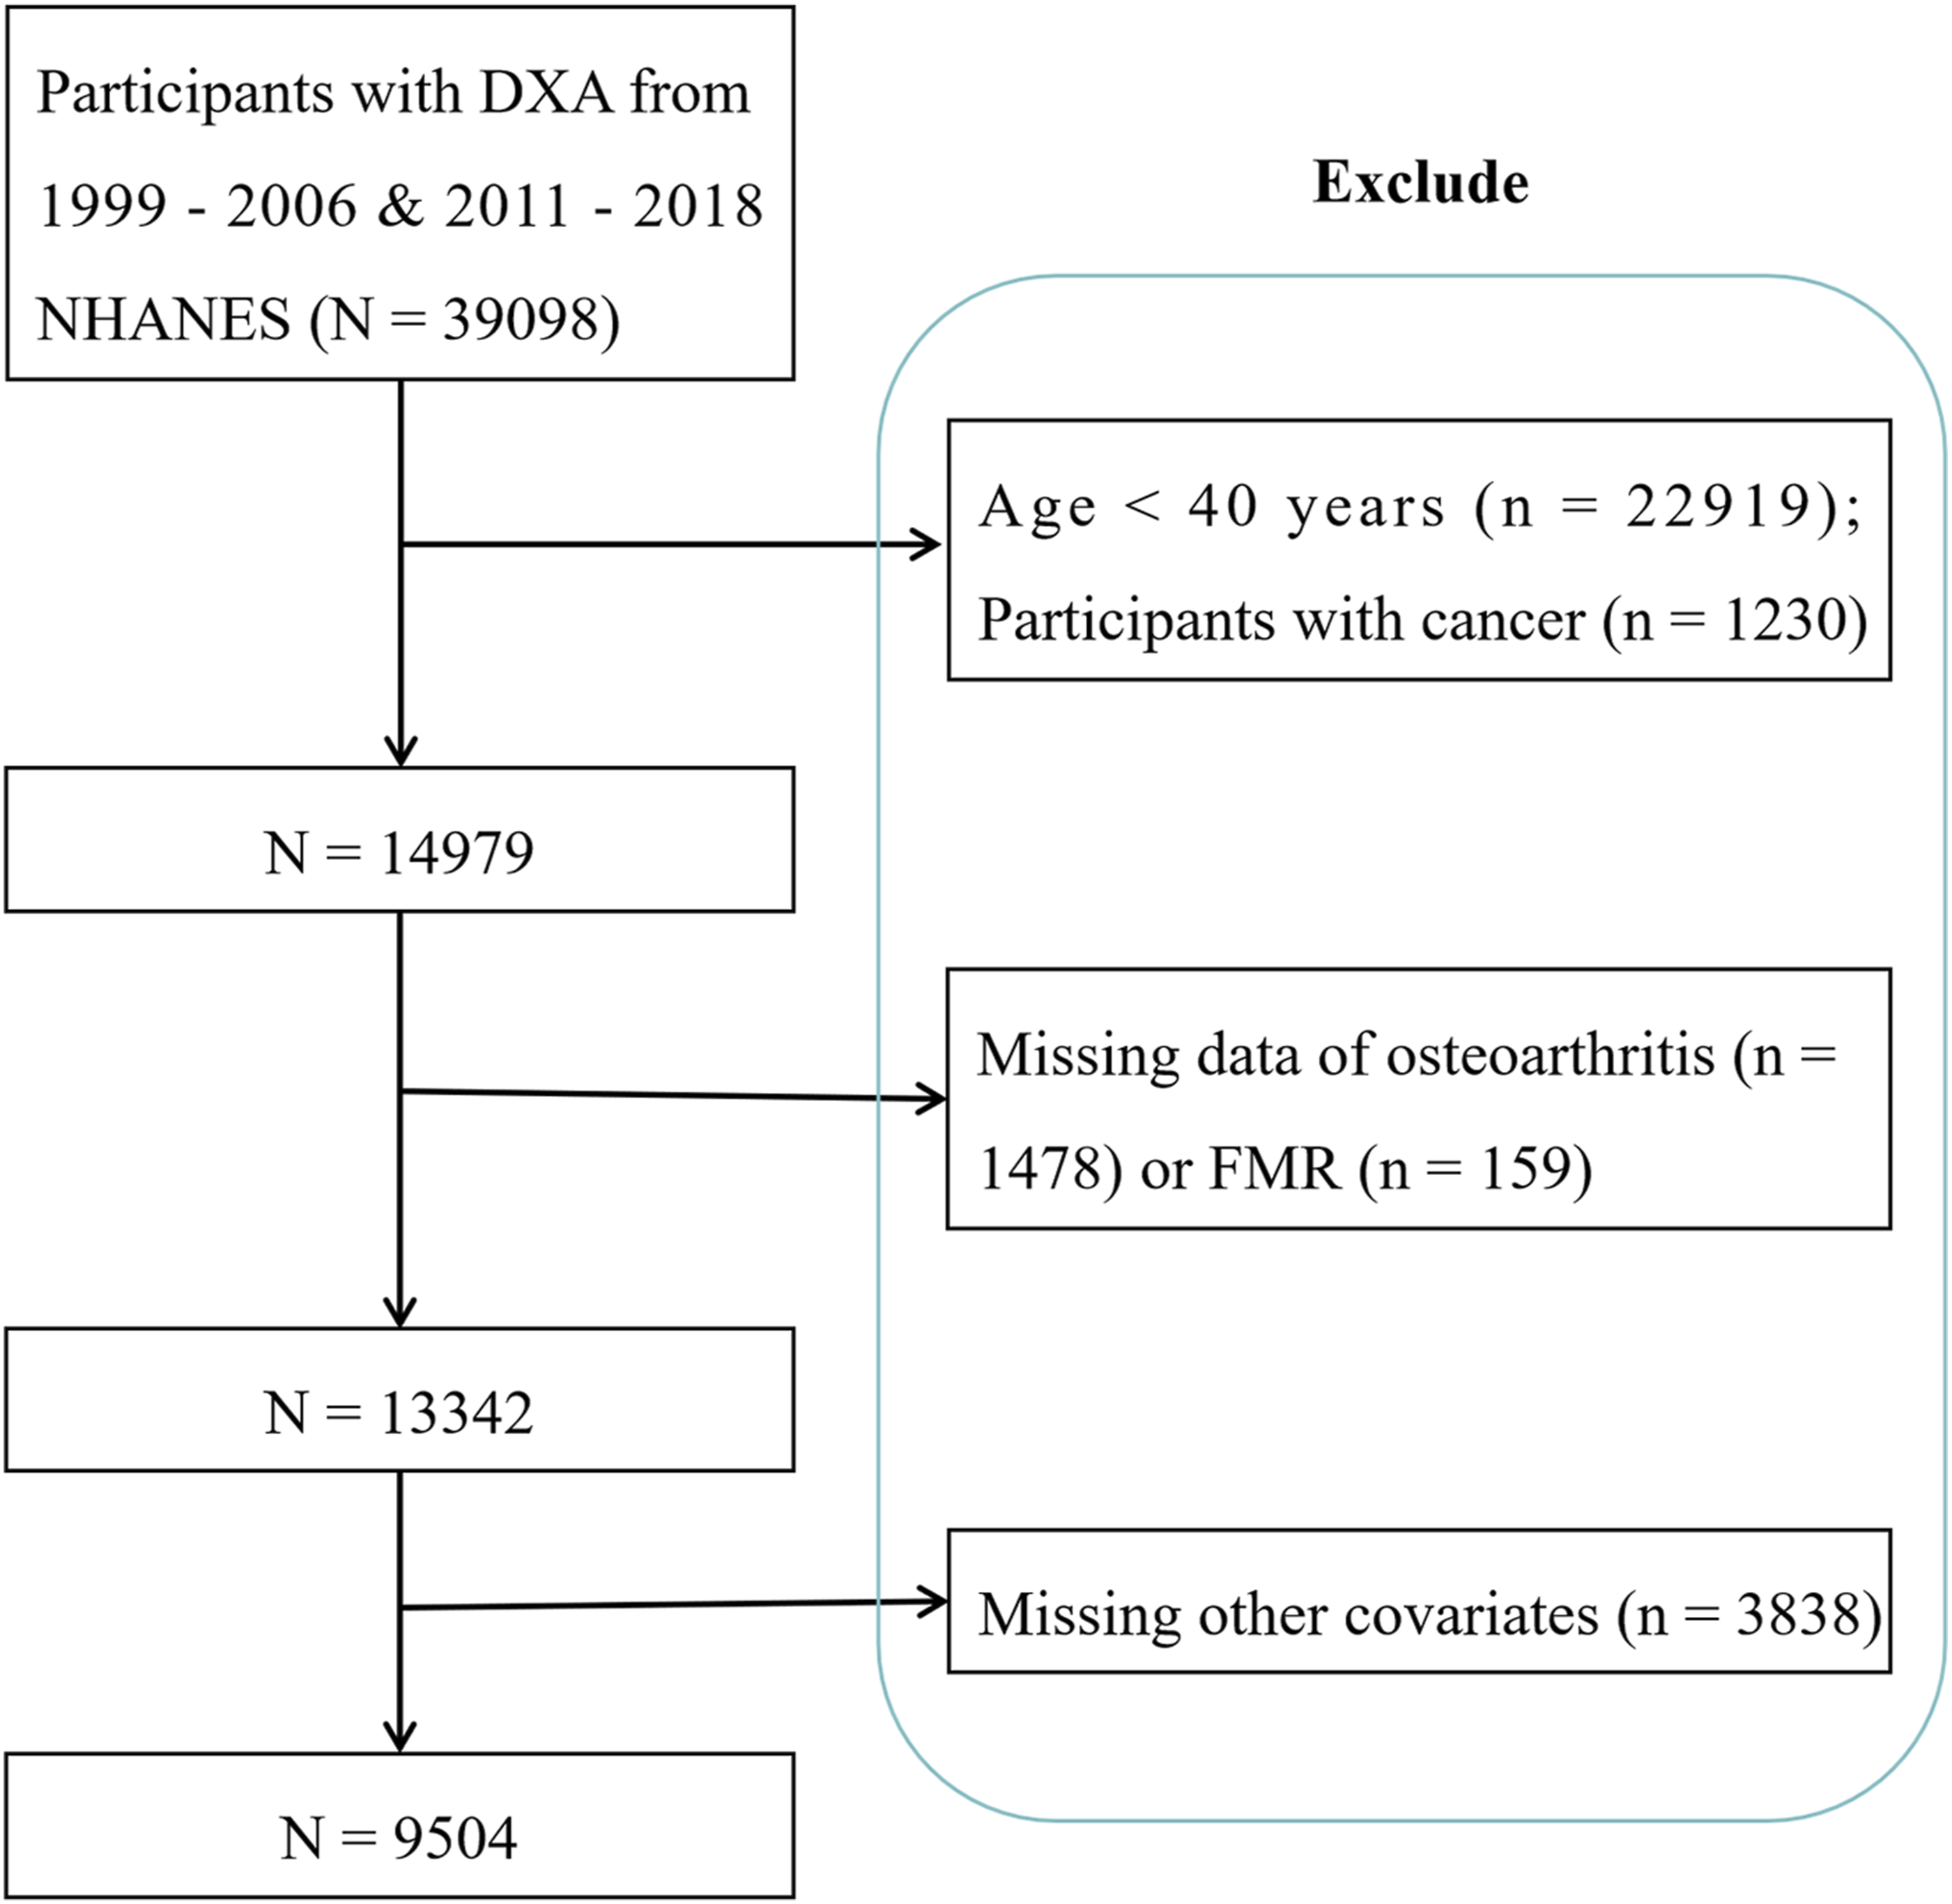
Assessment of OA
In accordance with previous investigations, 9 OA was determined by self-report, in which the interviewer first asked “Has a doctor or other health professional ever told you that you had arthritis?”, followed by “Which type of arthritis was it?”, if the participant responded “yes” to the first question. Individuals who reported “osteoarthritis” were considered to have OA, and those who reported no arthritis or other types of arthritis, such as rheumatoid arthritis or psoriatic arthritis, were considered to be OA-free. An earlier meta-analysis indicated that the pooled sensitivity and specificity for self-reported OA were 0.75 and 0.89, respectively. 10
FMR determination
Total and regional fat mass and lean soft tissue mass were measured using dual-energy X-ray absorptiometry, the current gold standard for clinical body composition assessment. The dual-energy X-ray absorptiometry-derived lean soft tissue mass represents a composite of skeletal muscle, body water, and connective tissues; therefore, it was employed as a practical, imaging-based proxy for skeletal muscle mass in this analysis. The FMR for each region was calculated as fat mass divided by this lean soft tissue mass.1 11 The dual-energy X-ray absorptiometry offers several advantages for large epidemiologic studies, including minimal radiation exposure, relatively lower cost, and a shorter scan time. All dual-energy X-ray absorptiometry scans were performed using Hologic QDR-4500A fan-beam densitometer (Hologic, Inc., Bedford, MA) with Apex 3.2 software following standardized protocols. Quality control included daily calibration scans using an anthropomorphic spine phantom to monitor for instrument drift, as well as weekly whole-body phantom scans. All radiological technologists were certified, and standardized positioning and scanning procedures were followed consistently across all examination centers. Consistent with NHANES exclusion criteria, participants were ineligible for this test if they were pregnant, had used radiographic contrast material in the past 7 days, or weighted over 450 pounds or height over 6’5”.
SII calculation
The SII was calculated as platelet count × neutrophil count/lymphocyte count, as reported previously.1 12 The complete blood count and differentials were measured using the Beckman Coulter DxH 800 instrument.
Covariates
Potential confounders were selected based on previous similar studies and clinical judgment.13,14 The covariates included participants’ age, sex, ethnicity, education level, marital status, family poverty-income ratio, smoking and drinking status, physical activity, comorbidities of hypertension (defined by self-reported diagnosis, measured blood pressure ≥140/90 mmHg, or anti-hypertensive use), diabetes (self-reported diagnosis, fasting glucose ≥126 mg/dL, HbA1c ≥ 6.5%, or 2-h post-load glucose ≥200 mg/dL, or glucose-lowering medication use), 15 and cardiovascular disease (self-reported coronary artery disease, myocardial infarction, congestive heart failure, angina or stroke history), and laboratory measurements of total cholesterol, high-density lipoprotein cholesterol, triglycerides, and statin use. Education level was categorized as below high school (less than 9th grade), high school (9–11th grade and high school graduate/GED or equivalent), and above high school (Some college or AA degree, College graduate or above). Smoking and drinking was defined according to previous studies. 16 Physical activity was categorized based on self-reported data from the NHANES Physical Activity Questionnaire. Participants were asked to report the frequency (days per week) and duration (minutes per day) of vigorous- and moderate-intensity activities performed during a typical week in the past 30 days. Vigorous activity was defined by the questionnaire as activities causing large increases in breathing or heart rate, such as running or aerobics, performed for at least 10-min bouts. Moderate activity was defined as activities causing small increases in breathing or heart rate, such as brisk walking or cycling for pleasure.
Statistical analysis
We applied appropriate sampling weights to mitigate the impact of multi-stage complex sampling design. Comparison of baseline characteristics between participants with and without OA were enabled by the Student’s t-test or chi-squared test, as appropriate. To explore the associations between total or regional FMR with OA prevalence, we calculated the odds ratios (ORs) and corresponding 95% confidence intervals (CIs) by using weighted logistic regression models. Overall, three logistic models have been established: the crude model was unadjusted; the Model 1 was adjusted for participant’s age, sex, ethnicity, education level, poverty-income ratio, and marital status; the Model 2 was further adjusted for smoking, drinking, physical activity, diabetes, hypertension, cardiovascular disease, statin use, and laboratory results of triglycerides, total cholesterol, and high-density lipoprotein cholesterol. Restricted cubic spline curves, adjusting for covariates listed in Model 2, were used to examine the dose-response relationship between total or regional FMR with OA prevalence. We also performed subgroup analysis stratified by participant’s age (<60 vs ≥ 60 years), sex (men vs women), physical activity (no vs moderate vs vigorous), diabetes (yes vs no), and ethnicity (non-Hispanic white vs non-Hispanic black vs Mexican Americans vs other Hispanics vs other). Receiver-operating characteristics curves were generated to calculate and compare the area under the curve for discriminating OA from non-OA by different predictors. Mediation analysis was performed using the R package “mediation” to explore the direct and indirect effects of FMR on OA prevalence mediated through SII. Statistical analyses were conducted using the R software, with statistical significance set at a P value <0.05.
Results
Comparison of baseline characteristics
Comparison of baseline characteristics of US participants with and without osteoarthritis.
CVD, cardiovascular disease; FMR, fat-to-muscle mass ratio; HDL, high-density lipoprotein cholesterol; OA, osteoarthritis.
Associations between FMR and OA prevalence
Associations between arm, leg, trunk and total fat-to-muscle mass ratio with the prevalence of osteoarthritis in US adults aged over 40 years from the 1999–2006 & 2011–2018 cycles of NHANES.

CI, confidence interval; FMR, fat-to-muscle mass ratio; OR, odds ratio.
Model 1 was adjusted for participant’s age, sex, race/ethnicity, education level, marital status, and poverty-income ratio;
Model 2 was further adjusted for smoking, drinking, physical activity, diabetes, hypertension, cardiovascular disease, statin use, and laboratory results of triglycerides, total cholesterol, and high-density lipoprotein cholesterol.

Restricted cubic spline curves showing the dose-response relationship between arm (a), leg (b), trunk (c), and total (d) fat-to-muscle mass ratio (FMR) with the prevalence of osteoarthritis in US adults aged over 40 years. The solid central line represents the estimated log odds ratio, and the shaded band represents the 95% confidence interval. The y-axis in all panels shows the log odds ratio, with a reference line at zero (indicating no association). The x-axes show the continuous measure of FMR for each specific region. P for overall assesses the significance of the total association, and P for non-linearity tests the deviation from a linear relationship. All models were adjusted for age, sex, ethnicity, education level, poverty-income ratio, marital status, smoking, drinking, physical activity, diabetes, hypertension, cardiovascular disease, statin use, and laboratory results of triglycerides, total cholesterol, and high-density lipoprotein cholesterol.
Subgroup analysis
The stratified analysis (Figure 3) showed that participants’ age, sex, ethnicity, physical activity, and diabetes status did not significantly modify the relationship between leg, total FMR and OA. Nonetheless, the association between arm, trunk FMR with OA were stronger in participants with no physical activity compared to those reporting moderate to vigorous physical activity. Relationship between arm (a), leg (b), trunk (c) and total (d) fat-to-muscle mass ratio with the prevalence of osteoarthritis in each subgroup. Forest plots display odds ratios (ORs) from stratified analyses evaluating the association of a one-unit increase in FMR with the prevalence of OA across different population subgroups. A reference OR of 1 (no association) is implied for each row. The P for interaction provides the P value testing for a statistical interaction between the subgroup variable and the respective FMR measure on the outcome.
Receiver-operating characteristic curve analysis
Receiver-operating characteristic curve (Figure 4, Table 3) indicated that arm, leg, trunk, and total FMR could all distinguish participants with OA from non-OA. The area under the curve values were modest (0.635–0.656), with the highest discriminative power observed for arm FMR and the lowest for leg FMR. Receiver-operating characteristic curves comparing the discriminative performances of osteoarthritis by total and arm, leg or trunk fat-to-muscle mass ratio. AUC, area under the curve. Results of the receiver-operating characteristic curves for discriminating osteoarthritis from non-osteoarthritis in US adults by different parameters. FMR, fat-to-muscle mass ratio.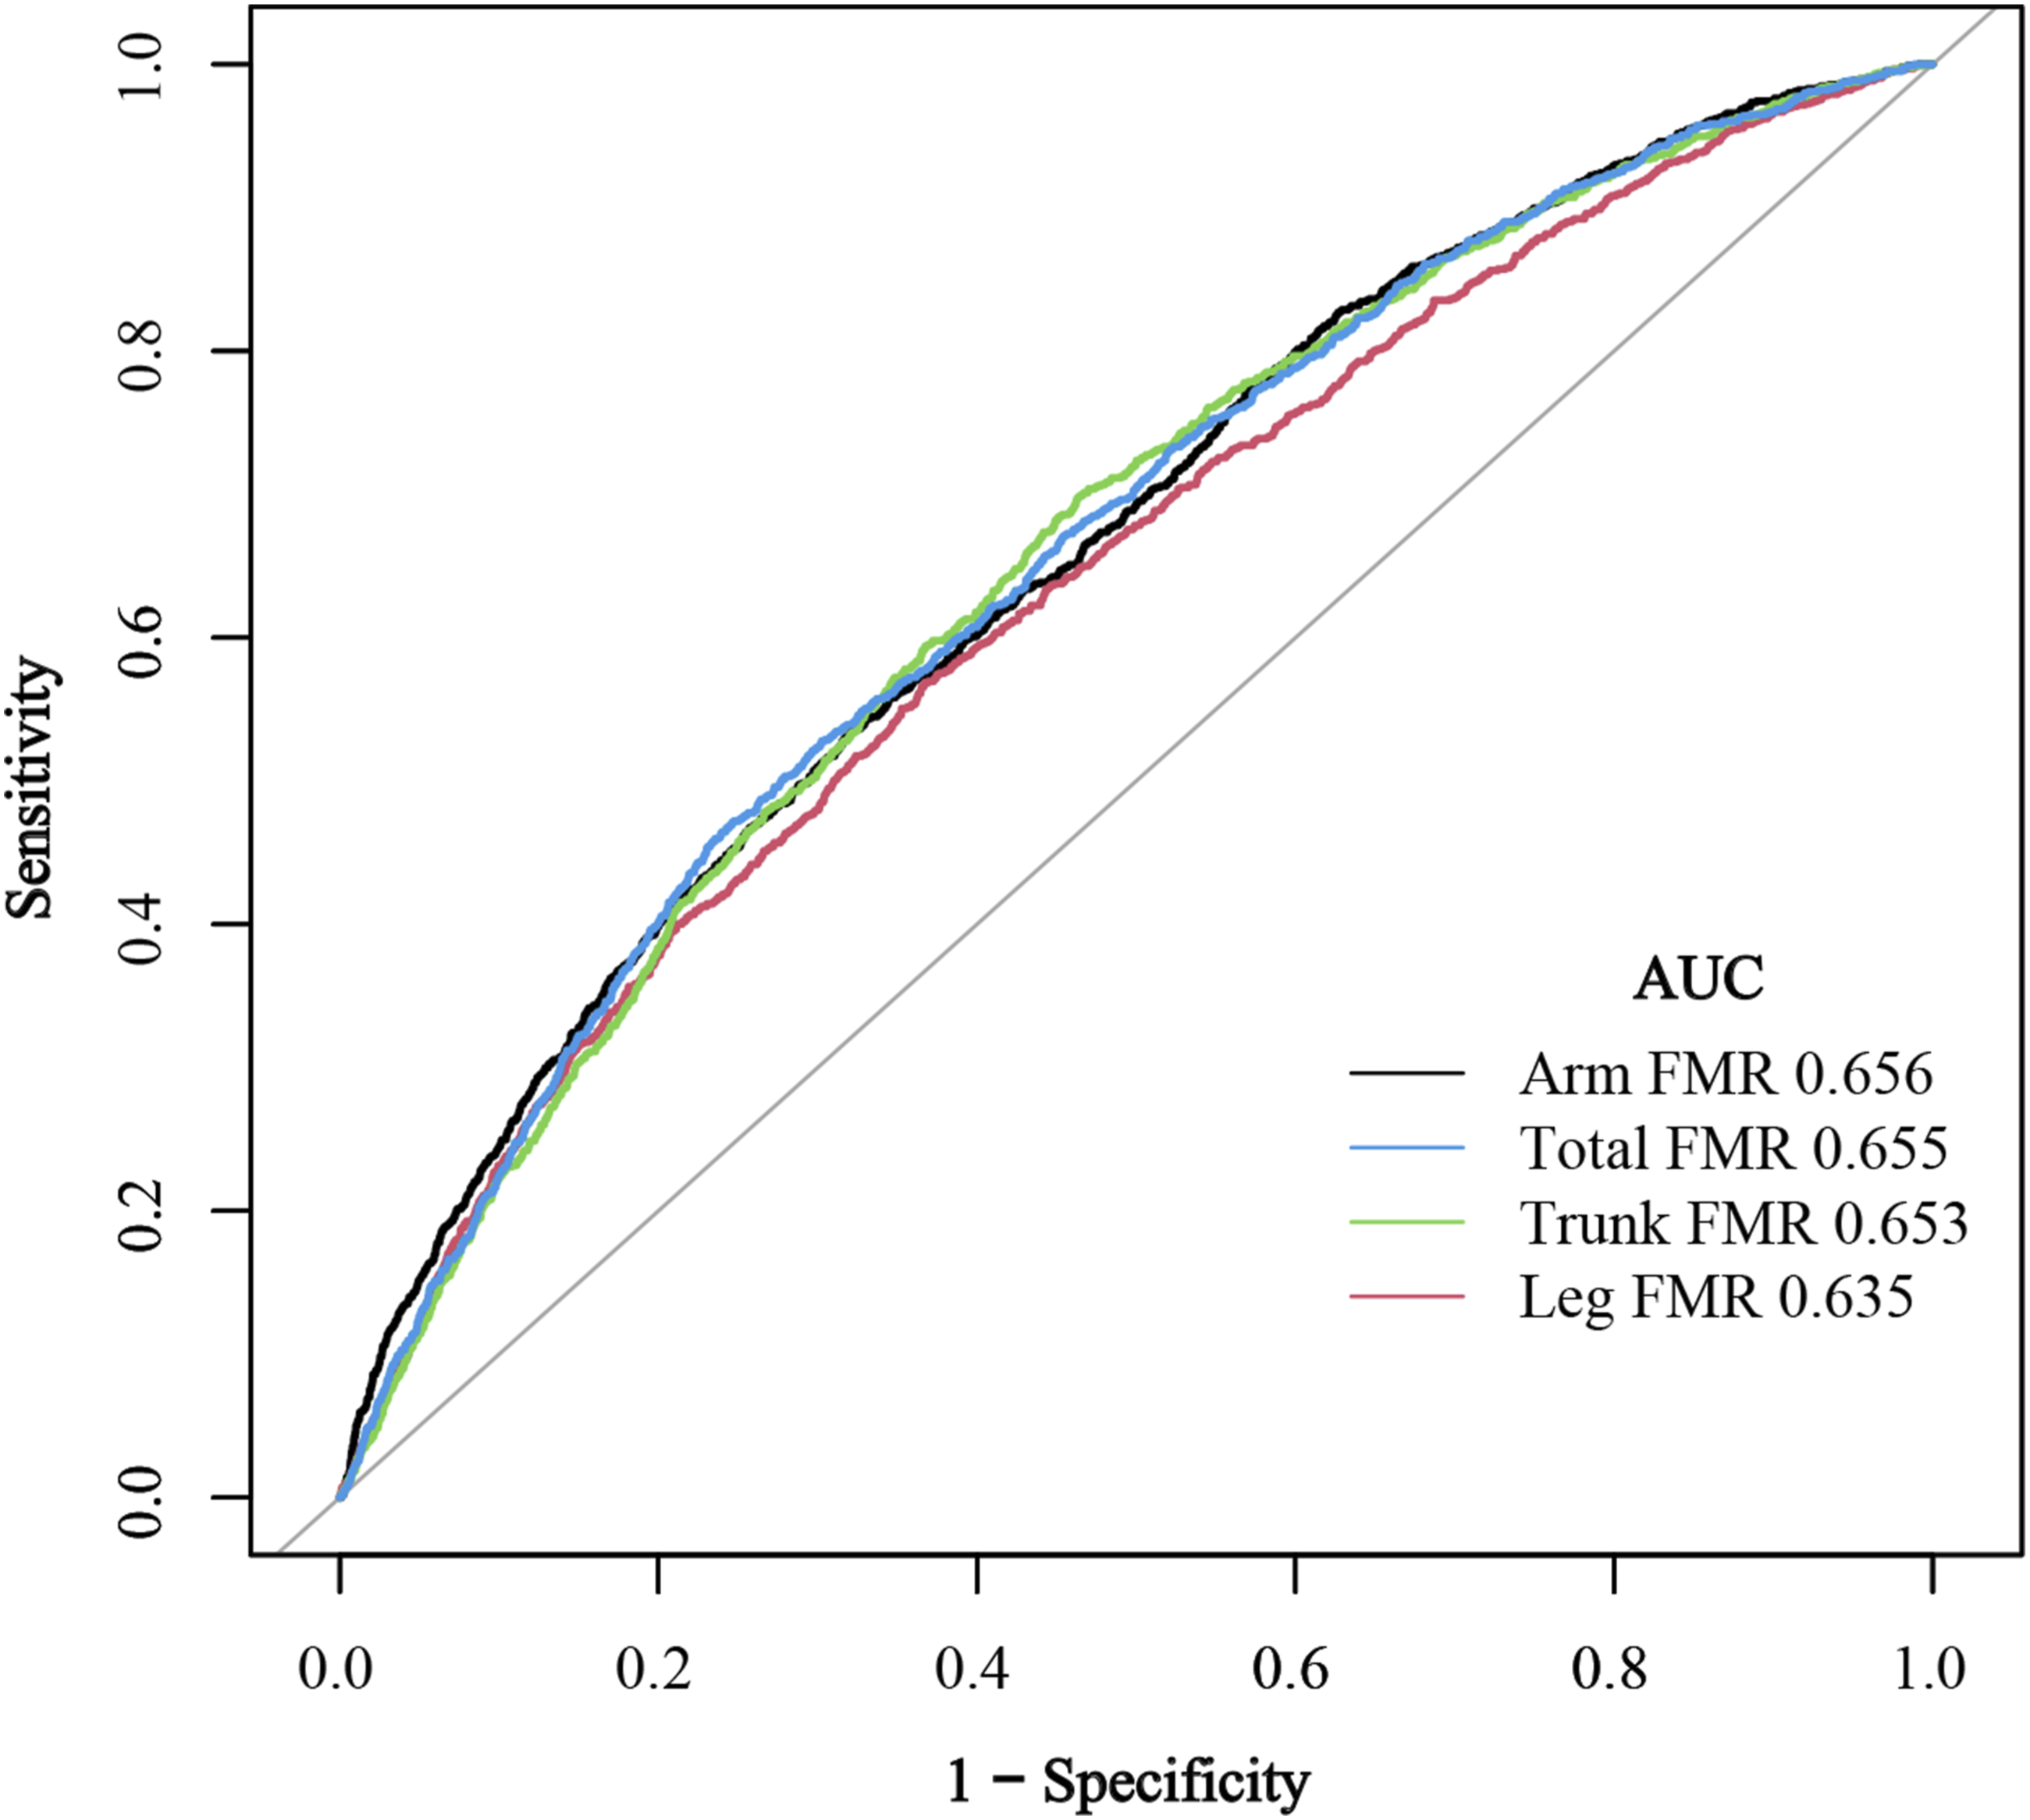

Mediation analysis
The mediation effect of systemic immune-inflammation index in the association between total and regional fat-to-muscle mass ratio and prevalence of osteoarthritis.

Discussion
By utilizing the large sample size of the NHANES, this cross-sectional analysis showed that a higher FMR in the whole body measurements and specific body compartments (arms, legs, and trunk) was associated with an increased odds of OA among US middle-aged and older adults. Notably, we observed a non-linear relationship between arm FMR and OA prevalence, with an inflection point at 0.50. In contrast, leg, trunk, and whole-body FMR exhibited positive linear associations with OA prevalence. Subgroup analyses revealed stronger associations between arm/trunk FMR and OA in physically inactive participants compared to those engaging in moderate-to-vigorous physical activity. Mediation analysis indicated that systemic inflammation, measured by SII, partially (2.4–2.6%) mediated the relationship between FMR and OA risk. These findings collectively highlight the differential contributions of regional body composition to OA pathogenesis, which may be partially mediated through systemic inflammation.
Obesity is a well-established independent risk factor for OA development. Beyond BMI, growing evidence implicates various adiposity biomarkers, such as body roundness index, conicity index, relative fat mass, weight-adjusted waist index, with an increased risk of OA.17,18,19 Our findings extend this understanding by demonstrating positive associations between FMR in all measured body regions (arms, legs, trunk, and whole body) and elevated OA risk. Historically, the association between obesity and OA has been ascribed to excessive mechanical stress; according to the “wear and tear” theory, increased body weight leads to failed repair of damaged joint tissue. Nonetheless, contemporary research reveals that fat and skeletal muscle exert divergent, tissue-specific effects on OA risk. Specifically, the fat mass is metabolically unhealthy and may contribute to OA risk not only through increased mechanical overloading but also via metabolic and inflammatory pathways that induce cartilage breakdown and synovial inflammation, such as through the release of leptin, interleukin-6, and tumor necrosis factor-α. 20 In comparison, a higher skeletal muscle mass, particularly in the lower limbs, is associated with a reduced risk of OA through mechanisms like enhanced joint stability, shock absorption, and even force distribution. 21 This dichotomy is exemplified in sarcopenic obesity, where concurrent high fat mass and low muscle mass synergistically elevate OA risk beyond either condition alone, highlighting the critical interplay between body composition components in OA pathophysiology. 22
The FMR represents a novel index that quantifies the antagonistic effect of fat mass and skeletal muscle mass. A key advantage of FMR is its ability to evaluate region-specific body composition patterns through dual-energy X-ray absorptiometry assessment. Accumulating evidence has linked elevated whole-body FMR with increased risk of various metabolic disorders, including insulin resistance, hyperuricemia, non-alcoholic fatty liver disease, hypertension, and cognitive impairment.23,24,25,26,27 Our findings expand this clinical spectrum by demonstrating significant associations between both total and regional FMR measurements and OA risk. These results underscore FMR as a useful epidemiological marker for body composition profiles associated with OA, suggesting that an unfavorable balance characterized by higher fat mass relative to lean mass is linked to joint health across anatomical compartments.
An interesting observation of the current study is the non-linear relationship between arm FMR with OA prevalence, in contrast to the linear positive associations observed for trunk, leg, and whole-body FMR. While the relationship between lower extremity muscle mass and risk of knee OA has been extensively studied, existing evidence remains inconsistent. For instance, Segal et al. found no protective effect of greater thigh muscle mass against radiographic or symptomatic knee OA, 28 whereas Veronese et al. demonstrated in a longitudinal cohort of 2,492 older adults that low lower-limb muscle mass independently predicted incident symptomatic knee OA. 29 In comparison, the roles of muscle and fat distribution in other anatomical regions (e.g., arms) in OA pathogenesis remain understudied. Our restricted cubic spline analysis revealed a significant inflection point at an arm FMR of approximately 0.50, beyond which OA risk escalated markedly. Two potential mechanistic explanations may account for this finding. First, this threshold may reflect a critical loss of functional muscle reserve. Upper body strength, particularly in the arms and torso, is essential for load redistribution during daily activities, use of assistive devices, and fall prevention, 30 all of which may be compromised by a high am FMR. Literature on disability thresholds suggests that muscle mass and function decline non-linearly with age. 31 Consequently, individuals above this arm FMR threshold may experience impaired ability to offload lower-limb joints during weight-bearing tasks and have diminished protective responses to prevent injurious movements, thereby potentiating aberrant joint loading and trauma. Second, an arm FMR exceeding 0.50 may represent a phenotypic threshold for sarcopenic obesity in the upper body. 32 Research indicates that sarcopenic obesity is associated with a disproportionately high release of pro-inflammatory adipokines and myokines, 33 creating a chronic low-grade inflammatory state that accelerates joint tissue catabolism.
The subgroup analysis indicated that the association between arm or trunk FMR and OA risk was more pronounced in participants with no physical activity, a finding that aligns with the report by Nishikori’s group that physical activity is inversely correlated with whole body and regional FMR. 34 Although the precise mechanisms underlying this effect modification require further investigation, current evidence points to several interrelated physiological and biomechanical pathways. First, physical inactivity is a well-established driver of systemic low-grade inflammation and adipose tissue dysfunction. 35 Consequently, in inactive individuals, a higher arm or trunk FMR may reflect not only increased mechanical load but also a state of elevated systemic inflammation. This creates a vicious cycle whereby inflammatory mediators derived from adipose tissue accelerate articular cartilage degradation and synovial inflammation, amplifying OA risk beyond biomechanical factors alone. Second, physical activity directly enhances muscle strength, neuromuscular coordination, and joint stability. In active individuals, greater muscular support may therefore mitigate detrimental biomechanical forces such as altered gait and core instability, which are associated with a higher trunk FMR. Third, regular physical activity improves metabolic health and insulin sensitivity. Physical inactivity, conversely, is linked to insulin resistance and metabolic syndrome, both of which are independently associated with OA pathogenesis. 36 Thus, in inactive participants, a high arm or trunk FMR may serve as a biomarker for this adverse metabolic phenotype, further compounding OA risk through intertwined metabolic and inflammatory pathways.
Mediation analysis highlighted that systemic inflammation may partially contribute to the effect of a higher FMR on OA risk. The adipose tissue has been recognized as an active endocrine organ that secretes a multitude of pro-inflammatory cytokines and adipokines. These cytokines and adipokines promote OA pathogenesis through multiple mechanisms, such as progressive joint cartilage degradation, inhibition of collagen and proteoglycan synthesis in chondrocytes, and production of matrix metalloproteinases, all of which may contribute to cartilage damage. 37 Consistent with our observation, Xue et al. reported that a higher SII is associated with an increased prevalence of OA in US adults. 38 However, the modest proportion of the association mediated by inflammation (2.4–2.6%) suggests that while a pro-inflammatory state may contribute, it is not the principal mechanism. Instead, this association is likely driven predominantly by direct biomechanical pathways, such as increased joint loading from greater adiposity, altered force distribution due to changes in body composition and posture, and diminished muscular support for shock absorption. 39 Therefore, while systemic inflammation appears to be a statistically significant mediator, its small effect size suggests it plays a secondary and limited role, with biomechanical mechanisms likely predominating in the relationship between FMR and OA.
Our study has several notable strengths. Foremost, we measured the FMR using dual-energy X-ray absorptiometry, the current gold standard that provides superior accuracy compared to bioelectrical impedance analysis methods employed in previous studies. Furthermore, by analyzing FMR across distinct anatomical compartments, we were able to probe region-specific associations with OA risk. The robustness and generalizability of our findings are also enhanced by leveraging data from a nationally representative survey with large sample size and adjustments for multiple potential confounders.
Nevertheless, we also have to emphasize several key limitations inherent in the current investigation. First, the data were cross-sectionally collected, precluding definitive causal inferences regarding the relationship between FMR and OA. Second, OA was diagnosed by self-report without radiographic or clinical validation, which introduces a risk of non-differential misclassification. More critically, the absence of anatomical data on OA represents a fundamental analytical constraint, precluding granular inference regarding the observed associations with regional body composition. For instance, an elevated leg FMR may be differentially relevant to the biomechanical pathogenesis of knee OA compared to the systemic metabolic pathways implicated in hand OA. Our aggregate measure of OA cannot disentangle these potential etiological heterogeneities, thereby limiting the pathophysiological specificity of our findings. Another consideration is that while we analyzed region-specific FMR, these measures (e.g., leg FMR) represent a gross anatomical approximation and cannot be anatomically matched to the specific joint(s) involved in an individual’s OA (e.g., knee vs hip). Therefore, biomechanical interpretations linking regional FMR to OA should be interpreted with appropriate caution. Third, area under the curve values of 0.635–0.656 indicate that FMR alone is not suitable for use as a screening or diagnostic tool. Fourth, it is important to note that the lean mass measured by dual-energy X-ray absorptiometry for FMR calculation includes non-muscle components and thus does not represent pure skeletal muscle mass. Fifth, consistent with its modest discriminatory performance, we emphasize that the FMR should be interpreted as an epidemiological marker of association for body composition profiles linked to OA risk, rather than as a predictive diagnostic tool with immediate clinical applicability. Finally, unmeasured confounding factors, such as genetic susceptibility, may also influence the association between FMR and OA risk.
Conclusions
The results of this nationally representative analysis demonstrated that both whole-body and region-specific FMR are positively associated with OA prevalence in US adults aged 40 years and older, an association partially mediated by systemic inflammation. While leg, trunk, and total FMR exhibited linear relationships with OA prevalence, arm FMR showed a non-linear association. Physical activity significantly modified the relationships between arm and trunk FMR with OA prevalence. Importantly, DXA-derived lean mass is not a pure measure of skeletal muscle, which cautions against definitive conclusions on muscle-specific mechanisms. Future prospectively designed longitudinal and experimental studies are necessary to establish causality and to elucidate the underlying molecular mechanisms linking FMR to OA development.
Footnotes
Consent for participate
All participants provided informed consent. Researchers can access to the database directly without the requirement for an additional ethical approval process.
Author contributions
SG contributed to formal analysis and writing of the manuscript. LZ, JXS and JJQ contributed to methodology. QGF contributed to finding. SYL contributed to conceptualization and critical revision of the manuscript. All authors have read and approved the manuscript.
Funding
The authors disclosed receipt of the following financial support for the research, authorship, and/or publication of this article: This study was supported by the 2024 Putuo District Central Hospital to introduce talent start-up fund (No. 2024-YJRC-03).
Declaration of conflicting interests
The authors declared no potential conflicts of interest with respect to the research, authorship, and/or publication of this article.
Data Availability Statement
Human ethics
NHANES database obtained ethical approval from the National Center for Health Statistics.