
Abstract
Background:
Body composition is important for health screening, but appropriate methods for unilateral lower extremity amputees have not been validated.
Objectives:
To compare body mass index adjusted using Amputee Coalition equations (body mass index–Amputee Coalition) to dual-energy X-ray absorptiometry in unilateral lower limb amputees.
Study design:
Cross-sectional, experimental.
Methods:
Thirty-eight men and women with lower limb amputations (transfemoral, transtibial, hip disarticulation, Symes) participated. Body mass index (mass/height2) was compared to body mass index corrected for limb loss (body mass index–Amputee Coalition). Accuracy of classification and extrapolation of percent body fat with body mass index was compared to dual-energy X-ray absorptiometry.
Results:
Body mass index–Amputee Coalition increased body mass index (by ~ 1.1 kg/m2) but underestimated and mis-classified 60% of obese and overestimated 100% of lean individuals according to dual-energy X-ray absorptiometry. Estimated mean percent body fat (95% confidence interval) from body mass index–Amputee Coalition (28.3% (24.9%, 31.7%)) was similar to dual-energy X-ray absorptiometry percent body fat (29.5% (25.2%, 33.7%)) but both were significantly higher (p < 0.05) than percent body fat estimated from uncorrected body mass index (23.6% (20.4%, 26.8%)). However, total errors for body mass index and body mass index–Amputee Coalition converted to percent body fat were unacceptably large (standard error of the estimate = 6.8%, 6.2% body fat) and the discrepancy between both methods and dual-energy X-ray absorptiometry was inversely related (r = −0.59 and r = −0.66, p < 0.05) to the individual’s level of body fatness.
Conclusions:
Body mass index (despite correction) underestimates health risk for obese patients and overestimates lean, muscular individuals with lower limb amputation.
Clinical relevance
Clinical recommendations for an ideal body mass based on body mass index–Amputee Coalition should not be relied upon in lower extremity amputees. This is of particular concern for obese lower extremity amputees whose health risk might be significantly underestimated based on body mass index despite a “correction” formula for limb loss.
Background
Excess body fatness is associated with greater risk for chronic diseases (e.g. cardiovascular disease, hypertension, stroke, metabolic disease, and diabetes). 1 Obesity, defined as an excessive amount of body fat relative to body mass (BM), is also a risk factor for amputation often secondary to Type II diabetes. 2 A majority of lower limb amputations performed annually are due to non-traumatic causes, also primarily related to diabetes. 3 Moreover, rates for dysvascular amputations continue to increase over time. 4 Amputation may also play a role in further increased adiposity over the lifespan, and increased adiposity post-amputation is associated with a downward health trajectory. 5
In 2013, the Centers for Disease Control and Prevention 6 reported 30.3% of adult Americans are obese based on self-reported measures of BM relative to height ⩾30 kg/m2, known as body mass index (BMI) 7 and used annually to track obesity rates in adults in the United States. In the amputee population, higher BMI is associated with decreased prosthetic use and the ability to properly fit the patient. 1 Rosenberg et al. 5 suggest that persons undergoing lower extremity amputation have high rates of overweight and obesity and continue to gain weight in the year following amputation and, thus, recommend assessment using BMI. Although BMI is a common metric for obesity, the validity of BMI in lower extremity amputees (with variable causes of amputation) remains unknown, and a need to inform healthcare providers (e.g. prosthetists) of its value is clear.
To date, estimating the mass of the amputated limb has relied upon mathematical estimates of body proportions 8 and center of mass for body segments.9,10 Recently, the Amputee Coalition published a correction factor (AC) 11 based on these models to estimate missing BM based on the level of amputation in order to improve accuracy of BMI (i.e. resulting in a higher BM and BMI value). Techniques to correct or even replace BMI in lower extremity amputees have also been suggested12,13 since BMI appears to be poorly correlated with nutritional status.
Although BMI is useful for large-scale surveillance of the general population, there are known limitations of BMI to determine adiposity on an individual basis,14,15 particularly for extremely muscular individuals whose significant musculoskeletal development is clearly not differentiated with BMI. 16 Thus, amputees who are lean and muscular (typically those whose cause of amputation was trauma or congenital, not chronic disease such as diabetes) might be mis-classified with BMI. On the opposite end of the spectrum, there may be amputees with normal BMI, but a high percent body fatness indicative of obesity. A more valid method is to estimate body fatness with dual-energy X-ray absorptiometry (DXA).17,18 However, to our knowledge, the anthropometric-based method customized specifically by the AC for a diverse lower extremity amputee population (from healthy athlete to morbidly obese with chronic disease) has not been validated against a criterion method of body composition such as DXA.
Therefore, the purpose of this study was to examine the impact of correcting for limb loss on BMI using AC estimates (BMI-AC) and evaluate the validity of this method in providing accurate adiposity assessment for persons with lower limb amputation. We hypothesized that, as in non-amputee populations, BMI would overestimate body fatness for lean, muscular individuals, but, if corrected for limb loss, would provide accurate estimations, particularly for normal, overweight, and/or obese individuals with unilateral lower limb amputation.
Methods
Subjects
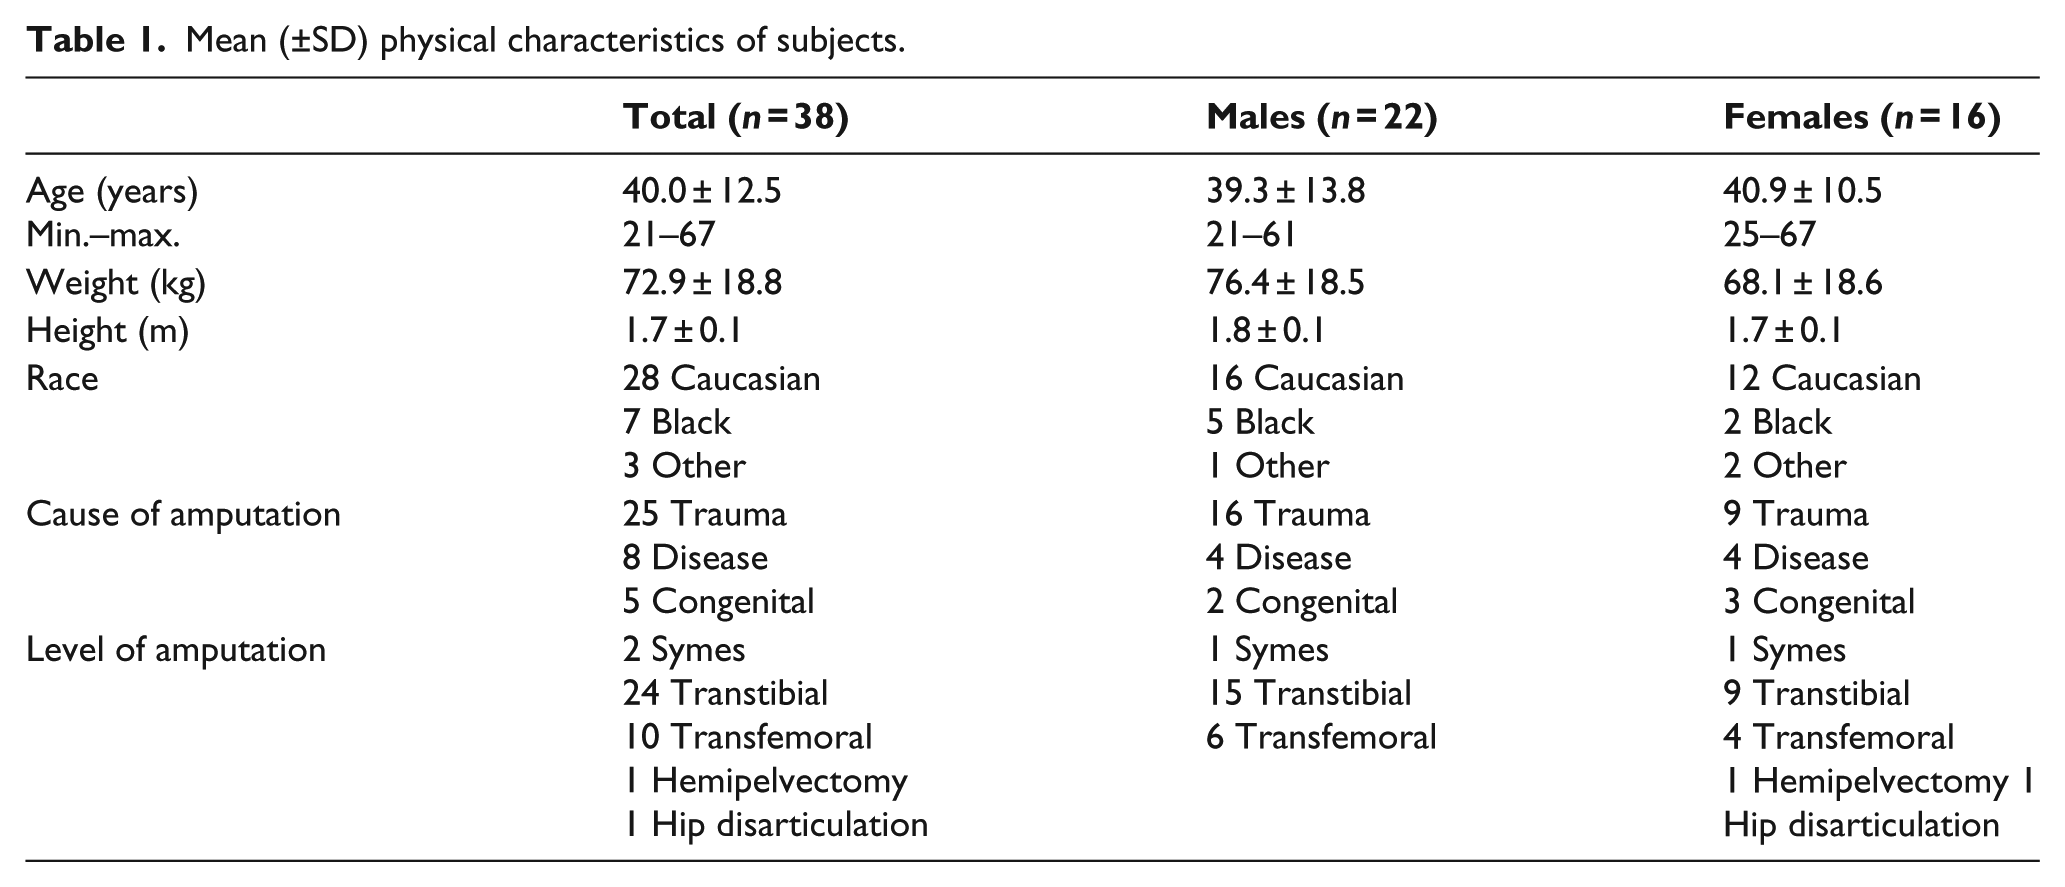
Thirty-eight adult men and women, aged 21–67 years, volunteered to participate and gave written informed consent as approved by the University Institutional Review Board. The physical characteristics are presented in Table 1. Inclusion criteria were as follows: unilateral lower extremity amputation through the hip joint (hip disarticulation/hemipelvectomy), above knee (transfemoral), below knee (transtibial), and/or through the ankle joint (Symes) due to all causes (congenital, trauma, disease). Subjects were excluded if they had upper limb amputation or amputation surgery within the previous 2 years, since decreases in residual limb volume are observed in the early post-amputation phase, followed by stabilization. 19 Minor children under 18 years of age were excluded due to immature bone mineral content and greater water per unit of fat-free mass which violates assumptions for fat-free mass density. 20
Mean (±SD) physical characteristics of subjects.
Test protocol
Subjects reported to the laboratory to complete anthropometric measures including BM, height, and limb lengths. Subjects wore T-shirt and shorts for all measurements. Height was measured using a wall-mounted stadiometer (SECA Medical Measuring Systems and Scales, Chino, CA, USA) with subjects wearing their prosthesis similar to previous methods. 13 BM was measured on a digital platform scale (Pennsylvania 500; Pennsylvania Scale Company, Lancaster, PA, USA) with the prosthesis followed by weighing the prosthesis only in order to obtain the net difference in mass. BMI was then determined by BM without prosthesis (kg) divided by height (meters) squared.
BMI was corrected using the AC online calculator. 11 Based on the published sources5,21,22 and expert opinion, AC calculator corrects for proportions of total BM missing based on the following percentages: foot (Symes) = 1.30%, transtibial = 3.26%, transfemoral = 9.96%, and hip disarticulation/hemipelvectomy = 11.83%. This correction does not differ for men or women, unlike other estimates 5 which are slightly higher for women: 3.355% and 10.712% (transtibial and transfemoral, respectively). Estimated BM was calculated as

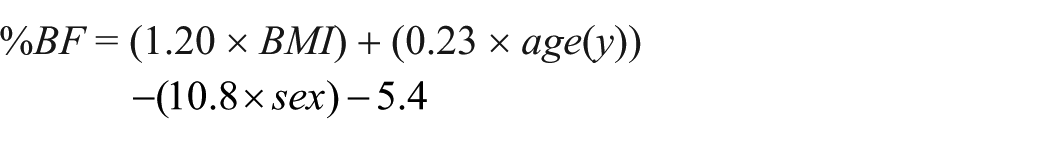
Subjects were then classified into one of four categories based on National Institutes of Health (NIH) BMI cut-points: 7 underweight (<18.5), normal (18.5–24.9), overweight (25–29.9), or obese (⩾30). BMIs were also converted into estimates of percent body fat (%BF) using the following equation 23 with values for sex of 1 if male, and 0 if female:
Body composition to estimate %BF was obtained on the Lunar Prodigy DXA fan-beam scanner (GE Healthcare, Hatfield, UK) and enCore 2006 software (version 10.51.006). The unit was calibrated daily using the quality assurance block supplied by the manufacturer. We considered DXA as the criterion measure for adiposity since it has been validated for adults varying in sex, race, athletic status, body size, musculoskeletal development, and body fatness. 17 Subjects’ full body was scanned in the supine position, typically using standard mode unless a fast or slow mode was recommended by default on the software. An experienced technician manually verified areas of regional estimates (e.g. right and left legs). Subjects were tested at various times of day but not within 2 h of a previous meal and were asked to void beforehand. The impact of meals or hydration status on DXA is unclear, 24 but appears less than other body composition methods. DXA is recognized as useful in lower leg amputees since detailed body composition information is generated to compare left and right sides of each body region; 24 thus, the estimates of the missing extremity can be made compared with the intact side. Demarcation of regional segments (i.e. ankle, knee, hip) was used to estimate differences from the intact to the amputated side. This differential was then computed relative to total BM and compared to the AC estimated values.
Due to differences by age and sex, a consensus opinion for exact %BF associated with optimal health risk has not been clearly defined or equated with BMI. 25 Therefore, in order to compare “classifications” of individual subjects across the two different methods (BMI vs. DXA), the World Health Organization (WHO) 26 reference standard for obesity was used in %BF (>25%BF in men, >35%BF in women). Classification for the other categories based on %BF maintained a 10% lower value for men and was as follows: underweight defined as <8% for men and <18% for women, overweight was 19%–24.9% for men and 29%–34.9% for women, and normal intermediate between underweight and overweight. We chose to ignore potential race 27 and age-specific influences in establishing the %BF comparison classifications since the %BF ranges used for young adults (20–39 years) were only 3% and 1% lower compared to older men and women (40–59 years), respectively, 25 and did not impact the results of the frequency tables.
Statistical analysis
Data are reported as mean ± standard deviation (SD) and were analyzed using SPSS 17.0 (Chicago, IL, USA). BMI (BM/height2) was compared to BMI corrected for limb loss (BMI-AC) using a paired t-test. Frequency distributions of the four categories using BMI and BMI-AC corrected values were compared against the category placement based on DXA using Pearson’s chi-square test. Due to unequal variances, Friedman’s test was utilized to compare %BF based on BMI, BMI-AC, and DXA. Pairwise post hoc comparisons were made using the Wilcoxon signed rank test. Pearson product moment correlation was performed to determine the relationship between estimated %BF via BMI and DXA methods and the discrepancy between BMI and criterion (DXA) based on the level of body fatness from DXA criterion value. Agreement between BMI and DXA methods for estimating %fat was determined using a modified Bland–Altman plot. 28 The total error to evaluate BMI-corrected methods versus DXA was calculated as the square root of [{Σ(X − Y)2}/N]. An alpha level of p <0.05 was indicative of significance.
Results
BMI results are presented in Figure 1. The effect of correcting for limb loss using BMI-AC significantly increased BMI (p < 0.05) by ~1 kg/m2 across all subjects and male/female groups. The average BMI overall (24.6 ± 5.5 kg/m2) was below overweight classification, but reached overweight when using BMI-AC (25.6 ± 5.9 kg/m2). Applying BMI-AC also increased the mean BMI for men to overweight, in contrast to the mean BMI for females which was classified as overweight without correction.
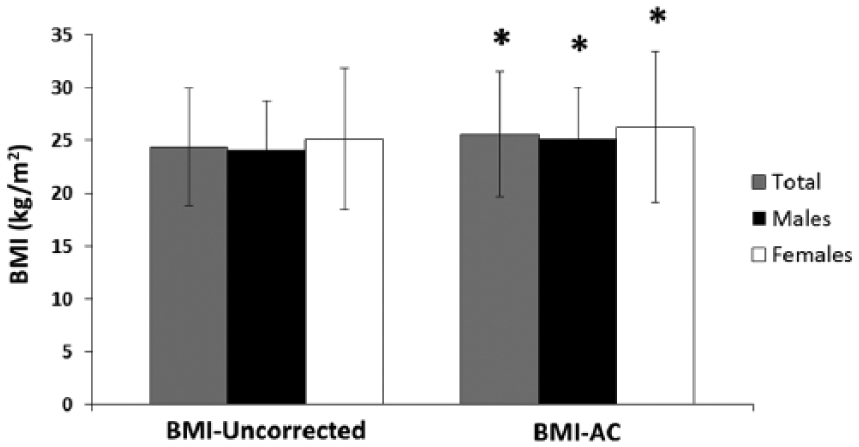
Body mass index (BMI) compared with and without Amputee Coalition correction factor in amputees (total n = 38).
The estimates to correct BM based on limb loss with AC calculator compared to DXA-derived calculations are presented in Table 2. Overall, the mean values based on DXA-calculated limb loss tended to be greater than those previously estimated with the AC calculator, 21 particularly for amputations at the level of Symes and hip disarticulation/hemipelvectomy. Also, individual variability was large in the DXA-calculated values for transtibial and transfemoral amputation, in part due to large ranges in total BM of the subjects and the variable level of the amputation in these two categories. The mean values for Symes and transtibial amputation (n = 24) for percent loss of total BM obtained via DXA were similar (4.9%) and both greater than the AC-assumed values (1.3%, 3.26%). DXA images for individuals with transtibial amputation representing the minimum and maximum values for calculated percent loss relative to total BM are also presented in Figure 2. The variability seems related to both the level of the amputation (i.e. ranging from 19.8% to 31.2% of limb length missing for transtibial and 28.4%–67.3% for transfemoral) and other tissue characteristics (mesomorphy, atrophy, bone demineralization) of both intact and amputated limbs. The percent of BM and limb length missing was clearly graded across levels of amputation, but there still was overlap among amputation groups.
Estimates of relative mass of the body represented by the missing limb (%BM missing) based on level of amputation from the Amputee Coalition calculator compared to differences obtained via dual-energy X-ray absorptiometry (DXA) scans of the amputated limb vs. intact to calculate the relative (%) body mass (BM) and % length of the limb that is missing.
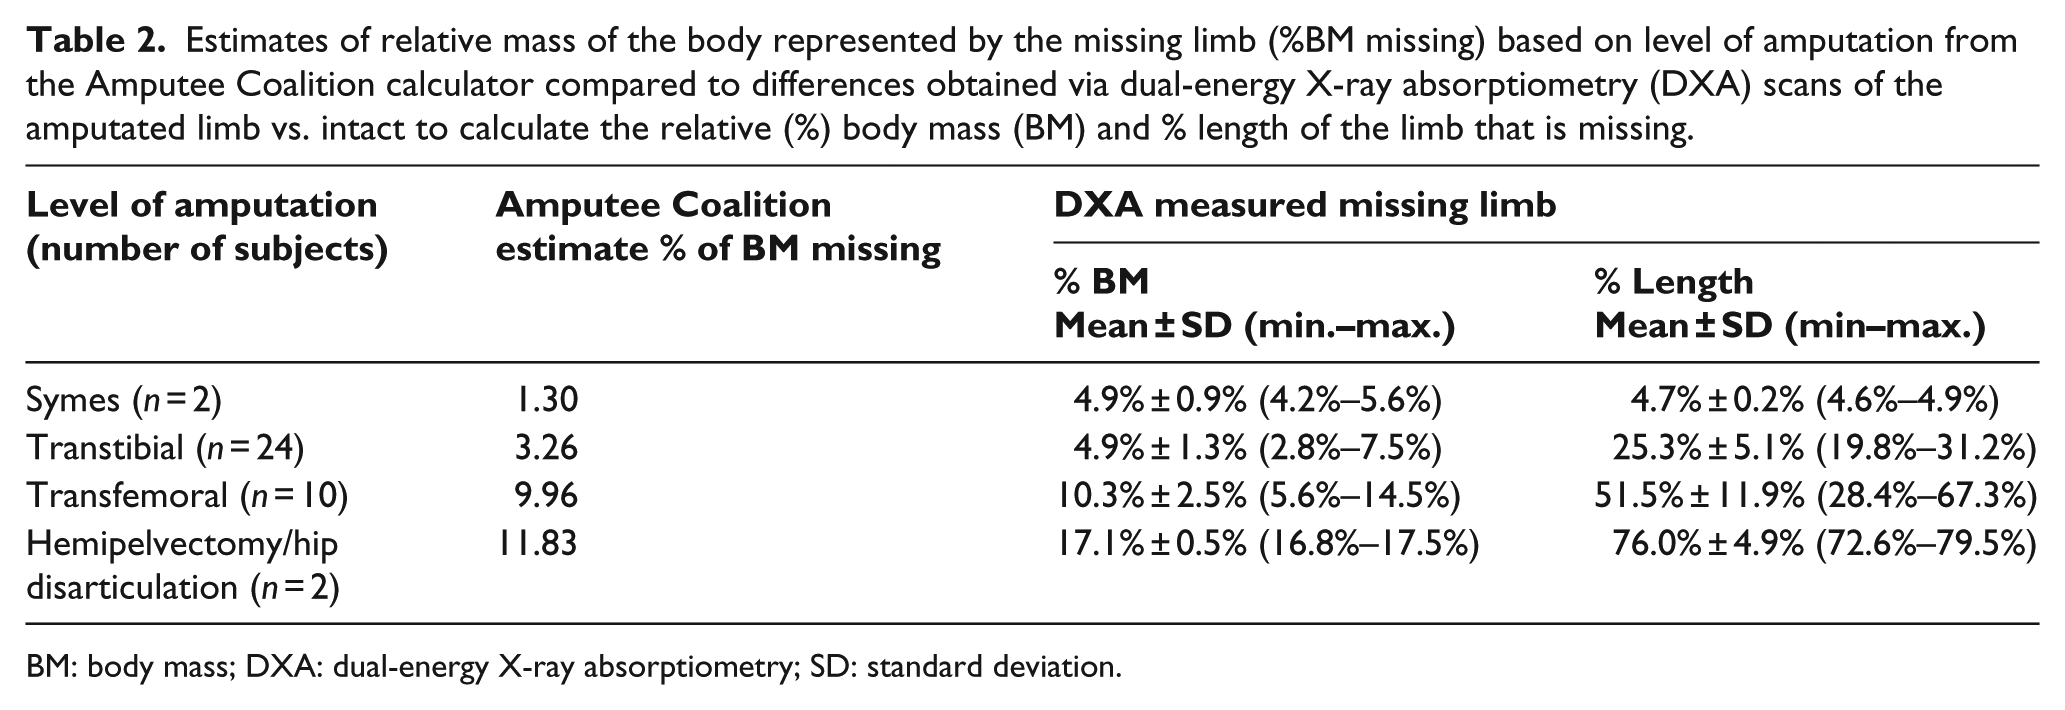
BM: body mass; DXA: dual-energy X-ray absorptiometry; SD: standard deviation.
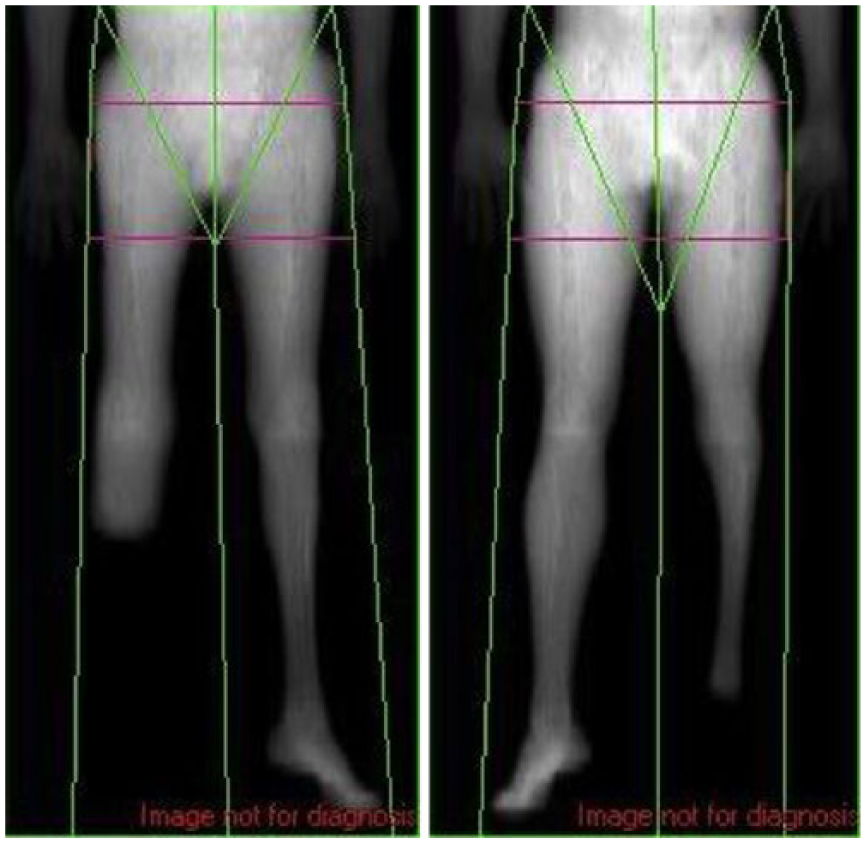
DXA images from two transtibial amputees. Variability in the residual limb length and atrophy is observed, thus challenging the utility of an estimate via a single, standard correction factor.
Frequency counts and sample distribution across the four classification categories according to BMI, BMI-AC, and DXA are presented in Figure 3. The difference in BMI and BMI-AC placement was significantly different (p = 0.0002, p = 0.0001) from DXA, but BMI-AC did not influence category placement compared to BMI (p = 0.6). DXA frequency distribution categorized a majority (52.6%) of subjects as obese (10 men and 10 women) compared to BMI (18.4%) and BMI-AC (21.1%). Compared to DXA, BMI and BMI-AC led to mis-classification and underestimation of 13 and 12 obese (out of 20), respectively. Using BMI, six were mis-classified as overweight, but seven mis-classified as normal. Using BMI-AC, eight were overweight and four mis-classified as normal. Of those underweight via DXA, two men were overestimated with both BMI methods as normal. Only one underweight female by DXA was mis-classified normal via BMI-AC, but was correctly classified underweight via BMI.
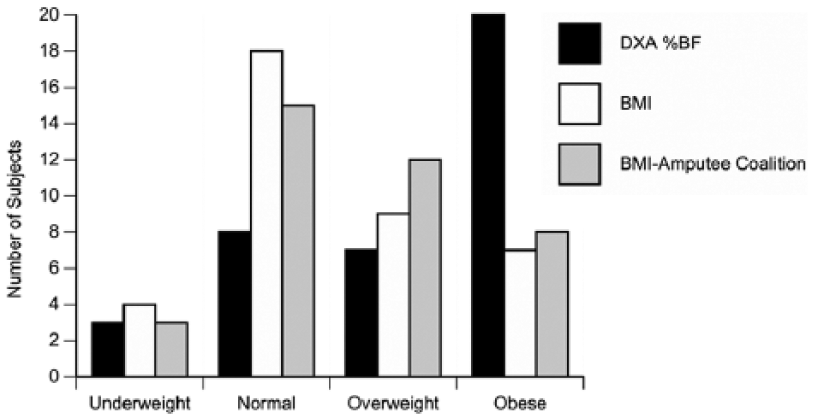
Frequency distribution of total sample of men and women (n = 38) by method. Classifications (underweight, normal, overweight, obese) are compared based on BMI, BMI with Amputee Coalition correction, and the criterion reference % body fat value via dual-energy X-ray absorptiometry (DXA).
For the total group, the mean (95% confidence interval) DXA %BF of 29.5% (25.2%, 33.7%) was significantly higher (p < 0.05) compared to the BMI-converted %BF of 23.6% (20.4%, 26.8%), but not different from the BMI-AC %BF of 28.3% (24.9%, 31.7%). The two BMI-converted %BF methods differed significantly from each other in both men and women, but only BMI %BF was different (p < 0.05) from DXA %BF in women and men (Figure 4). Both BMI %BF methods were highly correlated (p < 0.05) to DXA %BF (r = 0.88 and r = 0.85 for BMI-AC and BMI, respectively, Figure 5). However, the values were above and below the line of identity indicating that a comparison of methods based on regression alone is inappropriate, particularly with a heterogeneous population across a wide range of body fat values. 28 Thus, the limits of agreement and total error of the estimates were calculated for further assessment of methods.
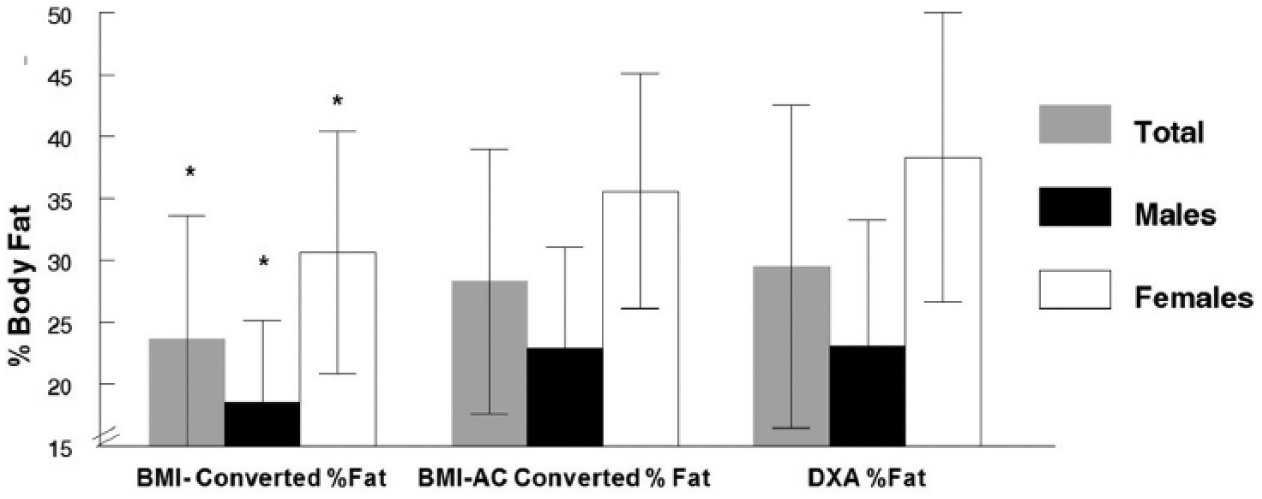
Mean ± SD % body fat (%BF) estimates by method. Two BMI methods (uncorrected and applying the Amputee Coalition correction) converted to %BF according to Deurenberg et al. 23 are compared with DXA %BF (criterion).
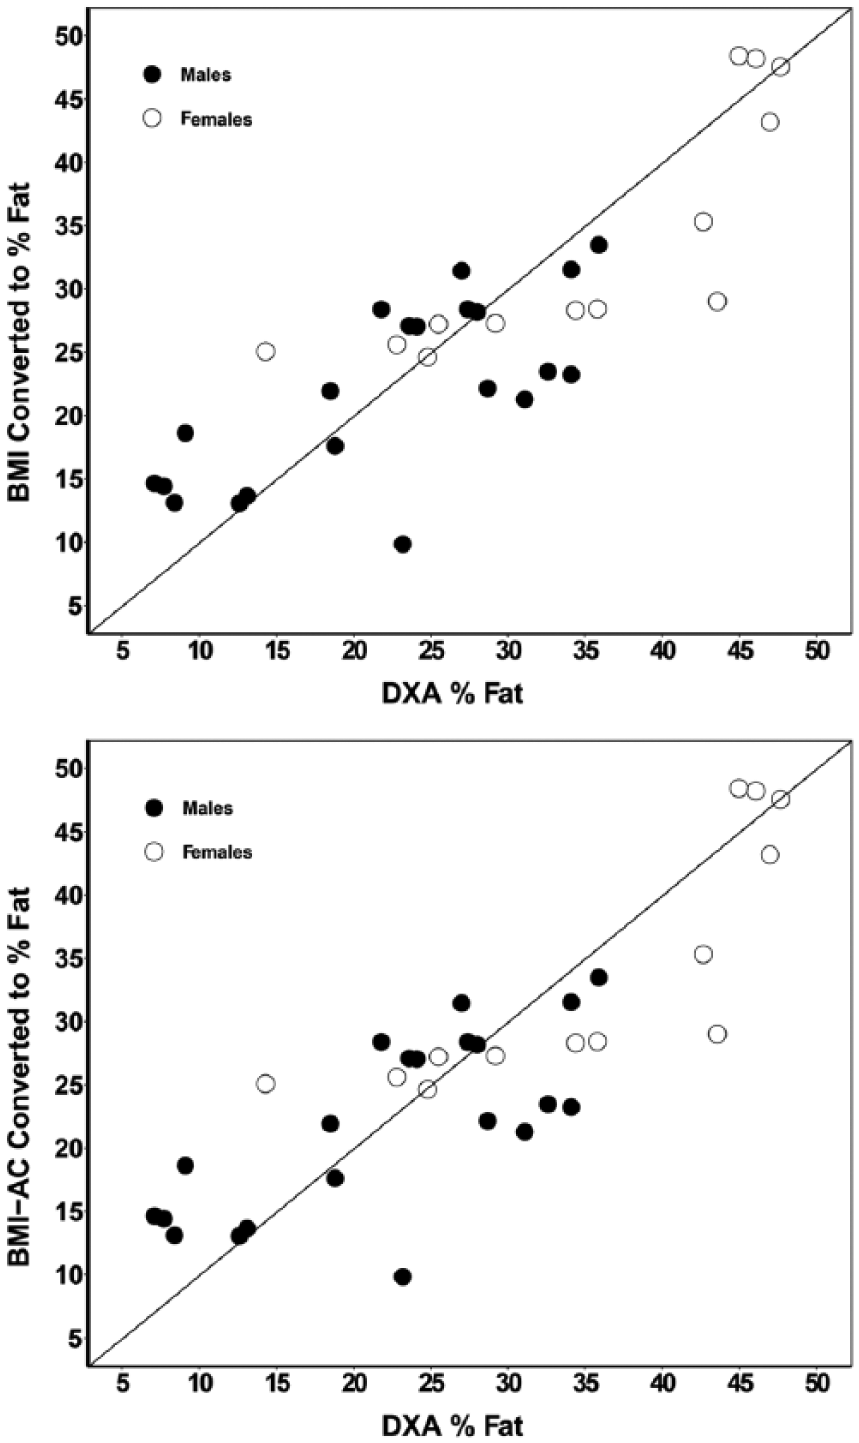
Correlation between BMI-converted body fatness estimates and criterion reference (DXA).
A scatter plot illustrating the differences between the two BMI methods converted to %BF and DXA %BF across the level of body fatness of subjects (based on the criterion, DXA %BF) is presented in Figure 6. The overall mean difference between BMI-AC%BF and DXA %BF was relatively small (−1.2%BF), but the variability of the difference was large (1.96 SD = 12.5%), particularly evident at the low and high ends of the range for %BF. The difference between methods was significantly and inversely correlated (r = −0.66, p < 0.01) to the level of body fatness for all subjects, both men and women. Figure 6 indicates that the body fatness of subjects in the “tails” of the distribution is underestimated for overweight/obese and overestimated for lean or underweight classifications. Although the overall mean difference was greater (−5.9%) using BMI-converted %BF, the 1.96 SD of the difference remained large (13.8%) and inversely correlated to the level of fatness (r = −0.59). The total error (or standard error of the estimate) was 6.8% BF for BMI-converted %BF and 6.2% BF for the BMI-AC %BF. Thus, neither BMI conversion method to % fatness yielded acceptable accuracy (considered to be <3% fat). 29
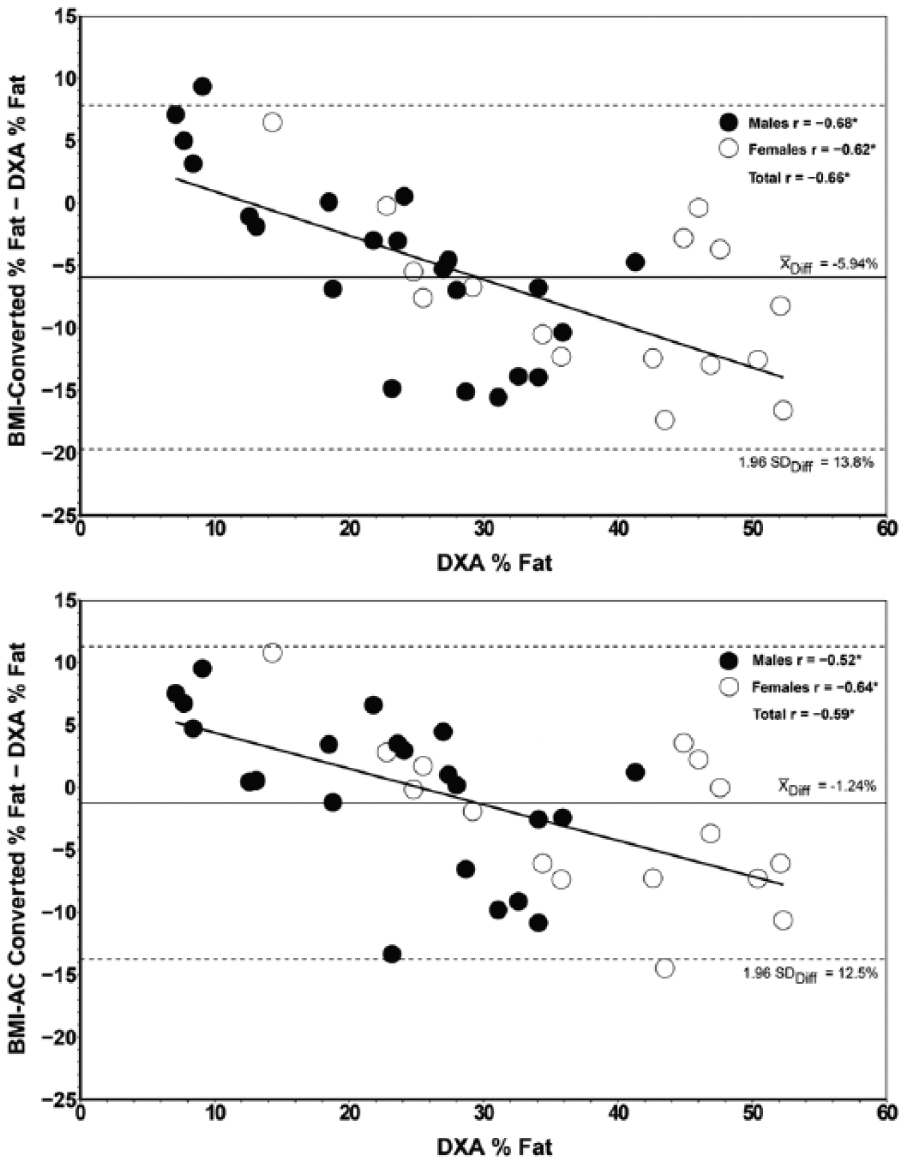
Limits of agreement between calculated values of body fatness against criterion.
Discussion
Body composition assessment provides advantages over generalized indices such as BM relative to stature,17,18 since BMI has known limitations 30 and may not accurately predict body composition (i.e. body fatness relative to total BM). This study also indicates for lower extremity amputees, the utility of BMI, despite corrections for limb loss using the AC calculator, also has significant limitations. We observed that for individuals at the tails of the population distribution (i.e. lean/muscular and obese), BMI overestimates and underestimates classification, respectively. Thus, our hypothesis was only partially accepted for the lean and muscular lower limb amputees. Of particular concern was that BMI significantly underestimated obesity (in contrast to our hypothesis) for a population where excess body fatness has known adverse health implications. The mis-classification risk for obesity has been suggested in other sub-groups of the population (such as post-menopausal women), 31 but, until now, has largely been unreported in persons with amputation.
Unfortunately, merely correcting BMI for missing limb mass via the AC calculator was not an effective method to improve classification accuracy. Although applying the correction formula significantly increased BMI (on average by 1 kg/m2), there was no overall reduction in classification error. Using DXA imaging to validate the BM proportions estimated to be missing based on the level of amputation, we found significant variability among individuals at all levels of lower extremity amputation (from Symes to hip disarticulation). In most cases, the estimates assumed previously11,21 tended to be lower than the actual relative BM missing based on the contralateral intact limb mass. The actual difference was as much as 40%–50% higher for some individuals compared to AC estimates. This variation appears related to significant atrophy proximal to the amputation in addition to the missing segment itself, which would be difficult to estimate based purely on segment length or proportions. Using computed tomography scans and DXA, Sherk et al. 32 quantified significant atrophy in the thigh muscle for transtibial and transfemoral amputated limbs along with increased intra-muscular adipose at the end of residual limbs. Furthermore, fat percentage in the amputated thigh versus intact thigh was significantly greater by ~ 6%. Thus, the assumption of symmetry to estimate limb loss is biologically invalid. Greater fat accumulation, bone demineralization, and/or muscle atrophy in the residual limb contribute to an underestimate of BMI for predicting obesity than correction factors allow for based solely on body segment estimates.
Correcting for BMI was also not effective for estimating %BF on an individual basis. Although the mean difference between BMI-AC %BF conversion was closer to DXA versus BMI (uncorrected), both methods had large and unequal variances, indicating increased chance for error exceeding recommendations 29 for acceptable methods in providing accurate information to individuals. Specifically, both the BMI-AC and BMI-converted %BF generated greater error at the extremes of body fat distribution. Again, the %BF estimates for obese individuals were significantly underestimated. We anticipated poor agreement with DXA %BF and BMI-based methods similar to previous reports for muscular, lean individuals. 16 Not surprisingly, BMI overestimated our two male amputees who were mesomorphic and “lean,” thus, mis-classifying them into higher categories, reflecting similar BMI limitations in lower limb amputees as reported for muscular, lean populations as a whole. However, we did not expect the discrepancy to be as significant at the other extreme (underestimating obese individuals).
In the general population, other investigations2,29,30,31,33 have compared BMI accuracy with other body composition techniques. The level of body fatness introduces bias in the agreement of BMI and DXA %BF. In agreement with our results, Freedman et al. 30 warn prediction of %BF from BMI or other anthropometric-based methods (e.g. body adiposity index) should be interpreted cautiously as estimates are likely to vary systematically with the level of body fatness. Romero-Corral et al. 33 indicated that the accuracy of BMI in diagnosing obesity in the overall adult population is limited, particularly for individuals in the intermediate BMI ranges, in men and in the elderly; thus, although the BMI cutoff of ⩾30 kg/m2 had good specificity, it failed to correctly classify more than half of people with excess adiposity. In women, the current BMI cut-point for obesity (⩾30 kg/m2) also failed to identify nearly half of reproductive-aged women who met the WHO criteria for obesity (%BF > 35%). 2 We found approximately 63% and 46% of women and men, respectively, were classified obese via DXA %BF and unfortunately, with BMI methods, as many as 65% of these obese individuals were mis-classified in a lower risk category of either overweight or normal. Similar to other recommendations 31 for other specific groups (e.g. post-menopausal women), one possibility to improve the utility of BMI may include establishing alternate, lower BMI cut-point values for obesity in specific populations (i.e. lower limb amputees) based on future investigations. Another approach might include an estimate of central adiposity (e.g. waist circumference) as a predictor of individual body composition for health screening.
Although DXA was considered the criterion measure, DXA may not always coincide with other measures of body composition in obese subjects, despite similar mean values. 34 DXA scanning speed may also influence %BF estimates; 35 thus, the impact of using the manufacturer’s recommended scan speed (which may have been influenced by a lower BM due to a missing limb segment), is unknown. In addition, greater bias has been observed with DXA in lean subjects (i.e. underestimating %BF by ~4%) 36 compared to the criterion method measuring four components of the body (water, fat, bone, and residual). Until a four-component model is used to evaluate lower limb amputees, DXA remains the best gold standard despite these potential limitations.
Conclusion
The utility of BMI (whether correcting for limb loss or not) is limited as a screening tool, particularly due to the underestimation of individual health risk classification in obese individuals (i.e. mis-classification as either normal or overweight). Thus, the AC online calculator may leave the false impression for an obese person that they have a “normal” health risk (risk of a “false negative” for obesity). Therefore, caution is urged when attempting to provide accurate information regarding a healthy BM to individuals with lower limb amputation, and referral for body composition assessment seems appropriate (e.g. DXA). The validity of other anthropometric methods (circumferences, skinfolds) or defining a different BMI cut-point for obesity needs to be established with additional investigations.
Footnotes
Acknowledgements
The authors thank Denise Larkins MSPO and Sarah Stilley MSPO for their assistance with early data collection that contributed to this project as well as Matthew Wittbrodt and Michael Jones with technical assistance.
Author contribution
All authors contributed equally in the preparation of this manuscript.
Declaration of conflicting interests
The author(s) declared no potential conflicts of interest with respect to the research, authorship, and/or publication of this article.
Funding
The author(s) disclosed receipt of the following financial support for the research, authorship, and/or publication of this article: T.N.G. was funded by a NIH T32 Training Grant (NICHD 5T32HD05518). This research received no specific grant from any funding agency in the public, commercial, or not-for profit sectors.