
Abstract
Objective
The study aimed to investigate the mechanical distribution around knee joint after open wedge high tibial osteotomy (OWHTO) in different osteotomy distraction gaps (ODG) and confirm the safe ranges of correction after OWHTO.
Methods
A three-dimensional finite element analysis (FEA) was performed to observe the max stress distribution for three compartments of knee joint in each OWHTO model under the different ODG (1, 1.5, 2, 2.5, 3 cm), and measure the joint line height (JLH), Blackburne Peel Index (BPI), Insall-Salvati index (ISI), and joint line convergence angle (JLCA). Moreover, a retrospective clinical study involving 50 patients underwent OWHTO (7 males with 8 knees and 40 females with 42 knees; aged from 42 to 67 years old, BMI ranged from 18.80 to 32.17 kg/m2, duration from 12 to 38 months) was implemented to further reveal the role of different ODG on the clinical outcomes of patients after OWHTO.
Results
In the FEA, the ODG after OWHTO were positively correlated with the JLH (R2 = 0.980), negatively correlated with the BPI (R2 = 0.995) and the JLCA (R2 = 0.989), and not correlated with the ISI. Additionally, the turning point for the stress alterations of the three compartments of the knee joint was found when the ODG ranged from 2 to 2.5 cm. In the clinical study, a significant correlation was investigated between the two classifications (Kellgren-Lawrence and Iwano grading) and correction angle (r = 0.447, p < .001; r = 0.592, p < .001). A lower grading was observed in the correction angle within the range of 9–12°, compared with that in other ranges (χ2 = 31.733, p < .001; χ2 = 34.899, p < .001).
Conclusions
The ODG could affect the stress distribution of three compartments of the knee joint by altering the JLH, JLCA and BPI. As result of this, limited correction angle should be fully considered in the preoperative planning to avoid overcorrection and patellofemoral joint disorders.
Keywords
Introduction
Knee osteoarthritis (KOA) was a chronic degenerative disease with articular cartilage degeneration and secondary bone hyperplasia, which was closely related to abnormal alignment of the lower limbs.1,2 The occurrence of KOA in the medial compartment was most common, 3 due to that the pressure on medial compartment of the knee cartilage was generally higher than that in the lateral compartment in the weight-bearing state. 4 Remarkablely, varus alignment could increase the stress in the medial compartment, 5 which causes cartilage and subchondral injury and accelerates the progression of KOA. 6 Recently, open wedge high tibial osteotomy (OWHTO) has become an increasingly common treatment for medial compartment osteoarthritis7–10 as an important alternative to conservative management, which was confirmed to relieve medial compartment pressure by correcting the lower extremity alignment. 11
Notably, the clinical importance of patellofemoral considerations should be emphasized in OWHTO. It was reported that the changes of patella height, joint line position, and mechanical distribution around the knee joint after OWHTO were related to the correction angle.12,13 To our knowledge, as a common complication of OWHTO, overcorrection could lead to abnormal changes in the knee joint mechanics, including accelerated lateral compartment degeneration, and even affected the patellofemoral joint.14,15 So that it was particularly important to determine the safe range of correction angles. However, correction angles was difficult to accurately determined during OWHTO and was often used in postoperative evaluation. By contrast, the assessment of osteotomy distraction gaps (ODG) was intuitive and efficient in the intraoperative operation and preoperative planning according to the trigonometric table developed by Hernigou. 16
Thus, this study was designed to investigate the effects of different ODG on the mechanical distribution around the knee joint after OWHTO through three-dimensional finite element analysis (FEA). Moreover, a retrospective study was performed to evaluate the correlation between correction angles after OWHTO and the degeneration progression of three compartments of the knee joint, and then determine the safe ranges of correction angle in the OWHTO, especially for patients with mild patellofemoral degeneration. We hypothesized that a moderate correction angle (approximately 9–12°) would yield favorable outcomes for both the tibiofemoral and patellofemoral joints.
Materials and methods
Knee joint geometry
The original DICOM image data of CT and MRI through 1.0 slice thickness for the left knee joint were obtained from an anonymous healthy volunteer (female, 30 years old, BMI: 21 kg/m2). The three-dimensional finite element analysis model including bones, meniscus, cartilage and ligaments was preliminarily constructed through Mimics software (Mimics 21.0, Materialise company, Belgian). Subsequently, the model was smoothed and denoised by Geomagic software (Geomagic 2021, 3D system Inc., Rock Hill, USA) to establish the solid 3D model, and then was imported into Solidworks software (Solidworks 2021, SolidWorks Corporation, USA) for assembly and cutting, so as to create a complete finite element model of the knee joint. In addition, the 3D model of T-shaped plate screw system for OWHTO (length: 90 mm; thickness: 3 mm; screw diameter: 5 mm) were constructed by computer-aided design (CAD) software according to the previous reported. 17
Varus knee and OWHTO modeling
A varus knee model with an hip-knee-ankle (HKA) of 168° was produced as the previous reported
18
(Figure 1(a)), as well as the OWHTO model including location of osteotomy and placement of T-shaped plate screw system (Figure 1(b) and (c))
19
: (1) osteotomy plane: the medial osteotomy was performed below 35 mm of the lowest edge of the medial tibial plateau, the lateral osteotomy was 15 mm away from the lowest edge of of the tibial plateau, and 5 mm of the lateral cortex was preserved. (2) plate placement: one T-shaped plate and eight screws (4 proximal and 4 distal osteotomy gap) were placed on the anteromedial side of the models. Furthermore, the OWHTO models with different osteotomy distraction gaps (1, 1.5, 2, 2.5, 3 cm) were created by SolidWorks software and assembled with the T-shaped plate screw system to form the final analysis models at the knee joint extension and flexion 90° (Figure 1(b), and 1(c)). The model construction and boundary conditions. (a) The varus knee model with an HKA of 168° in different angles; (b) The model in extension position after OWHTO with different osteotomy distraction gaps (1, 1.5, 2, 2.5 and 3 cm); (c) The model in the knee flexion at 90° after OWHTO with different osteotomy distraction gaps (1, 1.5, 2, 2.5 and 3 cm); (d) The mesh of each material in the finite element model; (e) OWHTO model loads and boundary conditions in the extension. (f) model loads and boundary conditions in the flexion at 90°. Note: HKA = hip-knee-ankle, OWHTO = Open Wedge High Tibial Osteotomy.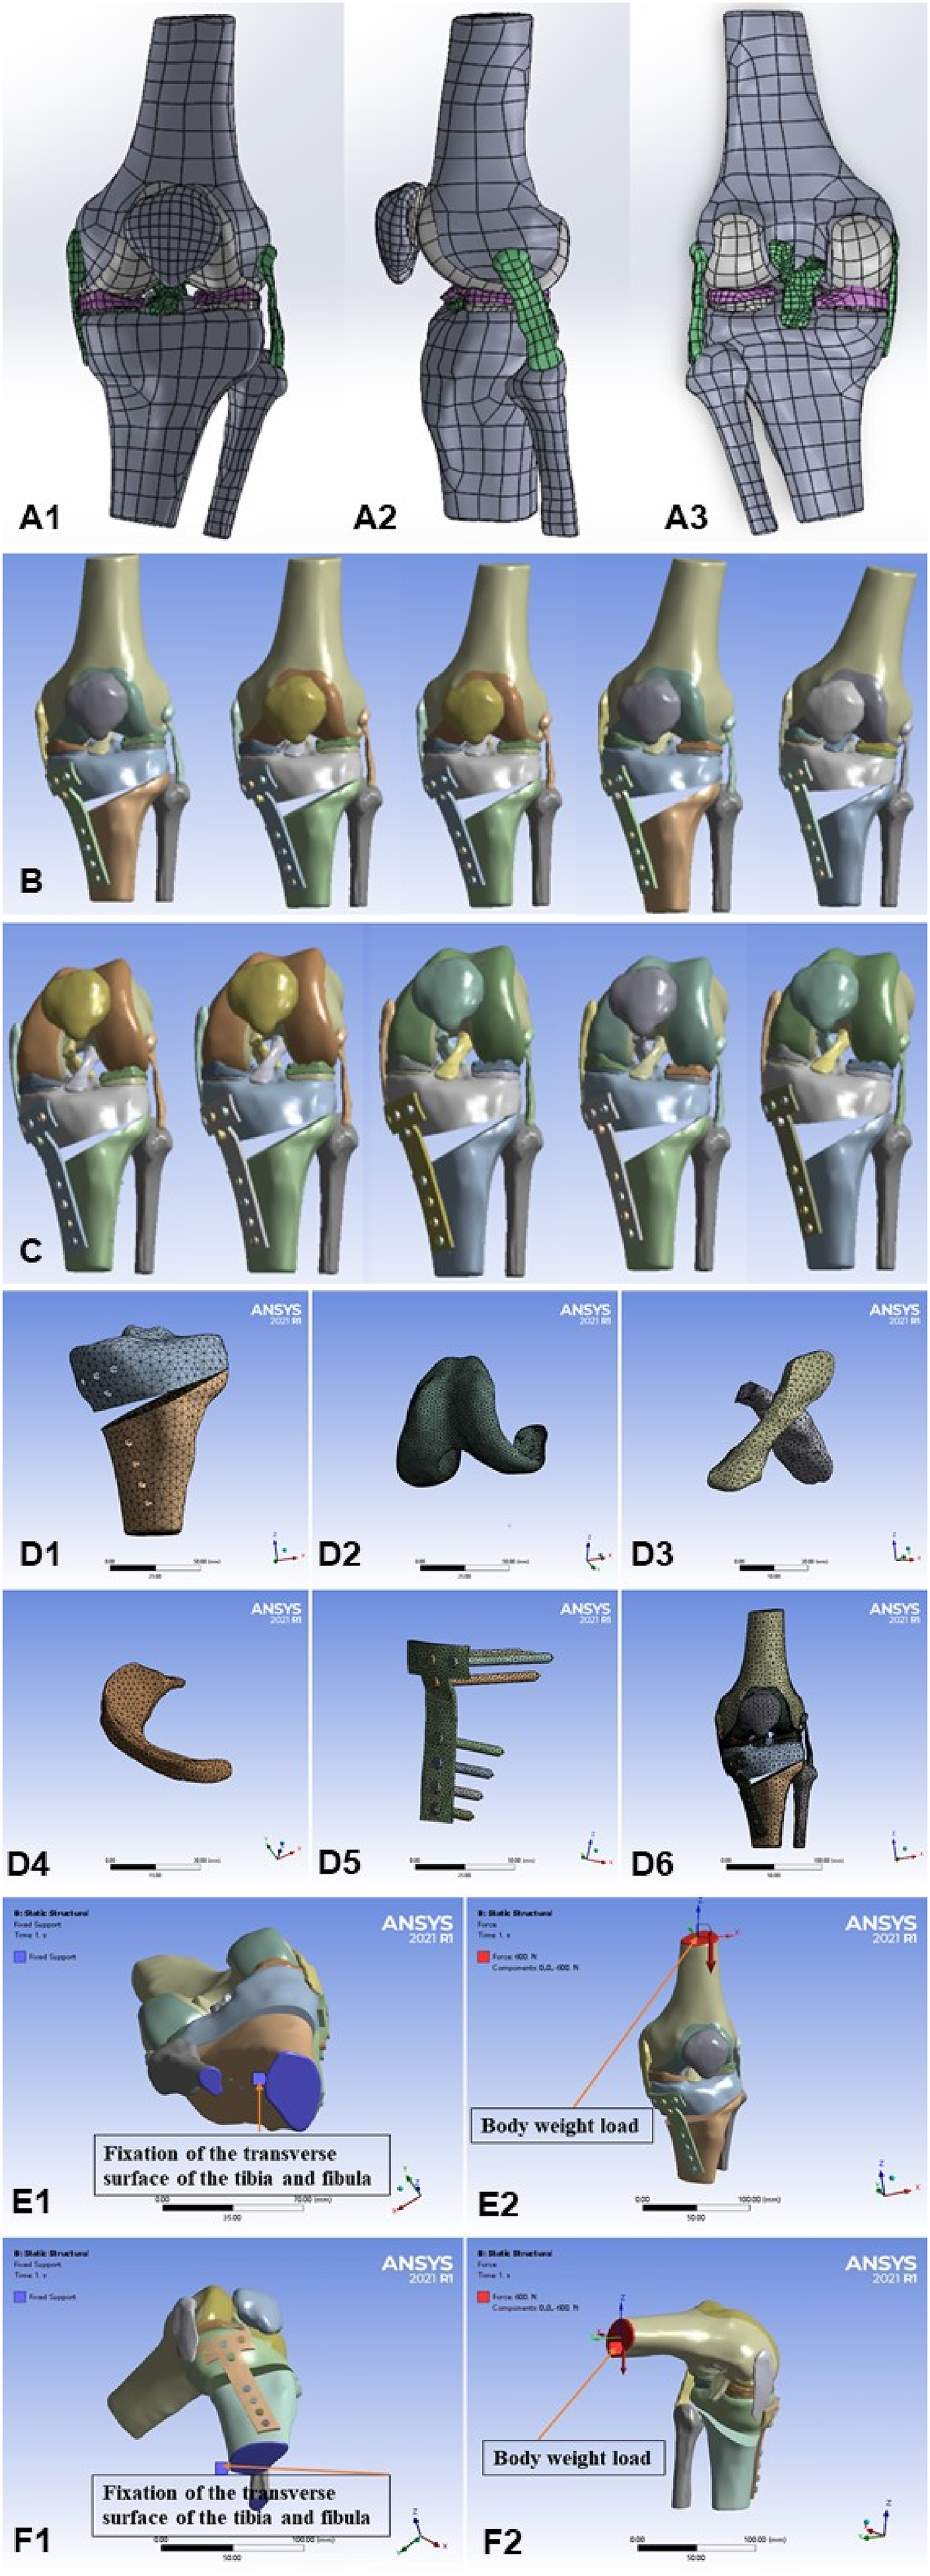
Material properties
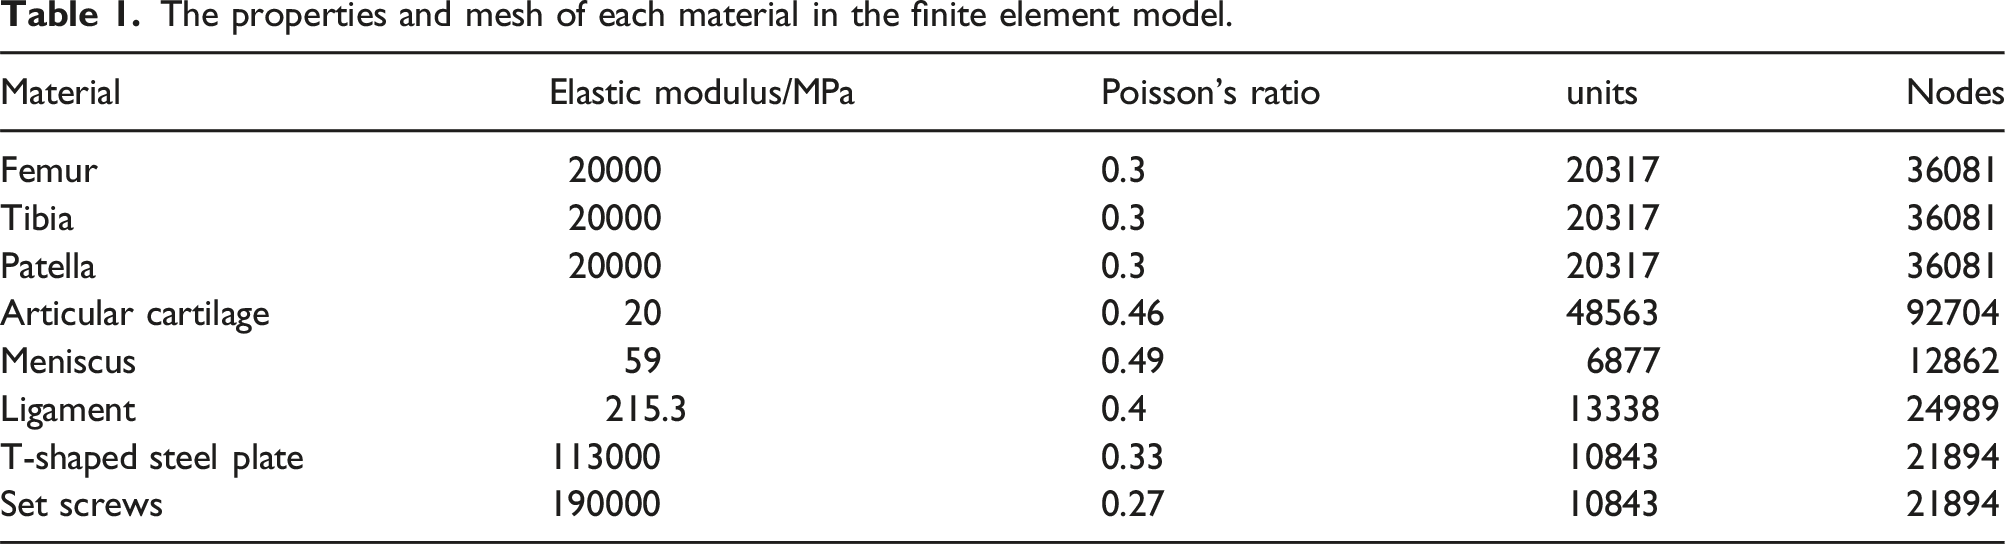
The properties and mesh of each material in the finite element model.
Loads and boundary conditions
To simulate the presence of intra-articular synovial membrane and fluid, a frictional coefficient of 0 was adopted in the face-to-face contact elements between the cartilages of the femur and tibia, as well as the cartilages of the femur and patella. Considering that the weight of the volunteers was 60 kg, a single axial load of 600N at the knee joint extension and flexion 90° was applied on the upper edge of the proximal femur under the condition of restraining the distal tibia and fibula. In addition, the directions of X-axis (from right to left), Y-axis (from anterior to posterior), and Z-axis (from distal to proximal) were defined respectively (Figure 1(e), and 1(f)).
Finite element analysis
The max von Mises stress values and distribution nephogram for three compartments of the knee joint in each OWHTO model, such as femoral condylar cartilage, tibial plateau cartilage, patellar cartilage, meniscus, were obtained from ANSYS software, respectively. Meanwhile, the joint line height, patella height, and joint line convergence angle (JLCA) were measured according to the specific method described.
Clinical data collection
The patients with varus KOA and underwent OWHTO in the [BLINDED] Medical University from September 2019 to November 2022 were collected and included in this study. The following patients were excluded: (1) Patients with trauma, infection or other surgeries on the operated limb during the follow-up period; (2) patients with incomplete preoperative and postoperative imaging data, lost contact or unable to cooperate after postoperative follow-up at least 12 months; (3) Patients underwent other surgical procedures on the ipsilateral limb in addition to OWHTO, including arthroscopic operations (such as meniscectomy, cartilage repair and synovial debridement).
Radiological evaluation
At the preoperative and last follow-up, the following radiological data of patients on X-ray (panoramic view of the lower limbs, anterioposterior and lateral view of the knee joint, patellar Merchant 45° view) were collected from the PACS system of the [BLINDED] Medical University: (1) the changes of correction angle (ΔHKA); (2) the changes of patella height (ΔBPI, ΔISI); (3) the changes of patella index (ΔPFI); (4) the changes of joint line height (ΔJLH); (5) the changes of JLCA (ΔJLCA); (6) the Kellgren-Lawrence (KL) grading scale in non-weight-bearing position for tibiofemoral joint and the Iwano grading scale for patellofemoral joint. The details of the above parameters were shown in Figure 2. The radiological evaluation in this study. (a) Measurement details of relevant preoperative X-ray parameters. A1: HKA angle; A2: JLH: the distance between fibular head and the plane passing through the highest point of the lateral tibial plateau and perpendicular to the tibial mechanical axis. A3: BPI = b/a. A4: ISI = b/a. A5: JLCA: Angle between the joint line of the proximal tibia and the joint line of the distal femur. A6: PFI: Ratio of the width of the medial and lateral patellofemoral joint gaps; PFI = a/b. (b) Measurement details of relevant postoperative X-ray parameters; (c) K-L grading is an indicator of osteoarthritis degeneration in the medial and lateral compartments of the knee joint. (d) Iwano grading is an indicator for assessing patellofemoral joint degeneration. Note: HKA = Hip-knee-ankle, JLH = Joint line height, BPI = Blackburne Peel Index, ISI = Insall-Salvati index, JLCA = Joint line convergence angle, PFI = Patellofemoral index. K-L = Kellgren-Lawrence.
Clinical evaluation
The knee functions of patients were assessed by using three clinical scales at preoperative and the last follow-up, such as Kujala score for patellofemoral joint, 37 American Special Surgery Hospital Knee Score (HSS) for tibiofemoral joint, 38 and Visual Analogy Score (VAS) 38 for the knee pain.
Statistical analysis
The collected observation data were summarized, and then were imported into SPSS 27.0 software for processing and analysis. Among them, general data such as age, gender, BMI, and follow-up time were expressed by mean ± standard deviation. For correlation analysis, the Pearson correlation test was used for continuous variables with a normal distribution, by contrast, the Spearman nonparametric correlation test was used for continuous variables with an abnormal distribution, as well as the ranked variables. In addition, Kruskal-Wallis Test was used for the multi-group comparison variables with an abnormal distribution. The P value <.05 was considered as statistically significant differences.
Results
Finite element analysis results
The effects of different osteotomy distraction gaps on the joint line, the patella height and the JLCA in OWHTO
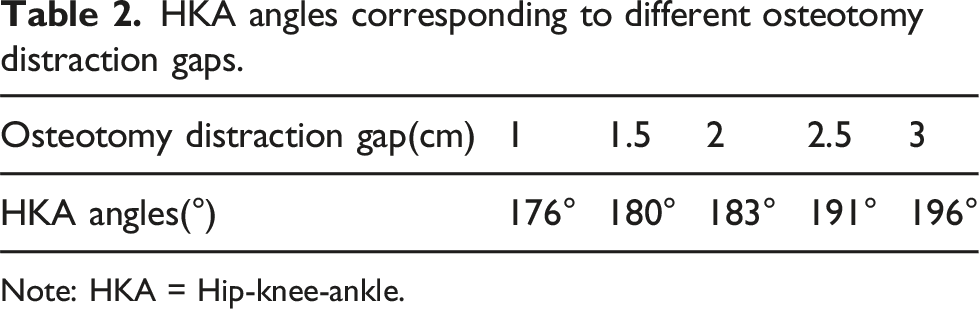
From Figure 3 and Table 2, it could be seen that the corrected HKA angles were 176°, 180°, 183°, 191°, and 196° when the osteotomy distraction gap was sequentially stretched to 1, 1.5, 2, 2.5, and 3 cm. Furthermore, the joint line gradually moved superiorly and JLCA slightly declined, with the increase of osteotomy distraction gaps. In terms of patella height, ISI did not change, but BPI decreased. Furthermore, the correlation analysis showed that a positive linear relationship was observed between the joint line and osteotomy distraction gaps (R2 = 0.980), but a negative linear relationship was investigated between BPI and osteotomy distraction gaps (R2 = 0.995), as well as JLCA and osteotomy distraction gaps (R2 = 0.989) (Figure 4). The effects of different osteotomy distraction gaps on JLH, the patella height (ISI, BPI) and the JLCA in OWHTO. Note: JLH = Joint line height, ISI = Insall-Salvati index, BPI = Blackburne Peel Index, JLCA = Joint line convergence angle, OWHTO = Open Wedge High Tibial Osteotomy. HKA angles corresponding to different osteotomy distraction gaps. Note: HKA = Hip-knee-ankle. Relationship between different osteotomy distraction gaps on the joint line, the patella height and the JLCA in OWHTO. Note: JLH = Joint line height, JLCA = Joint line convergence angle, ISI = Insall-Salvati Index, BPI = Blackburne Peel Index, OWHTO = Open Wedge High Tibial Osteotomy.

The stress distribution around the knee joint in extending position after OWHTO with different osteotomy distraction gaps
The equivalent stress nephograms showed the overall stress distribution characteristics of three compartments of the knee joint in extending position after OWHTO with different osteotomy distraction gaps (1, 1.5, 2, 2.5 and 3 cm) (Figure 5). Specifically, the maximum stress of medial compartment of the knee joint took place in the anterior region of medial femoral condyle cartilage, medial tibial plateau cartilage and the anteromedial horn of medial meniscus, and did not change with the increase of the osteotomy distraction gaps. The similar stress distribution characteristics were also observed in the lateral compartment of the knee joint, with the maximum stress concentrated in the front of the lateral femoral condyle cartilage, lateral tibial plateau cartilage and anterolateral horn of lateral meniscus. In terms of patellofemoral joint compartment, the maximum stress occurred above the anterior femoral condyle cartilage and below the patellar cartilage after OWHTO with different osteotomy distraction gaps. The stress distribution of three compartments of the knee joint in extending position after OWHTO with different osteotomy distraction gaps. Note: OWHTO = Open Wedge High Tibial Osteotomy.
Significantly, the trends of maximum stress changes of three compartments of the knee joint under different osteotomy distraction gaps were observed in Figure 6. In the medial compartment of the knee joint, the maximum stress of medial tibial plateau cartilage and medial meniscus showed the trend of increasing first and then reduced with increasing of osteotomy distraction gaps, reaching a peak value of 12.8 MPa and 8.9 MPa respectively, when the osteotomy gap was distracted by 2 cm. However, the moderate changes of maximum stress were found in the medial femoral condyle cartilage. In addition, as the osteotomy gap was gradually distracted, the maximum stress in the lateral compartment of the knee joint gradually increased, and it was most pronounced when the osteotomy gap was distracted by 2 and 2.5 cm. Nevertheless, the maximum stress variation of the patellofemoral joint compartment was not obvious. Trends in the distribution of max von Mises stress in the medial lateral compartment and the patellofemoral joint in the full extending position.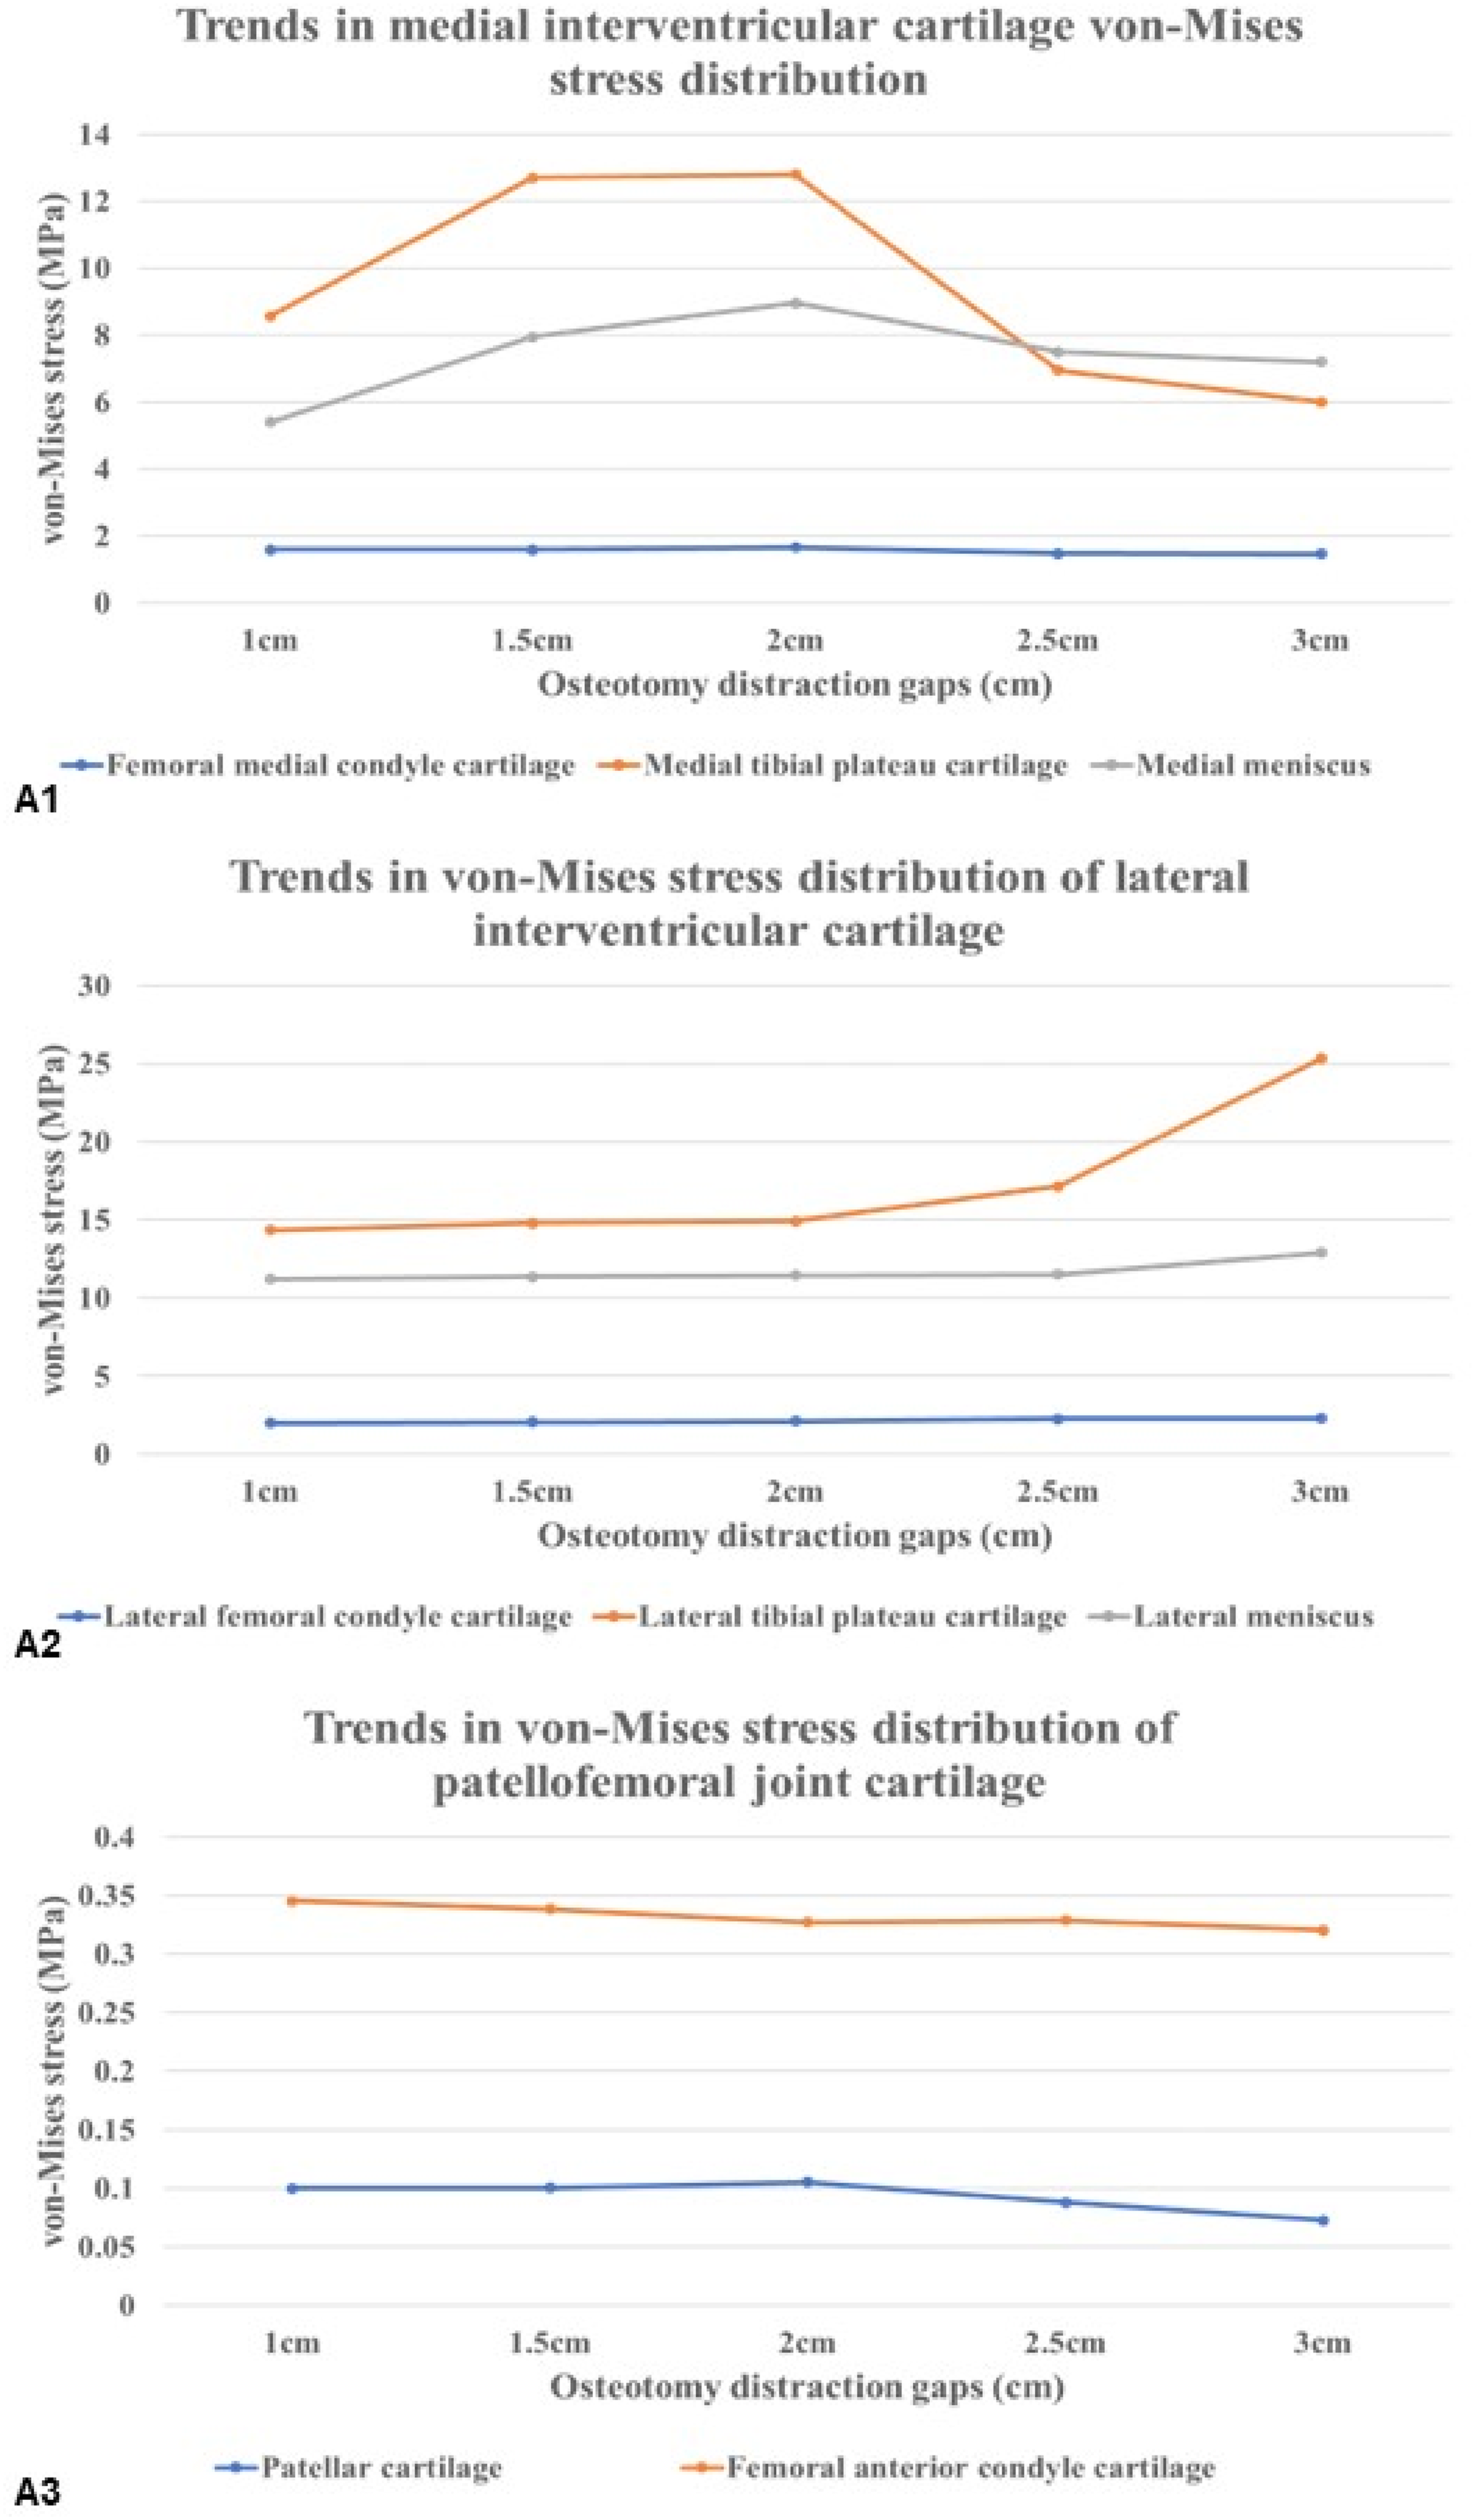
The stress distribution around the knee joint in flexion position after OWHTO with different osteotomy distraction gaps
The other equivalent stress nephograms (Figure 7) exhibited the stress distribution characteristics of three compartments of the knee joint in flexion position after OWHTO with different osteotomy distraction gaps (1, 1.5, 2, 2.5 and 3 cm), which were different from that in extending position. As can be seen from Figure 7, the maximum stress in the cartilage of the medial femoral condyle occurred at the posterior region which does not change with the increase of osteotomy distraction gaps. Although the maximum stresses of the medial tibial condylar cartilage were still concentrated in the anterior region, the maximum stresses of the medial meniscus shifted from the anterior to posterior horn during extension. It was worth noting that the stress distribution in the lateral compartment was more distinctive. The maximum stress in the cartilage of the lateral femoral condyle remain appeared in the posterior area. Similarly, the maximum stresses in the lateral meniscus were located at the posterior horn, where it was in contact with the posterior condyle of the femur during the knee extension. Additionally, we could see that the meniscus body was another stress concentration area in the medial compartment of the knee. Furthermore, we also noticed the discrepancy in stress distribution of patellofemoral joint compartment between flexion and extension of the knee. In spite of the fact that the upper edge of anterior femoral condyle remained the largest stress zone, a stress concentration area was observed in the medial femoral condyle. Meanwhile, the maximum stresses on the patellar cartilage shifted from the inferior to superior pole of the patella. The stress distribution of three compartments of the knee joint in flexion position after OWHTO with different osteotomy distraction gaps. Note: OWHTO = Open Wedge High Tibial Osteotomy.
Moreover, Figure 8 exhibited the different tendency of maximum stress changes of three compartments from that in extending position of the knee. A trend of increasing and then decreasing was observed in the medial compartment, with the medial meniscus showing the most significant changes, especially when the osteotomy distraction gap was 2 cm. However, a gradually increasing trend was found in the lateral compartment, with the most significant changes being in the cartilage of the lateral femoral condyle. It was worth noting that the maximum stress changes in the patellar cartilage during the knee flexion were most noticeable, and it also showed a trend of increasing and then decreasing. Coincidentally, it also reached its peak when the osteotomy distraction gap was 2 cm. Trends in the distribution of max von Mises stress in the medial lateral compartment and the patellofemoral joint in the flexion 90°.
Clinical data analysis results
Basic information of the included patients
General information of included patients.

Note: BMI = Body mass index; HKA = Preoperative Hip knee ankle; VAS Score = Preoperative VAS Score; HSS Score = Preoperative HSS Score; Kujala Score = Preoperative Kujala Score; K-L = Preoperative K-L Grades; Iwano = Preoperative Iwano Grades.
Correlation analysis between the correction angle and the changes of radiological parameters for the joint line and patellofemoral joint
Correlation analysis between the correction angle and the changes of radiological parameters for the joint line and patellofemoral joint.

Note: This table represents the correlation between ΔHKA and ΔJLH, ΔBPI, ΔISI, ΔJLCA and ΔPFI respectively; *p < .05; **p < .01; ΔHKA = the correction angle of hip-knee-ankle; ΔJLH = The difference between postoperative JLH and preoperative JLH; ΔBPI = The difference between postoperative BPI and preoperative BPI; ΔISI = The difference between postoperative ISI and preoperative ISI; ΔJLCA = The difference value between postoperative JLCA and preoperative JLCA; ΔPFI = The difference between postoperative PFI and preoperative PFI. JLH = Joint line height; BPI = Blackburne Peel index; ISI = Insall-Salvati index; JLCA = Joint line convergence angle; PFI = Patellofemoral index.
Correlation analysis between the correction angle and the radiological severity for the tibiofemoral joint and patellofemoral joint
Correlation analysis between the correction angle and the K-L and Iwano grades on X-ray at the last follow-up.

Note: This table shows the correlation between Δ HKA and K-L, Iwano respectively; **p < .01; ΔHKA = the correction angle of hip-knee-ankle; “r” represents the correlation coefficient.
Differential analysis of the correlation between different correction angle groups on K-L and Iwano grades at the last follow-up.

Note: K-L Grades = Kellgren-Lawrence Grades.
Correlation analysis between the correction angle and the clinic function for the tibiofemoral joint and patellofemoral joint
Correlation analysis between correction angle and VAS score, HSS score and Kujala score at the last follow-up.

Note: This table shows the correlation between Δ HKA and VAS, HSS and Kujala scores, respectively, **p < .01; VAS score = Visual Analogue Scale score; HSS score = Hospital for Special Surgery score.
Differential analysis of the correlation between different correction angle groups on VAS, HSS and Kujala score at the last follow-up.

Note: VAS score = Visual Analogue Scale score; HSS score = Hospital for Special Surgery score.
Discussion
This study aimed to explore the effects of different ODG on the stress distribution of the three compartments of the knee joint after OWHTO through the 3D FEA and then conduct a retrospective clinical study to validate its results. Our results showed that the osteotomy distraction gap could affect the stress distribution of three compartments of the knee joint by altering the joint line height, JLCA and BPI. As the osteotomy gap increased, the stresses in the medial compartment of the knee joint tended to increase and then decrease, whereas the lateral compartment tended to increase gradually, both in the fully extension and 90° flexion positions. The role of osteotomy distraction gap on the stresses of patellofemoral joint was mainly concentrated in the 90° flexion position, which also showed a tendency to increase and then decrease. Remarkablely, osteotomy distraction gap ranged from 2 to 2.5 cm was the turning point for the stress alterations of three compartments of the knee joint. Moreover, the clinical correlation analysis also suggested that the correction angle affected the postoperative functional recovery of OWHTO patients, and may be relatively reasonable in the range of 9–12°.
In terms of correlation between ODG and radiological parameters of knee joint, our results showed that the joint line height gradually shifted upward and JLCA gradually decreased with the increase of ODG, which was in agreement with the previous report.39,40 The change of JLCA after HTO represented the soft-tissue correction, and was related to the movement of joint-loading axis from the medial compartment to the lateral compartment, leading to the medial joint opening and lateral joint closing of the varus knee joint. 41 In addition, it was worth noting that there was a special change in patellar height, with a gradual decrease in BPI and no significant change in ISI. A reasonable explanation was that BPI reflected the relative height of the patella, and was inversely correlated with the height of the joint line.42,43 Therefore, the joint line was elevated and the BPI appeared to decrease, with the increase of ODG. In contrast, ISI showed the absolute height of the patella, which was not correlate with the height of the joint line. 44 According to the previous reports, 45 the osteotomy methods of OWHTO were divided into ascending osteotomy and descending osteotomy. The ascending osteotomy method with the osteotomy plane located proximal to the tibial tuberosity was performed in this study, which did not affect the distance from the lowest point of the inferior pole of the patella to the tibial tuberosity, and also the length of the patella’s maximum diagonal was usually considered to be fixed, so different ODG did not lead to a change in ISI.
Additionally, we further investigated the effect of different ODG on the mechanical distribution of the three compartments of the knee joint. Our results revealed that in the fully extended knee position, with the increase of the osteotomy distraction gap in the range of 1, 1.5, 2, 2.5, 3 cm, the maximum stresses of the medial compartment components such as the medial femoral condylar cartilage, medial tibial plateau cartilage and medial meniscus, were concentrated in the anterior region, and showed the trend of increasing and then decreasing, and reached a peak at the osteotomy distraction gap of 2 cm, especially evident in the medial tibial plateau cartilage and the medial tibial plateau cartilage. In addition, the stress changes of the lateral compartment were more obvious, which gradually increased with the elevation of the osteotomy gap, and the maximum stresses were also concentrated in the anterior region, and reached the peak at the osteotomy distraction gap of 2.5 cm. Previously, the Fujisawa point was considered as the reference for the force line correction in OWHTO, and prompted that cartilage destruction did not progress if the force line passed through 30%–40% of the lateral tibial plateau after OWHTO, and it was the optimal point when it passed through 62%–63% of the tibial plateau.46,47 However, this viewpoint has been challenged and some authors recommend adjusting the correction target should be tailored to the severity of osteoarthritis and the anatomical factors of patients. 48 Combined with our results, the lower extremity force line may be in the optimal state when the osteotomy distraction gap was between 2 and 2.5 cm, and the stresses in the knee joint were shifted from the medial to the lateral compartments obviously when the osteotomy distraction gap exceeded 2.5 cm, so that the tendency of stress increase in the lateral compartments was most pronounced, whereas a significant decrease was observed in the medial compartments. However, the stress changes in the patellofemoral compartment were not significant, due to that patellofemoral joint was a non-weight-bearing joint in the fully extended knee position.49,50 At this time, the maximum stresses in the patellar cartilage were distributed in the inferior pole, which may be attributed to the pulling force of the patellar ligament on the patella.
Moreover, a significant change was observed in the lateral meniscus and the maximum stress distribution shifted to the posterior region in the knee flexion at 90°, although the stress trends in the medial and lateral compartments were similar to those in the fully extended knee position. This was related to the close contact between the posterior femoral condyle and the posterior cartilage of the tibial plateau during knee flexion. Also of note were the changes in the patellofemoral compartment. The maximum stresses on the patellofemoral cartilage also tended to increase and then decrease as the osteotomy distraction gaps gradually widened, and also peaked at 2 cm of osteotomy distraction gap. This seems to contradict previous findings. 51 Previous studies 52 have concluded that joint line elevation caused by OWHTO could change the patellar trajectory, which affected the stress distribution of patellofemoral joint. Therefore, patellofemoral joint degeneration were considered as one of the contraindications for OWHTO.53,54 However, some scholars argued that the biplane osteotomies were often adopted in OWHTO, which had a limited negative effect on patellofemoral trajectory. 55 Significantly, the maximum stress on the patellar cartilage was located in the limbic region when the knee was flexed in the 90° position, and was most obvious in the upper pole. Therefore, it could be assumed that the patellar cartilage was mainly subjected to tensile forces at this time, rather than compressive stresses as traditionally considered. Besides, the trend in the maximum stress on the patellar cartilage may be related to the elevation of the knee joint line caused by OWHTO, which leads to a decrease in the BPI, resulting in the “relative low patella”. Therefore, as the osteotomy gap was expanded and the knee joint line was elevated, the BPI decreased and the pulling force on the patellar cartilage increased gradually in the knee flexion at 90°. When the osteotomy distraction gap exceeded 2 cm, the patella descended into the femur intercondylar fossa, and the pulling force gradually decreased, indicating that the changes of patella trajectory caused by the increase of osteotomy distraction gap were not unvariable. However, it is worth noting that this may be related to the fact that the model in this study only involved the contact between bones and did not simulate the tensile force of the quadriceps femoris muscle.
Combined with the above results, our three-dimensional finite element analysis showed that the effect of the different osteotomy distraction gaps on the medial and lateral compartments of the knee joint after OWHTO was mainly related to the transfer of the force line, and the effect on the patellofemoral compartment was mainly associated with the relative low patella due to the elevation of the knee joint line, especially in the flexion of the knee. This suggested that the adjustment of the force line in OWHTO should take into account the dynamic stress changes of the three compartments of the knee, and the osteotomy distraction gap in the range of 2-2.5 cm may be relatively reasonable in OWHTO for the knee varus deformity (HKA of 168°), so as to avoid the incomplete stress release in the medial compartment due to insufficient force line correction, the excessive pressure of the lateral compartment due to the overcorrection of the force line, and the patellar trajectory disorder caused by the “relative low patella”.
Moreover, a retrospective clinical study was implemented to further reveal the role of different osteotomy distraction gaps on the clinical outcomes of patients after OWHTO. The effects of different correction angles on patients’ imaging parameters (JLCA, patellar height, and JLH) as well as the clinical functional score of knee joint after OWHTO were investigated with the aim of clinical validation for the previous three-dimensional finite element analysis results. It was worth noting that the knee correction angle was used as the main focus in the clinical study, rather than osteotomy distraction gap, due to the inconsistency of the tibial plateau width caused by the individual differences of the clinical patients. It was well known that the correction angle had a trigonometric relationship between the osteotomy distraction gap and tibial plateau width. 16 Therefore, it was more direct and effective to use the correction angle as an assessment. Our data showed that the correction angle after OWHTO was positively correlated with the JLH and patellofemoral index, negatively correlated with the JLCA and BPI, but had no significant correlation with ISI, which was consistent with the above results of the three-dimensional finite element. In addition, a positive correlation was found between the correction angle and the K-L classification and Iwano classification. The K-L classification was the evaluation method for the severity of knee osteoarthritis, which was assessed by standing knee radiographs and was divided into 5 grades. The higher the grading, the more severe the degeneration of the tibiofemoral joint. 56 Iwano staging was to stage the severity of patellofemoral arthritis, which was assessed by patellar axial radiographs and was divided into 4 grades. 57 The combination of the two classifications reflected the degeneration of three compartments of the knee joint. As the correction angle increased, the clinical score also increased, reflecting the degenerative state of the three compartments of the knee joint, which may be a manifestation of overcorrection. 58 Furemore, previous studies had also investigated the role of correction angle on the knee joint degeneration, 59 indicating that the poor limb coronal alignment correction negatively affected the early outcome of OWHTO, especially in the double-level osteotomy. Therefore, to further clarify the optimal range of correction angles after OWHTO, a correlative subgroup analysis was conducted in this study. Our results showed that the K-L classification and Iwano classification of patients were both lower and had a significant correlation, when the correction angle was within the range of 9-12°, suggesting that correction angle for OWHTO ranged from 9 to 12° could improve the overstress situation in the medial compartment of the knee joint, and also avoid the abnormal stresses in the lateral compartment and the patellofemoral compartment. In addition, this study explored the correlation between the correction angle and patients’ subjective feelings after OWHTO by using the VAS scores, HSS scores, and Kujala scores. The results indicated that the correction angle was positively correlated with the VAS score at the last follow-up, while there was no significant correlation with the HSS score and Kujala score. In other words, the greater the correction angle, the more pronounced the knee pain sensation after OWHTO. In addition to the pain, the HSS scores and Kujala scores were comprehensive assessments of the knee function, therefore, a non-correlation was found between the correction angle and the two scores, which may be attributed to the insufficient number of cases.
However, there were still several limitations in this study: (1) the use of FEA model with 168° HKA and without considering muscle force did not accurately reflect real clinical parameters, a dynamic FEA modeling is expected to be adopted in future research; (2) this study only involved a single plane osteotomy model and lacked a double plane osteotomy model; (3) the retrospective study design showed the insufficient level of evidence, the sample size was insufficient and follow-up period was short. The multicenter prospective trials will be conducted in the future; (4) It might not be fully useful to cite a general cutoff for all OWHTO given the diversity of varus deformity. Therefore, more FEA models of varus knee will be established in the future research to come up with corresponding optimal values for load alteration indicated for different ranges of varus deformity to better guide clinical decisions on optimal correction.
Conclusion
To sum up, the ODG could affect the stress distribution of three compartments of the knee joint by altering the JLH, JLCA and BPI. As result of this, limited correction angle should be fully considered in the preoperative planning to avoid overcorrection and patellofemoral joint disorders. For moderate varus knees (HKA: 174-176°), an OWHTO with a correction angle of around 9-12° may yield favorable outcomes, but caution is advised with excessive opening.
Footnotes
Declaration of conflicting interests
The author(s) declared no potential conflicts of interest with respect to the research, authorship, and/or publication of this article.
Funding
The author(s) disclosed receipt of the following financial support for the research, authorship, and/or publication of this article: This study was supported by grants from the National Natural Science Foundation of China (Grant number: 82260427); Science and Technology Plan Project of Yunnan Province Technology Hall (Grant number: 202301AT070134); Yunnan Revitalization Talent Support Program (Grant number: XDYC-QNRC-2023-0198); Yunnan Province medical discipline reserve talent project (Grant number: H-2024030); PhD Research Fund Project of the First Affiliated Hospital of Kunming Medical University (Grant number: 2021BS016).
Consent for publication
Written informed consent for publication of their clinical details and clinical images was obtained from the patient.
Data Availability Statement
The dataset analyzed during the current study are available from the corresponding author on reasonable request.