
Abstract
Background
Knee osteoarthritis (KOA) is a multifactorial whole-joint disease with a high rate of disability. Considering the complexity of KOA, there is an urgent need to discover new molecular pathological markers and multi-target treatment strategies.
Methods
Two datasets, GSE51588 and GSE57218, were downloaded from the Gene Expression Omnibus database and screened for differentially expressed genes (DEGs) using the Gene Expression Omnibus 2R (GEO2R). Gene Ontology (GO)/Kyoto Encyclopedia of Genes and Genomes (KEGG) enrichment analyses of DEGs were performed. A protein-protein interaction (PPI) network was constructed and hub genes were identified using Molecular Complex Detection (MCODE). Receiver-operating characteristic curves (ROC) were plotted for the genes, and their prognostic values were evaluated. The expression levels of the hub genes in the monosodium iodoacetate (MIA)-induced KOA rat model and lipopolysaccharide (LPS)-stimulated C28/I2 cells were verified using reverse transcription quantitative real-time PCR (RT-qPCR).
Results
Overall, 33 DEGs were up-regulated and 6 DEGs were down-regulated in the two datasets. A total of 12 hub genes were identified, including COL15A1, THY1, COL1A1, COL5A1, CTHRC1, MXRA5, FN1, COL1A2, COL3A1, SPARC, COL8A1, and COL2A1, which all could be used as biomarkers to differentiate KOA samples from healthy controls. More importantly, we found that THY1, CTHRC1, SPARC, and COL8A1 were significantly upregulated in vivo and in vitro compared with the controls (p < .01).
Conclusions
The expression levels of THY1, CTHRC1, SPARC, and COL8A1 were elevated and had good prognostic values as biomarkers in KOA.
Background
Knee osteoarthritis (KOA) constitutes the largest proportion of osteoarthritis (OA) and is a whole-joint disease caused by multiple factors. The pathogenesis of KOA involves pathological changes in the articular cartilage, synovium, subchondral bone, ligaments, and muscles. 1 Various stages of KOA include different molecular profiles. Some scientists have proposed the need for molecular classification of KOA, including cartilage degradation-driven, bone remodeling-driven, inflammation-driven, and pain-driven subtypes. 2 However, the current diagnosis and treatment of KOA are mainly based on imaging and clinical findings without considering the molecular and pathological characteristics of the disease, which has resulted in the failure of several clinical trials of drug candidates. 2 In view of the complex pathogenesis of KOA, we need to discover new molecular pathological markers and develop multi-target therapeutic strategies.
Given the complexity of KOA, bioinformatics analysis confers great advantages in the exploration of new biomarkers and the development of new drugs and therapeutic strategies. For example, Xu et al. used bioinformatics analysis to report that EGR1, JUN, MYC, FOSL1, and FOSL2 are hub genes involved in the pathogenesis of OA. Xu et al. used weighted gene co-expression network analysis (WGCNA) and least absolute shrinkage and selection operator (LASSO)-Cox regression analysis to identify three immune-related hub genes in the progression of OA, which included PTGS1, HLA-DMB, and GPR137B. 3 Wang et al. identified four cuproptosis-related genes (DBT, DLST, FDX1, and LIPT1) in the chronic inflammatory microenvironment of OA using bioinformatics analysis. 4
In this study, we aimed to identify novel key molecular markers that are altered in KOA. We began by downloading two raw datasets (GSE51588 and GSE57218) from the Gene Expression Omnibus (GEO) database and identified differentially expressed genes (DEGs). Twelve hub genes were identified, and the receiver-operating characteristic (ROC) curves of the genes were plotted and the area under the curve (AUC) was calculated for each gene. The results revealed that the expression level of these hub genes in KOA tissues had good prognostic values as biomarkers in identifying and discriminating KOA from healthy controls. Moreover, the expression levels of THY1, CTHRC1, SPARC, and COL8A1 were confirmed to be increased in animal and cell models of KOA.
Methods
Datasets
In the GEO database (https://www.ncbi.nih.gov/geo/), we performed a search for “osteoarthritis”. We filtered the datasets that met the criteria for categorization into disease and healthy groups with a minimum of three samples in each group. Furthermore, it was essential to collect OA samples where the lesions included various anatomical structures, such as the cartilage, synovium, meniscus, joint capsule, and subchondral bone plate. The raw microarray dataset GSE51588 (GPL13497; Agilent-026652 Whole Human Genome Microarray 4 × 44 K v2; Jan 09, 2018) consists of40 human OA and 10 non-OA samples, which included lateral tibial and medial tibial tissue samples. The gene expression profile dataset GSE57218 (GPL6947 Illumina; HumanHT-12 V3.0 expression beadchip; Aug 16, 2018) comprises 33 human OA and seven non-OA synovial tissue samples.
Identifying DEGs
Upregulated and downregulated DEGs in the two datasets were identified using the Gene Expression Omnibus 2R (GEO2R) (https://www.ncbi.nlm.nih.gov/geo/geo2r) using the criteria of p ≤ .05 and |logFC| ≥ 1.2 (OA vs control). Batch effects were removed between the two datasets using normalization and were visualized using boxplots. Heatmaps and volcano maps were generated with “gplots” and “ggplot2” packages of R software to visualize the DEGs.
GO enrichment and KEGG pathway analysis of overlapping DEGs
DAVID: Functional Annotation Tool (https://david.ncifcrf.gov/summary.jsp) was used to perform GO enrichment and KEGG pathway analysis of overlapping DEGs. The criterion included the least p-value as the most significant enrichment. Subsequently, R language package was used to plot the bar graph and bubble plot.
Construction of the PPI network and identifying the hub genes
The DEGs lists were uploaded into the online database of Search Tool for the Retrieval of Interacting Genes/Proteins (STRING) (https://www.string-db.org/) to detect PPI that may play important roles in the pathogenesis of KOA. The confidence interaction score for significance was set at 0.4. Cytoscape software (https://www.cytoscape.org/) was used to visualize the PPI network. Molecular Complex Detection (MCODE) was used to identify any critical modules.
Hub gene verification
The “circlize” package in R software was used to draw the GO enrichment chord diagrammap. Subsequently, using the “corrplot” package, we investigated the relationships between the hub genes. The discriminative ability and the diagnostic values of the selected key genes were evaluated using the AUC of the corresponding ROC curves, which was analyzed by “pROC” package in R software.
Construction of KOA rat model
The animal experiments performed in this study 5 were approved by the respective Animal Care and Use Committee and were performed in accordance with the National Institutes of Health Guidelines for the Care and Use of Laboratory Animals. Overall, 12 6–8-week-old healthy male Sprague–Dawley (SD) rats with the body weight of 180–200 g were procured from Beijing Vital River Laboratory Animal Technology Co., Ltd. (Beijing, China). The rats were housed in a standard specific pathogen-free (SPF) animal center with controlled temperature, humidity, and 12 h/12 h light-dark cycles; they received a standard rodent chow diet and water ad libitum. Before the procedure was performed, the rats were adaptively fed for a week.
Subsequently, the rats were randomly divided into two groups—the sham group and the KOA group (n = 6 each). KOA was induced using monosodium iodoacetate (MIA) (Cat. No. 57858 Sigma-Aldrich, St. Louis, Missouri, USA). The rats were anesthetized using an intraperitoneal injection of pentobarbital sodium (50 mg/kg) and ketamine (25 mg/kg). The left hind limb was not treated. The right hind limb was attached to arch it straight up and protrude the joint cavity. On day 1, the rats in the KOA group received an intra-articular injection of 2 mg MIA (in 50 μL saline) through the infrapatellar ligament of the knee joint to induce osteoarthritic changes. The rats in the sham group were administered 50 μL saline alone. Subsequently, 4 weeks later, all rats were euthanized using CO2 asphyxiation, and bilateral knee joint tissues were harvested and frozen immediately at −80°C for later use.
Cell culture and treatment
Human normal chondrocyte cells (C28/I2) were acquired from Icellbioscience Biotechnology Co., Ltd. (Shanghai, China). Cells were cultured in DMEM/F-12 (GIBCO-BRL, Grand Island, NY, USA) containing 10% fetal bovine serum and 1% penicillin-streptomycin at 37°C with 5% CO2. To establish the model of KOA in vitro, C28/I2 cells were stimulated with the 10 µg/mL lipopolysaccharide (LPS; Sigma, St. Louis, MO, USA) for 12 h. 6
Quantitative real-time polymerase chain reaction (RT-qPCR)
Target genes primers list.

Statistics
All data processing and analysis were performed in R Studio (version 4.1.1; R Studio, PBC, Boston, Massachusetts, USA). To compare variables between the two groups, independent Student’s t-test was used. To analyze the statistical significance between two sets of categorical variables, Fisher’s exact test was used. The p-values were two-tailed, and p < .05 was considered statistically significant.
Results
Identifying DEGs
Following differential analysis using GEO2R, 1274 DEGs were obtained in GSE51588 dataset, which included 711 up-regulated genes and 563 down-regulated genes. Similarly, 168 DEGs were obtained in GSE57218 dataset, which included 95 up-regulated genes and 73 down-regulated genes. Figure 1(a) presents the volcano plots of differential gene cluster results of GSE51588 and GSE57218 datasets. The heatmaps of the top 15 up-regulated and down-regulated genes in the GSE51588 and GSE57218 datasets were visualized (Figure 1(b)). Detailed gene lists are summarized in Supplemental Table 2 (GSE51588) and Supplemental Table 3 (GSE57218). The results revealed that sample clustering was good with a high degree of confidence. Venn diagrams were used to identify co-expressed DEGs in the two datasets, resulting in 39 common DEGs. Furthermore, six genes were downregulated and 33 genes were upregulated in both datasets (Figures 2(a) and 2(b)). Data processing and DEGs identification of GSE51588 and GSE57218 datasets. (a) volcano plots of the GSE51588 and GSE57218, in which x-axis is log2FoldChange, y-axis is -log10 (p-value). Red points represent the up-regulated genes, and blue points represent the down-regulated genes. (b) The heatmaps of the GSE51588 and GSE57218, in which every line represents one gene, every column represents a sample. Red squares represent up-regulated genes, blue squares represent down-regulated genes. Venn diagram of shared DEGs. (a) Co-dowregulated DEGs in the GSE51588 and GSE57218 datasets. (b) Co-upregulated DEGs in the two datasets. The sum of the numbers in the individual circles represents the total number of differential genes in that gene set, and the overlapping circles indicate the differential genes that are shared between different groups.

GO and KEGG enrichment analysis
To evaluate the function of DEGs, GO and KEGG enrichment analysis were performed. The categories of GO enrichment analysis include biological process (BP), cellular component (CC), and molecular function (MF). The top six GO terms in each category with the lowest p-value were selected. In the BP, the mainly enriched GO terms included cell adhesion, angiogenesis, and extracellular matrix (ECM) organization. In the CC, DEGs were primarily associated with extracellular space, extracellular region, and endoplasmic reticulum lumen. In the MF, DEGs were mainly involved in integrin binding, protease binding, and ECM structural constituent (Figure 3(a)). The top 10 pathways with the lowest p-value were enriched using KEGG enrichment analysis. The results revealed that DEGs were mainly implicated in human papillomavirus infection, P13K-AKT signaling pathway, advanced glycation end-product (AGE)/receptor for AGE (RAGE) signaling pathway in diabetic complications, and ECM-receptor interaction (Figure 3(b)). GO and KEGG enrichment results. (a) Bubble plot of GO enrichment results. Different color depths of the plots represent different size of the adjusted p values, different size of the plots represent different gene counts of the plots. (b) Bubble plot of KEGG enrichment results.
PPI network construction and hub gene identification
DEGs were uploaded into the STRING database to construct a PPI network. PPI network visualization was performed using Cytoscape (Figure 4(a)). Hub gene module was identified using MCODE plug-in, which contained 12 genes, including collagen type XV alpha 1 chain (COL15A1), Thy-1 cell surface antigen (THY1), collagen type I alpha 1 chain (COL1A1), collagen type V alpha 1 chain (COL5A1), collagen triple helix repeat containing 1 (CTHRC1), matrix remodeling associated 5 (MXRA5), fibronectin 1 (FN1), collagen type I alpha 2 chain (COL1A2), collagen type III alpha 1 chain (COL3A1), secreted protein acidic and cysteine rich (SPARC), collagen type VIII alpha 1 chain (COL8A1), and collagen, type II, alpha 1 (COL2A1) (Figure 4(b)). PPI network construction and Hub gene selection. (a) PPI network of DEGs. (b) Hub gene module. Lines between nodes represent gene-gene interactions. (c) Matrix correlation analysis. To demonstrate and visualize the correlation of genes between matrices through matrix analysis. (d) GO-pathway plot with three parts of data, genes, logFC (multiplicity of change of genes), which is used for ordering and determining the color of the gene blocks, and GO terms.
Hub gene selection
We performed the correlation and GO annotation analysis of the hub genes based on the GSE57218 dataset. To explore correlations between the key genes, the heatmap were plotted for visualization (Figure 4(c)). Additionally, a chord diagram was drawn and visualized using the R package to show the GO-pathway relationships as well as to indicate the function strength of the pathways (Figure 4(d)).
Hub genes diagnosis module construction
ROC curves for COL15A1, THY1, COL1A1, COL5A1, CTHRC1, MXRA5, FN1, COL1A2, COL3A1, SPARC, COL8A1, and COL2A1 were plotted based on the original sample data in the GSE51588 and GSE57218 datasets to explore whether the key genes could be used as diagnostic biomarkers for KOA. The results revealed that the AUC values of these genes exceeded 0.6 in both datasets, indicating their potential as diagnostic biomarkers for KOA (Figures 5 and 6). ROC curves of the 12 hub genes based on the GSE51588 dataset. X-axis represents false positive rate (FPR), y-axis represents true positive rate (TPR). ROC analysis plot of hub gene in GSE57218 dataset. X-axis represents false positive rate (FPR), y-axis represents true positive rate (TPR).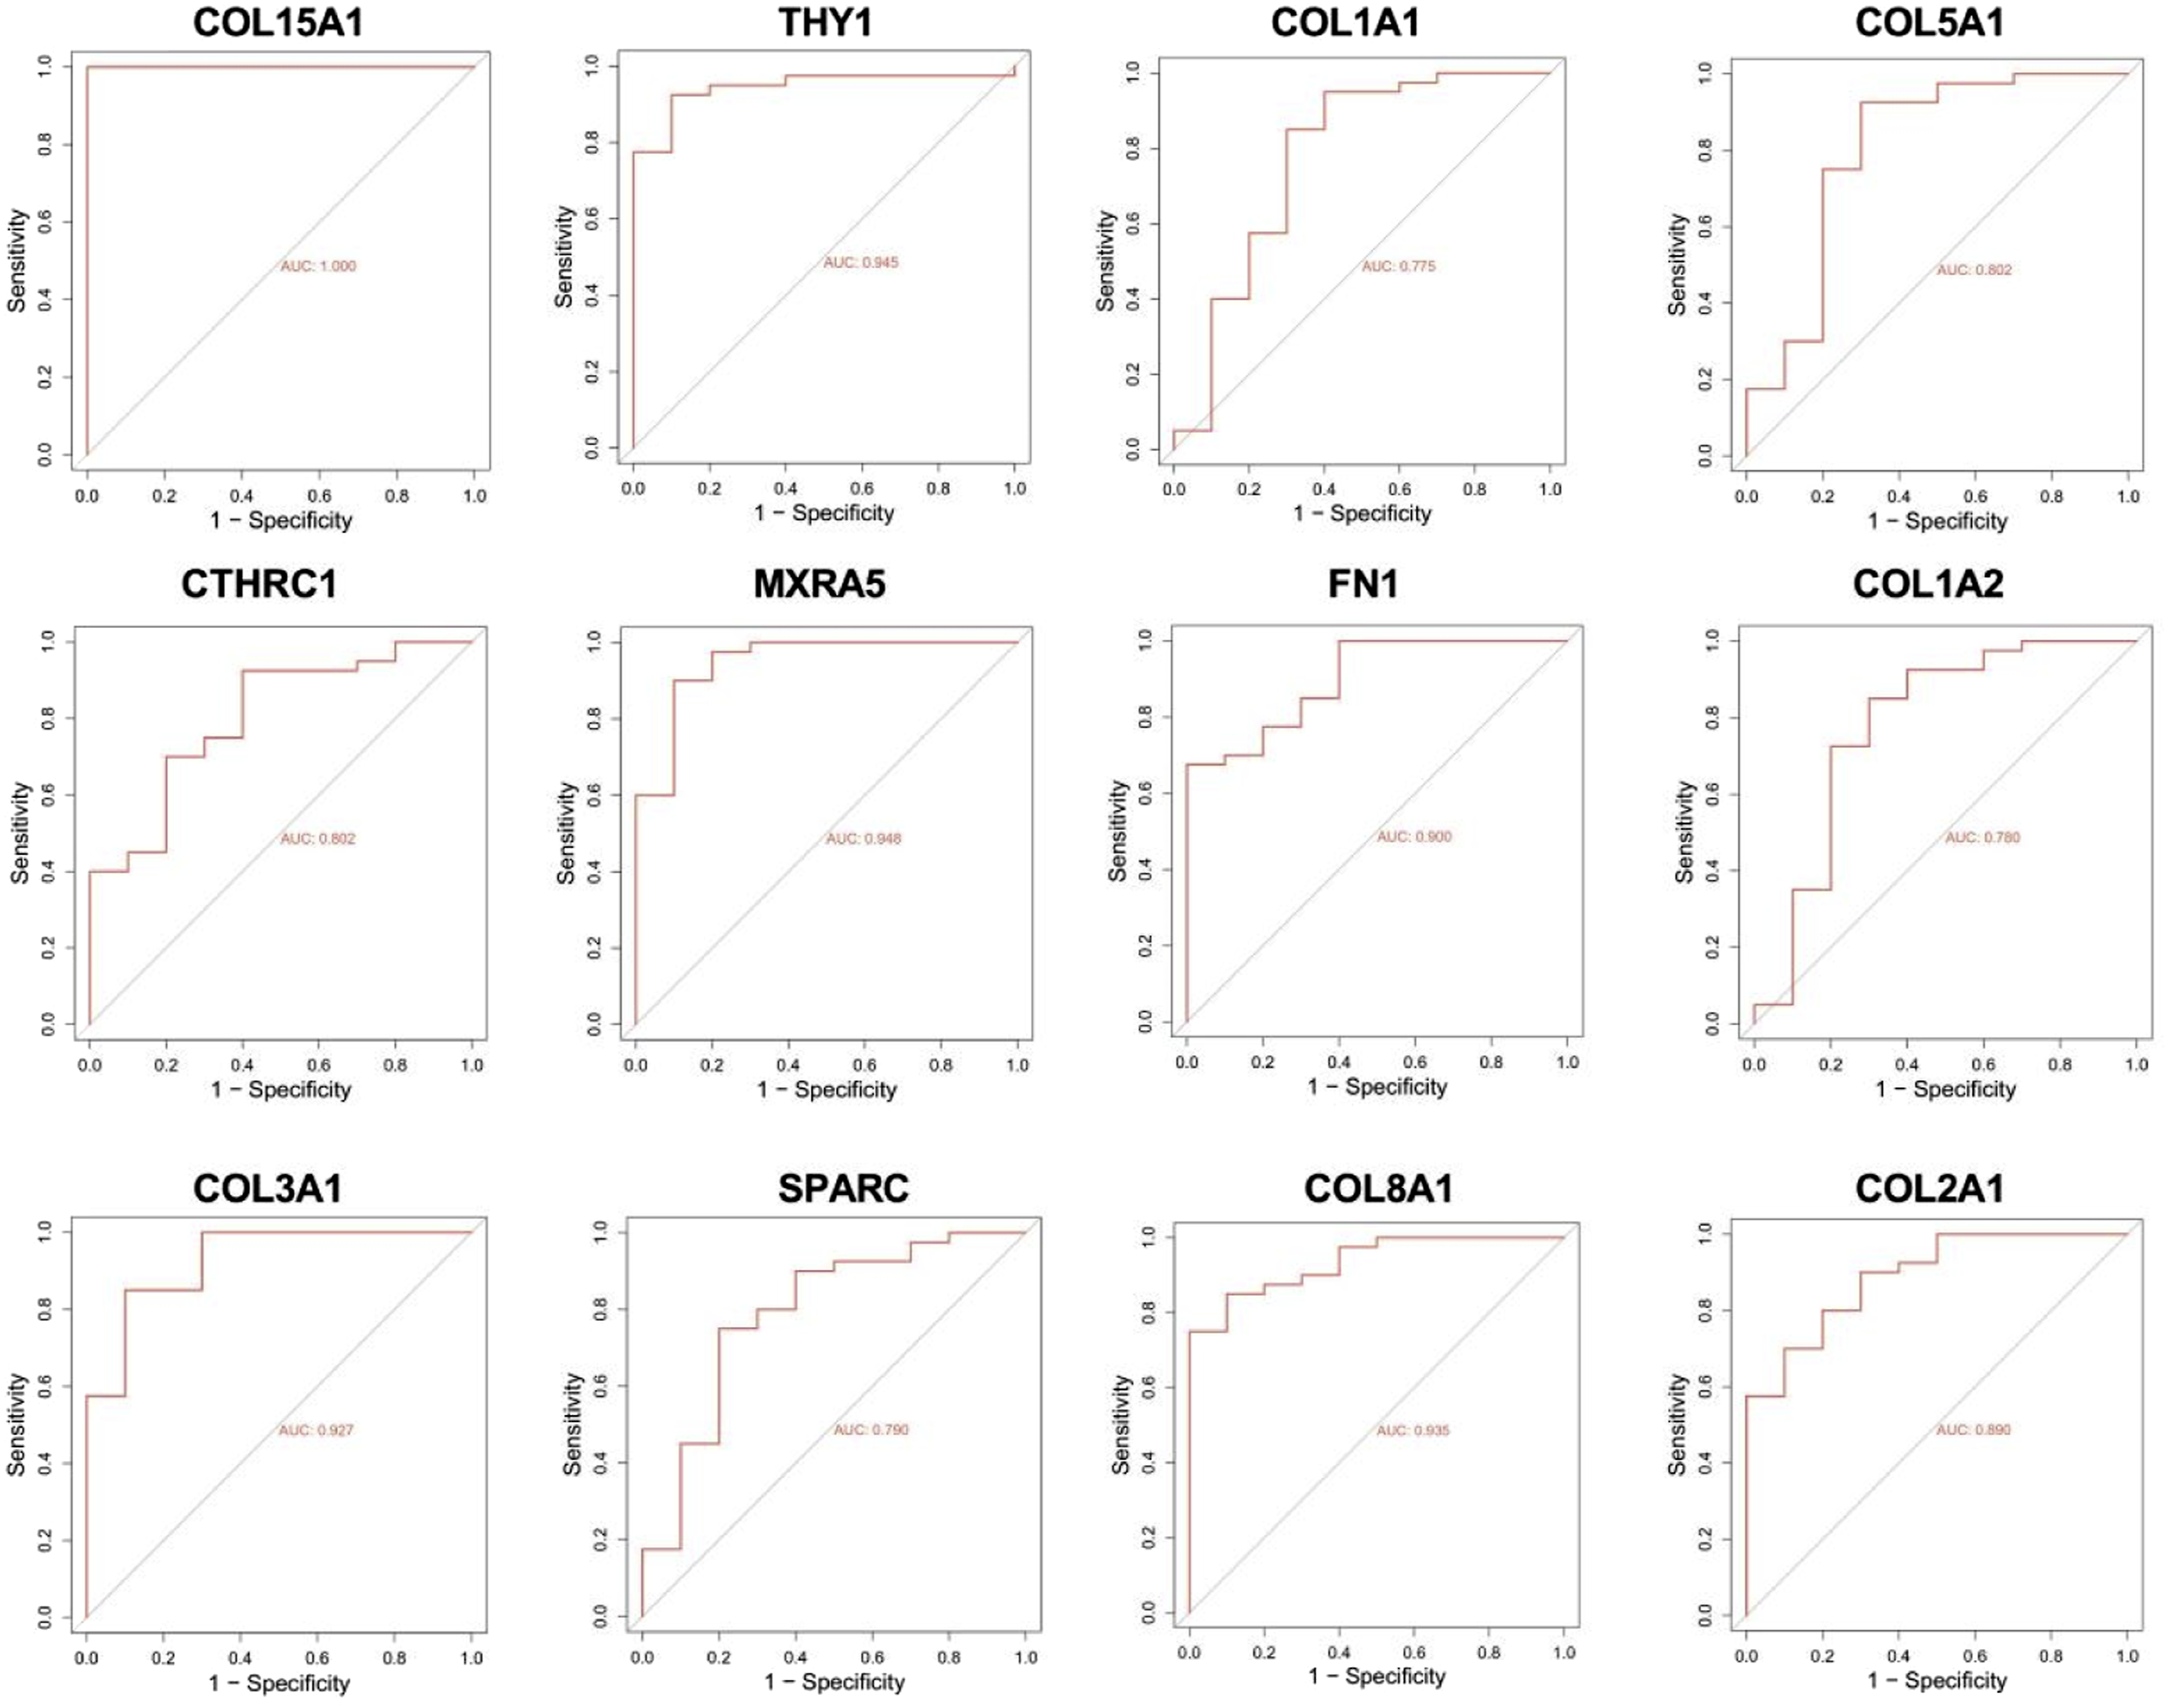

In vivo and in vitro verification of hub genes expression in KOA models
Genes with an MCODE score ≥7, including THY1, CTHRC1, SPARC, and COL8A1, were subsequently screened for expression levels validation. An in vivo KOA rat model was constructed, and knee tissues were collected from rats in the KOA and control groups. RT-qPCR was used to verify the expression levels of the four hub genes. The results revealed that compared to the control group, the expression levels of THY1, CTHRC1, SPARC, and COL8A1 were significantly increased in the KOA group (p < .01; Figure 7(a)). In addition, C28/I2 cells were treated with 10 µg/mL of LPS to mimic an in vitro model of KOA, and the expression levels of four hub genes were detected in vitro. The results showed that the expression levels of THY1, CTHRC1, SPARC, and COL8A1 were significantly higher than those in the control group, which was consistent with the in vivo findings (p < .001; Figure 7(b)). RT-qPCR verification results of hub genes expression in vivo and in vitro. (a) The mRNA levels ofTHY1, CTHRC1, SPARC, and COL8A1 in the monosodium iodoacetate (MIA)-induced SD rat model were measured by RT-qPCR. (b) The expression levels of the four keys in LPS-induced C28/I2 cells were assessed by RT-qPCR. **p < .01; ***p < .001 versus control group.
Conclusions
Based on the results of this study, we identified 12 key genes in the KOA—COL15A1, THY1, COL1A1, COL5A1, CTHRC1, MXRA5, FN1, COL1A2, COL3A1, SPARC, COL8A1, and COL2A. Their expression levels were high in KOA. The 12 hub genes could be used as good clinical biomarkers for identifying and discriminating KOA from healthy controls. The expression levels of COL1A1, secreted phosphoprotein 1 (SPP1), and transforming growth factor beta induced (TGFBI) were the most significantly up-regulated genes. These genes are closely related to KOA. Previous study has shown that elevated level of COL1A1 in KOA is significantly correlated with bone cell fibrosis, and COL1A1 expression is repressed after synovitis ointment treatment in medial meniscectomy rat model of KOA . 7 Furthermore, treatments involving casticin and minoxidil have shown promise in mitigating synovial fibrosis and the progression of KOA by effectively suppressing fibrogenic markers, including COL1A1.8,9 The SPP1 gene, alternatively referred to as secreted phosphoprotein 1 or osteopontin, exhibits high expression levels in serum and is notably linked to the occurrence of KOA. 10 Additionally, findings from a bioinformatics analysis utilizing the GSE114007 dataset unveiled an upregulation of TGFBI in OA, aligning consistently with our obtained results. 11
The GO/KEGG enrichment analysis highlighted that DEGs were predominantly involved in the P13K-AKT signaling pathway, AGE/RAGE signaling pathway in diabetic complications, and ECM-receptor interaction. In the Chinese Han population, genetic variation of PI3K/AKT/mTOR is linked to KOA susceptibility, underscoring its pivotal role in the pathophysiology of this condition. 12 Research suggests a direct correlation between the AGE/RAGE pathway and age-related KOA, with its dysregulation acting as a sex-dependent factor driving the progression of the disease. 13 Mechanistically, elevated levels of prostaglandin E2 and nitric oxide by AGE, potentially mediated through the MAPK pathway for prostaglandin E2 and the NF-kappaB pathway for NO, may contribute to enhanced inflammatory responses in OA chondrocytes. 14 In humans, ECM primarily comprises proteins, particularly collagen, and glycosaminoglycans (predominantly proteoglycans), which are secreted by neighboring cells. Various ECM components are intricately linked to the growth, development, and remodeling of cartilage cells. 15 A previous bioinformatics analysis focusing on hydroxymethylation in OA identified several collagen genes, including COL1A1, COL1A2, COL2A1, COL3A1, COL5A1, COL5A2, COL6A1, COL8A1, COL11A1, and COL24A1. 16 More importantly, in this study, we screened 12 key KOA-associated genes, including COL15A1, THY1, COL1A1, COL5A1, CTHRC1, MXRA5, FN1, COL1A2, COL3A1, SPARC, COL8A1, and COL2A, which could all serve as diagnostic biomarkers for KOA.1 The COL15A1, COL1A1, COL5A1, COL1A2, COL3A1, COL8A1, and COL2A1 genes all belong to the collagen gene family, encoding various types of collagen proteins that are essential components of the ECM and crucial for maintaining the structural integrity of various tissues. 17 Mutations in COL1A1 and COL1A2 contribute to Osteogenesis Imperfecta and Ehlers-Danlos syndrome, both of which characterized by osteoarticular abnormalities and chronic pain.18,19 Moreover, research suggests that quercetin may modulate genes such as SELE, MMP2, and COL1 through the AGE/RAGE signaling pathway in diabetic complications, potentially exerting antagonistic effects on OA. 20 Additionally, COL3/ADAMTS has shown promise as a biomarker for early OA, with COL3 degradation implicated in clinical knee pain. 21 These results illustrate that collagen plays an important role in the development of OA.
Subsequently, we screened genes with MCODE score ≥7 (THY1, CTHRC1, SPARC, COL8A1) for expression exploration. THY1, or cluster of differentiation 90 (CD90), is a glycosylphosphatidylinositol-anchored cell surface protein primarily expressed in thymocytes, neurons, fibroblasts, and mesenchymal stem cells (MSCs). It plays a critical role in various cellular functions, including differentiation, migration, and cell adhesion. 22 THY1 is an important marker in the differentiation process of MSCs. It is reported that placenta-derived MSCs had a 98.46% positive rate of the THY1 surface marker, which promotes chondrocyte proliferation and migration, protects cartilage, alleviates pain symptoms, and regulates the expressions of COL2 and MMP13, thus significantly reverses the progression of KOA. 23 Moreover, the subset of CD34 (+) THY1 (+) synovial fibroblasts in arthritic joints shows elevated osteoblastic and chondrogenic potential in vitro 24 CTHRC1 is a highly conserved secreted 28 kDa glycoprotein. In adults, it is mainly expressed in the bone matrix and periosteum, myocardium, and renal arteries. 25 CTHRC1 is engaged in the regulation of tissue remodeling after injury and ossification and is significantly correlated with cartilage and bone development. 26 In the plasma of patients with OA and reactive arthritis, CTHRC1 level is notably elevated. 27 Additionally, knockdown of CTHRC1 reverses IL-1β-induced chondrocyte apoptosis via inactivating the JNK1/2 pathway. 28 SPARC is a 32 kDa calcium-binding matricellular protein, and its expression is significantly correlated with fibrillar collagens such as COL1. 29 By downregulating the AMPK/Foxo3a signaling pathway, SPARC secreted by ovariectomy-induced OA subchondral osteoblasts promotes chondrocyte degeneration under estrogen withdrawal. 30 SPARC expression is upregulated upon benzophenone-3 treatment, which in turn regulates ferroptosis in OA. 31 Furthermore, a Bidirectional Mendelian and bioinformatics analysis revealed that gene COL8A1 may play a crucial role in regulating both sleep apnea syndrome and OA. 32 Our findings demonstrated that the mRNA levels of THY1, CTHRC1, SPARC, COL8A1 were elevated in the MIA-induced SD rat model and LPS-induced chondrocytes, indicating that they might be involved in the occurrence and progression of KOA. There are some limitations to our study. Firstly, through GO and KEGG enrichment analysis, we identified important pathways that were correlated with KOA, including the P13K-AKT signaling pathway and AGE/RAGE signaling pathway. However, our analysis was confined to the DEGs in KOA only. Additionally, due to time constraints, we only performed RT-qPCR for the key genes and did not perform other relevant validation experiments. The roles of these key genes in KOA and the associated molecular mechanisms will be explored in future studies.
Conclusion
The study obtained 12 diagnostic markers for KOA, and then their mRNA expression levels were detected in the MIA-induced animal model and the LPS-induced C28/I2 cell model. Our findings provide potential diagnostic biomarkers in the clinical management of KOA and advance understanding of the pathogenesis of KOA.
Supplemental Material
Supplemental Material - Diagnostic biomarkers in knee osteoarthritis: Based on bioinformatics and experimental verification in vivo and in vitro
Supplemental Material for Diagnostic biomarkers in knee osteoarthritis: Based on bioinformatics and experimental verification in vivo and in vitro by Yaqian Wen, Mengdi Zou, and Chujie Chen in Journal of Orthopaedic Surgery.
Footnotes
Author contributions
Chujie Chen design of the work. Yaqian Wen and Mendi Zou analyzed and interpreted the data and was a major contributor in writing the manuscript. Yaqian Wen completed the modeling and validation of animal experiments. All authors read and approved the final manuscript.
Declaration of conflicting interests
The author(s) declared no potential conflicts of interest with respect to the research, authorship, and/or publication of this article.
Funding
The author(s) disclosed receipt of the following financial support for the research, authorship, and/or publication of this article: This study was supported by Science and Technology Program of Guangzhou, China (grant no. 202102080347).
Ethical statement
Supplemental Material
Supplemental material for this article is available online.
Appendix
References
Supplementary Material
Please find the following supplemental material available below.
For Open Access articles published under a Creative Commons License, all supplemental material carries the same license as the article it is associated with.
For non-Open Access articles published, all supplemental material carries a non-exclusive license, and permission requests for re-use of supplemental material or any part of supplemental material shall be sent directly to the copyright owner as specified in the copyright notice associated with the article.