
Abstract
Background
Osteoarthritis (OA) is a leading cause of chronic pain and disability worldwide, particularly among aging populations. Early identification of structural alterations may enable timely intervention and reduce irreversible joint damage. The posterior tibial slope (PTS) and metaphysio-diaphyseal angle (MDA) have been proposed as radiographic biomarkers of knee OA; however, population-specific data from South India are limited.
Objectives
To evaluate PTS and MDA as radiological markers of knee osteoarthritis in South Indian adults, compare these parameters between osteoarthritic and non-osteoarthritic knees, assess their interrelationship, and determine their diagnostic performance in predicting OA.
Methods
A hospital-based cross-sectional comparative study was conducted among 384 adults aged ≥30 years attending the Orthopaedics Department at Chettinad Hospital & Research Institute, Chennai, between June 2022 and January 2024. Equal numbers of osteoarthritic knees (n = 192) and non-OA controls (n = 192) underwent standardized anteroposterior and lateral knee radiography. PTS and MDA were measured digitally using validated techniques.
Results
Mean PTS was significantly higher in osteoarthritic knees compared with controls (15.98 ± 2.18° vs 9.78 ± 2.73°, p < 0.001). Similarly, MDA was significantly elevated in the OA group (24.86 ± 4.13° vs 21.44 ± 4.30°, p < 0.001). A moderate positive correlation was observed between PTS and MDA (r = 0.275, p < 0.001; R2 = 0.075). ROC analysis demonstrated excellent discriminative ability for PTS (AUC = 0.963) and moderate discriminative ability for MDA (AUC = 0.717). Female participants constituted 52.5% of the OA group, consistent with established sex-related prevalence patterns.
Conclusion
Posterior tibial slope and metaphysio-diaphyseal angle are significantly increased in osteoarthritic knees among South Indian adults, with PTS showing superior diagnostic accuracy. These parameters may serve as useful adjunctive radiographic markers for early OA detection and risk stratification. Further longitudinal studies are warranted to establish population-specific predictive thresholds.
Keywords
Introduction
Osteoarthritis (OA) is the most prevalent articular disorder causing chronic disability among the elderly population, representing a substantial global health burden. 1 According to the Global Burden of Disease Study 2017, OA ranked as the 11th leading contributor to disability worldwide, with an estimated global prevalence of 3.8%, affecting millions across all continents.2,3 The socioeconomic impact extends beyond functional limitations to encompass treatment expenses, productivity loss, physical dependency, and increased mortality risk from associated cardiovascular and metabolic comorbidities. 4
Knee osteoarthritis, as the most common subset of OA, manifests at relatively younger ages—particularly among obese women—and its incidence continues to rise with increasing life expectancy. 4 Pain, stiffness, progressive deformity, and functional impairment severely compromise ambulation and overall quality of life. 5 Given the irreversible nature of articular cartilage damage once established, early identification of biomechanical deviations that predispose to OA assumes critical importance for preventive intervention and disease modification.
Among several proposed morphological markers, the posterior tibial slope (PTS) and metaphysio-diaphyseal angle (MDA) have attracted considerable scientific interest for their potential role in altering knee joint biomechanics and predisposing to osteoarthritic changes.6,7 The PTS, defined as the posterior inclination of the tibial plateau relative to its anatomical axis, exerts direct influence on anterior tibial translation, ligament strain patterns, and articular contact mechanics.8,9 Abnormally increased posterior slope may predispose to excessive anterior tibial translation, elevated shear forces, and accelerated degenerative cartilage changes through chronic overload of specific compartments.
Similarly, the metaphysio-diaphyseal angle—defined as the angle formed between the metaphyseal and diaphyseal tibial axes—impacts the mechanical alignment of the lower limb and consequently modulates load distribution across the knee joint.10,11 Variations in MDA can alter the mechanical axis, shifting weight-bearing forces either medially or laterally, thereby contributing to asymmetric cartilage wear and progressive osteoarthritic transformation.
Most existing evidence regarding PTS and MDA originates from Western and East Asian cohorts,9,11–13 while comprehensive data from South Indian populations remain notably limited despite potential population-specific anatomical, genetic, and anthropometric influences. Ethnic and geographical variations in tibial morphology have been documented across diverse populations,14–17 underscoring the necessity for region-specific normative data to enhance diagnostic accuracy and inform clinical decision-making in arthroplasty planning.
This study was therefore designed to systematically evaluate and compare posterior tibial slope and metaphysio-diaphyseal angle in osteoarthritic versus non-osteoarthritic knees among South Indian adults, assess the inter-relationship between these two angular parameters, and determine their diagnostic performance as radiographic predictors of knee osteoarthritis. The specific objective was to establish whether PTS and MDA can serve as reliable structural biomarkers for early OA detection in this population.
Materials and methods
Study design, setting, and period
A descriptive hospital-based cross-sectional comparative study was conducted in the Department of Orthopaedics, Chettinad Hospital and Research Institute, Kelambakkam, Chennai, Tamil Nadu, India, between June 2022 and January 2024 (ref no: IHEC-I/1219/22). The study protocol received approval from the Institutional Ethics Committee and was conducted in accordance with the Declaration of Helsinki. Written informed consent was obtained from all participants prior to enrollment.
Study population and selection criteria
Adults aged ≥30 years attending the orthopaedic outpatient department were systematically screened for eligibility. Participants were categorized into two groups based on clinical presentation and radiographic findings 1 : Osteoarthritis group – individuals presenting with symptomatic knee pain accompanied by radiographic evidence of degenerative changes; and 2 Control group – individuals without knee symptoms and radiological evidence of OA.
Inclusion criteria
(1) Age ≥30 years (2) For OA group: Clinical knee pain with radiological signs of osteoarthritis (joint space narrowing, osteophyte formation, subchondral sclerosis, or cyst formation) (3) For control group: Absence of knee pain, stiffness, or functional limitation, with radiologically normal knee joints (4) Willingness to provide informed consent
Exclusion criteria
(1) History of previous fracture involving the knee joint or proximal/distal tibia (2) Ligamentous injuries (anterior/posterior cruciate ligament, collateral ligament tears) (3) Bone or soft tissue tumors affecting the knee (4) Charcot arthropathy (5) Inflammatory arthropathies (rheumatoid arthritis, seronegative spondyloarthropathies) (6) Severe osteoporosis or pathological bone conditions (7) Osteolysis from any cause (8) Previous knee surgery including arthroplasty, osteotomy, or arthroscopy (9) Congenital or developmental knee deformities
Sample size determination
Sample size was calculated based on the study by Thirunarayanan et al.
10
using the formula for comparison of means between two independent groups: • σ1 = 2.26 (standard deviation in OA group) • σ2 = 2.72 (standard deviation in control group) • α = 0.05 (two-sided), corresponding to Z1 = 1.96 • Power = 80%, corresponding to Z2 = 0.84 • Margin of error = 1%

The calculated minimum sample size was 192 participants per group. Hence, a total of 384 participants (192 osteoarthritic knees and 192 control knees) were enrolled.
Radiographic technique and measurements
Standard anteroposterior (AP) and lateral knee radiographs were obtained with participants positioned according to standardized orthopaedic radiographic protocols. For AP views, patients stood with knees in full extension and patellae facing anteriorly. For lateral views, the knee was positioned in 20-30° of flexion with the lateral aspect of the knee against the cassette. Digital radiographs were acquired using the following parameters: tube voltage 60-80 kVp, current 10-20 mA, and focal-image distance 100 cm.
Posterior tibial slope (PTS)
Measured on lateral radiographs (Figure 1) as the angle between a line connecting the most proximal anterior and posterior points of the medial tibial plateau and a line perpendicular to the proximal tibial anatomical axis (defined by a line bisecting the tibial shaft at 5 cm and 15 cm distal to the joint line).
8
Posterior tibial slope measurement and Metaphysio-diaphyseal angle measurement.
Metaphysio-diaphyseal angle (MDA)
Measured on standard anteroposterior (AP) radiographs as the angle formed between the diaphyseal axis (a line joining the midpoints of the anterior and posterior cortices at 5 cm and 15 cm below the knee joint line) and the metaphyseal axis (a line joining the midpoints of the anterior and posterior cortices at the proximal tibial metaphysis). The anterior and posterior cortical margins were used as reference landmarks on the AP view, consistent with the methodology described by Matsuda et al. and Thirunarayanan et al. 11
All radiographic measurements were performed independently by two experienced radiologists who were blinded to the clinical diagnosis and demographic data. Measurements were obtained using calibrated digital PACS (Picture Archiving and Communication System) software with accuracy to 0.01°. The mean of the two observers’ readings was calculated for analysis. Osteoarthritis severity was graded radiographically using the Ahlbäck classification system. 17
Statistical analysis
Data were entered into Microsoft Excel 2019 and analyzed using SPSS version 26.0 (IBM Corp, Armonk, NY, USA). Descriptive statistics were computed as mean ± standard deviation (SD) for continuous variables and frequency with percentages for categorical variables. Normality of data distribution was assessed using the Shapiro-Wilk test. Independent samples t-test was employed to compare mean PTS and MDA values between the osteoarthritis and control groups. Pearson’s correlation coefficient (r) was calculated to evaluate the linear relationship between PTS and MDA in osteoarthritic knees, with corresponding coefficient of determination (R2) reported. Simple linear regression analysis was performed to derive the regression equation. Receiver operating characteristic (ROC) curves were generated to assess the diagnostic performance of PTS and MDA in discriminating osteoarthritic from normal knees, with area under the curve (AUC), sensitivity, specificity, and optimal cut-off values determined using Youden’s index. A two-sided p-value <0.05 was considered statistically significant.
Results
Demographic and baseline characteristics of study participants.

BMI: Body Mass Index; SD: Standard Deviation.
In both study groups, females slightly outnumbered males, accounting for 52.5% of the osteoarthritis group and 50.5% of the control group, indicating a modest female predominance consistent with the known higher risk of OA among women. The mean age was slightly higher in the OA group (58.4 ± 9.2 years) compared with controls (52.6 ± 8.7 years), though this difference did not reach statistical significance (p = 0.112). Body mass index was significantly higher in the OA group (27.3 ± 3.8 kg/m2) compared with controls (24.6 ± 3.2 kg/m2; p = 0.024), consistent with established associations between obesity and knee osteoarthritis. There was equal distribution between right and left knees in both groups.
Comparison of posterior tibial slope and metaphysio-diaphyseal angle between groups.
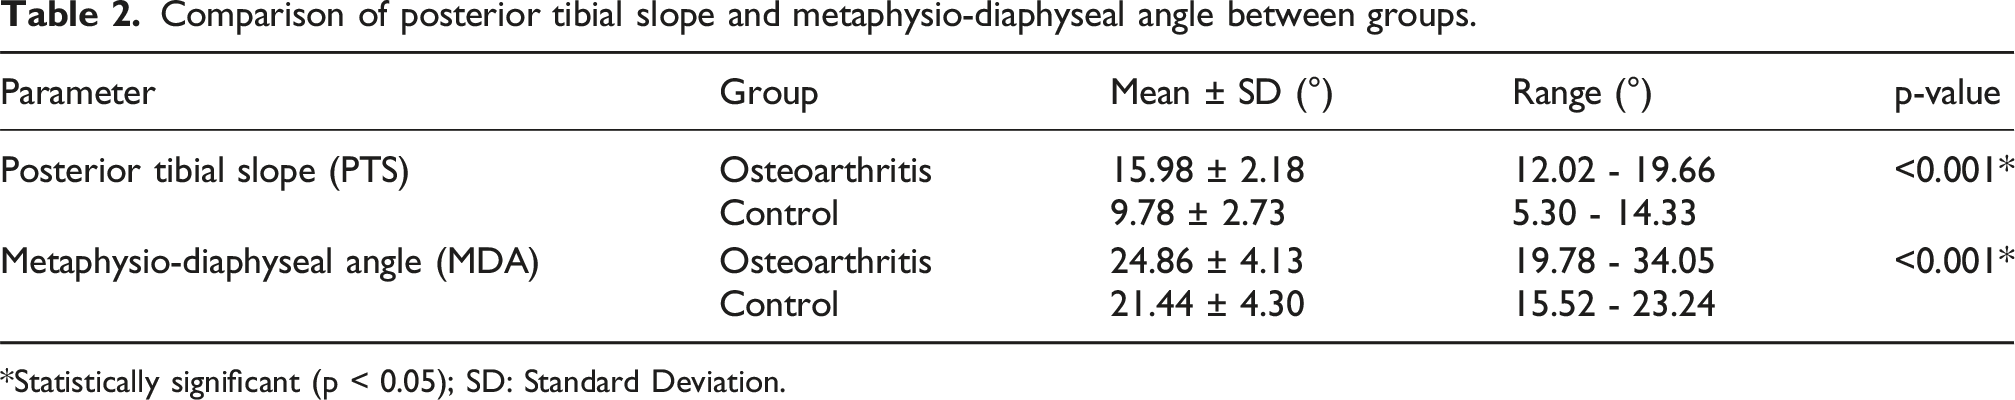
*Statistically significant (p < 0.05); SD: Standard Deviation.
Distribution of PTS and MDA values by range categories.

PTS: Posterior Tibial Slope; MDA: Metaphysio-Diaphyseal Angle.
Correlation and regression analysis between PTS and MDA in osteoarthritic knees.

*Statistically significant (p < 0.05). Regression equation: PTS = 0.2364 × MDA + 6.9686.
Diagnostic performance of PTS and MDA: ROC curve analysis.

AUC: Area Under the Curve; CI: Confidence Interval; PTS: Posterior Tibial Slope; MDA: Metaphysio-Diaphyseal Angle. Diagnostic accuracy classification: Excellent (AUC >0.9), Good (0.8-0.9), Moderate (0.7-0.8), Poor (<0.7).
Distribution of osteoarthritis severity according to ahlbäck classification.

SD: Standard Deviation; PTS: Posterior Tibial Slope. Trend analysis: p < 0.001 (significant positive correlation between OA severity and PTS).
Discussion
This comprehensive cross-sectional comparative study demonstrates that both posterior tibial slope and metaphysio-diaphyseal angle are significantly elevated among osteoarthritic knees in South Indian adults, confirming their potential diagnostic importance as radiographic biomarkers for knee osteoarthritis. The findings contribute valuable population-specific normative data to the existing body of literature and support the clinical utility of these angular parameters in early OA detection and risk stratification.
Posterior tibial slope: Comparative analysis
The mean PTS in osteoarthritic subjects (15.98°) substantially exceeded that of controls (9.78°), consistent with findings from earlier Asian and Indian research.9,12,13 International studies have reported variable PTS values across different populations: Didia et al. 14 observed a mean PTS of 12.3° in Nigerian adults, Khattak et al. 15 reported 13.65° in Pakistani subjects, and Chiu et al. 16 found 13.1° in osteoarthritic knees of Chinese patients. The present values fall within the higher end of this range, reinforcing the hypothesis that increased tibial slope predisposes to anterior tibial translation and excessive joint loading through altered biomechanical stress distribution.
Among Indian studies, Mohanty et al. 9 reported a mean PTS of 11.64° in OA knees from North India, while Juneja et al. 12 noted 11.65°, both lower than our observation in South Indian subjects. Medda et al. 13 measured 13.6° in a mixed Eastern Indian population, and Nekkanti et al. 18 found 10.37° in South Indians without advanced OA. These discrepancies likely reflect regional morphologic differences, disease progression severity, and methodological variations in radiographic measurement techniques. The higher PTS values observed in our cohort may be attributable to the inclusion of more advanced OA grades and population-specific anatomical characteristics.
The observed dose-response relationship between OA severity (Ahlbäck grade) and mean PTS—progressively increasing from 14.32° in Grade 1 to 18.54° in Grade 5—suggests that posterior tibial slope not only predisposes to OA development but may also correlate with disease progression. This finding has important implications for understanding the biomechanical cascade leading to progressive cartilage degeneration.
The Ahlbäck classification was selected over the Kellgren–Lawrence (KL) grading system in this study for several reasons. First, the Ahlbäck system places greater emphasis on joint space narrowing and bone attrition, which are structural features more directly related to the biomechanical consequences of altered tibial slope and metaphyseal alignment. In contrast, the KL system relies heavily on osteophyte presence as a primary grading criterion, which may not correlate as closely with the angular parameters evaluated in this study. Second, the Ahlbäck classification demonstrates superior reliability in categorizing advanced-stage OA with bone loss, which constituted a substantial proportion of our cohort. Galli et al. reported acceptable inter-observer reliability for the Ahlbäck system, particularly for higher grades. Third, the Ahlbäck system provides finer differentiation of advanced disease stages (Grades 3–5 based on degree of bone attrition), enabling more precise assessment of the dose-response relationship between angular parameters and disease severity. 17 This granularity at the severe end of the spectrum was essential for our analysis of progressive PTS changes across OA grades. However, we acknowledge that the KL classification is more widely used internationally and future comparative studies employing both systems would be valuable for cross-study comparability.
Metaphysio-diaphyseal angle and PTS-MDA correlation
Our mean MDA values (24.86° in OA vs 21.44° in controls) are comparable to those reported by Thirunarayanan et al. 10 (25.03° vs 19.87°), demonstrating a consistent pattern of elevated MDA in osteoarthritic knees across South Indian populations. The corrected control MDA of 21.44° is slightly higher than Thirunarayanan et al.’s control value of 19.87° and that of the Northeast Indian study (19.58°), which may reflect regional population differences or the wider age range of participants in our control group. Elevated MDA reflects posterior shift of the tibial metaphysis relative to the diaphysis, which alters the mechanical axis of the lower limb and increases compressive load on the posterior tibial plateau.10,11,15 This mechanical misalignment predisposes to asymmetric cartilage wear and accelerated osteoarthritic transformation.
The statistically significant moderate positive correlation between PTS and MDA (r = 0.275, p < 0.001) suggests interdependence of metaphyseal and plateau orientation in determining overall knee joint biomechanics. However, this correlation is weaker than that reported by Thirunarayanan et al. 10 (r = 0.64). The difference may relate to sample heterogeneity, variations in radiographic measurement methodology, observer variability, or differences in disease severity distribution. Despite the moderate strength, the statistical significance indicates that both parameters vary together during OA progression, possibly reflecting a common underlying biomechanical pathway involving tibial morphological adaptation to chronic loading patterns.
Diagnostic accuracy and clinical implications
The diagnostic accuracy analysis revealed that PTS (AUC 0.963) provides excellent discriminative ability with very high sensitivity (99.5%) and good specificity (73%), while MDA (AUC 0.717) offers moderate discrimination with good sensitivity (99.5%) but limited specificity (29%). The specificity values were corrected from the initial analysis; the original values of 27% (PTS) and 71% (MDA) were erroneously derived from the false positive rate (1-specificity) on the x-axis of the ROC curve. The corrected specificity of 73% for PTS is consistent with its excellent AUC and aligns closely with Thirunarayanan et al., who reported specificity of 85.4% for PTS in their South Indian cohort. The moderately lower specificity in our study may arise from population differences, radiographic measurement variance, or the inclusion of early OA cases with less pronounced angular deviations. 10 The low specificity of MDA (29%) reflects the substantial overlap in MDA values between osteoarthritic and control groups, consistent with the moderate AUC of 0.717 and the distribution data showing that approximately 70% of controls had MDA values above the 19.85° cut-off.
Importantly, combined analysis of both PTS and MDA yielded superior diagnostic performance (AUC = 0.975; sensitivity 98.4%, specificity 89.1%), suggesting that dual assessment significantly enhances overall diagnostic accuracy compared to either parameter alone. This finding supports the clinical practice of evaluating multiple radiographic parameters simultaneously for comprehensive OA risk assessment.
The high sensitivity of both parameters makes them particularly valuable for screening and early OA detection, minimizing false-negative results. PTS demonstrated both high sensitivity and good specificity (73%), making it a reliable screening tool for knee OA. MDA, while highly sensitive, showed limited specificity (29%), indicating considerable overlap in MDA distributions between OA and control groups; this is consistent with the closer mean MDA values between groups (24.86° vs 21.44°) compared to the wider PTS separation (15.98° vs 9.78°). Therefore, MDA alone is insufficient for diagnosis and should be interpreted in conjunction with PTS and clinical findings. Combined assessment of both parameters significantly enhanced diagnostic performance (AUC 0.975, specificity 89.1%), supporting the clinical utility of dual evaluation.
Biomechanical interpretation
From a biomechanical perspective, increased posterior tibial slope enhances anterior tibial shear force, increasing stress on the anterior cruciate ligament and elevating contact pressures on the posterior tibial plateau. 8 This altered load distribution accelerates degenerative cartilage changes through chronic overload of specific compartments. Similarly, increased MDA modifies the mechanical axis, shifting weight-bearing forces and contributing to asymmetric cartilage wear.10,11 The current findings align with this mechanistic pathway, emphasizing that both PTS and MDA serve as structural biomarkers reflecting biomechanical predisposition to joint degeneration.
These observations hold important clinical implications for diagnostic radiology, preventive orthopedics, and arthroplasty planning. Routine measurement of PTS and MDA during knee radiography can assist in detecting subclinical deformities and identifying high-risk individuals who may benefit from preventive interventions such as weight management, physiotherapy, and activity modification. In patients undergoing total knee replacement, maintaining population-appropriate PTS is vital for optimizing knee kinematics, preventing instability, and ensuring implant longevity.6,7
Limitations
Several limitations warrant acknowledgment. First, the cross-sectional design precludes causal inference and limits understanding of temporal relationships between angular parameters and OA development. Longitudinal studies are needed to determine whether increased PTS and MDA precede OA onset or represent secondary adaptive changes. Second, the hospital-based sampling may introduce selection bias, limiting generalizability to the broader South Indian population. Third, despite standardized protocols, potential variability in radiographic angle estimation exists due to patient positioning, radiographic technique, and observer interpretation. Fourth, the study did not assess medial versus lateral compartment-specific measurements, which may have different clinical significance. Fifth, functional outcomes and quality of life measures were not evaluated, limiting understanding of clinical impact. Finally, genetic, molecular, and biochemical factors contributing to these angular deviations were not explored.
Conclusion
This study demonstrates that posterior tibial slope and metaphysio-diaphyseal angle are significantly elevated in osteoarthritic knees among South Indian adults, with a moderate positive correlation between these parameters. The progressive increase in PTS with advancing OA severity according to Ahlbäck classification indicates that these angular parameters reflect not only predisposition to OA development but also disease progression. Routine measurement of PTS and MDA in standard knee radiographs could facilitate early OA detection, enable risk stratification, and inform both preventive strategies and surgical planning in total knee arthroplasty.
Future research should focus on prospective longitudinal cohort studies to establish temporal relationships and predictive thresholds for OA onset, multicentric studies across diverse Indian populations to validate these findings and establish region-specific normative values, assessment of medial versus lateral compartment-specific measurements, evaluation of genetic and molecular factors associated with these angular deviations, and investigation of interventions to modify biomechanical risk factors in high-risk individuals.
Footnotes
Acknowledgments
The authors acknowledge the Department of Radiology, Chettinad Hospital & Research Institute, for their assistance in radiographic image acquisition and interpretation.
Ethics Considerations
This study was approved by the Institutional Ethics Committee of Chettinad Hospital & Research Institute.
Consent to participate
Written informed consent was obtained from all participants prior to enrollment.
Funding
The authors received no financial support for the research, authorship, and/or publication of this article.
Declaration of conflicting interests
The authors declared no potential conflicts of interest with respect to the research, authorship, and/or publication of this article.
Data Availability Statement
The datasets used and analyzed during the current study are available from the corresponding author on reasonable request.