
Abstract
This study aimed to investigate whether changes in progastrin-releasing peptide (ProGRP) levels correlate with treatment response and can be used to optimize clinical management of patients with small-cell lung cancer. Patients with small-cell lung cancer (any stage) receiving chemotherapy were eligible. ProGRP was measured in serum/plasma at baseline and after each chemotherapy cycle using the Elecsys® ProGRP assay (Roche Diagnostics). Treatment response was assessed by computed tomography scan. The primary objective was to examine whether changes in ProGRP levels correlated with computed tomography scan results after two cycles of chemotherapy. The prognostic value of ProGRP among patients receiving first-line chemotherapy was also assessed. Overall, 261 patients from six centers were eligible. Among patients with elevated baseline ProGRP (>100 pg/mL), a ProGRP decline after Cycle 2 was associated with nonprogression (area under the curve: 84%; 95% confidence interval: 72.8–95.1; n = 141). ProGRP changes from baseline to end of Cycle 1 were predictive of response, as determined by computed tomography scan 3 weeks later (area under the curve: 87%; 95% confidence interval: 74.1−99.2; n = 137). This was enhanced by repeat measurements, with a 92% area under the curve (95% confidence interval: 85.3−97.8) among patients with ProGRP data after both Cycles 1 and 2 (n = 123); if a patient experienced a ≥25% decline in ProGRP after Cycle 1, and ProGRP remained stable or decreased after Cycle 2, the probability of finding progression on the interim computed tomography scan at the end of Cycle 2 was almost zero (sensitivity: 100%, specificity: 71%). Both ProGRP levels at baseline and at the end of first-line chemotherapy were prognostic; the latter provided a moderately improved hazard ratio of 2.43 (95% confidence interval: 1.33–4.46; n = 110) versus 1.87 (95% confidence interval: 1.04–3.37; n = 216). In summary, for patients with small-cell lung cancer and elevated baseline ProGRP levels, ProGRP may be a simple, reliable, and repeatable tool for monitoring response to chemotherapy and provide valuable prognostic information.
Introduction
Lung cancer is the foremost cause of cancer death, with small-cell lung cancer (SCLC) accounting for approximately 10%–15% of cases.1,2 SCLC is an aggressive malignancy strongly associated with smoking, often displaying a short doubling time and early metastases development.3,4 Most SCLC cases are diagnosed at advanced stage, where treatment guidelines recommend 4–6 cycles of platinum-based chemotherapy.2,5 Although highly responsive to initial treatment, most patients relapse within 6 months 4 and 5 year survival rates have plateaued in recent years. 6
Current SCLC clinical practice includes monitoring patient response to chemotherapy with imaging, usually by computed tomography (CT) scans; aiming to detect disease progression and resistance to chemotherapy early, thus reducing prolonged exposure to an ineffective and potentially toxic regimen. 7 However, CT scans are associated with high costs and patient inconvenience, and a simpler but effective tool for interim patient response monitoring is needed.8,9 Blood-based biomarkers monitoring is already used for this purpose in other solid tumors (e.g. carcinoembryonic antigen in colorectal cancer and prostate-specific antigen in prostate carcinoma).10,11
Progastrin-releasing peptide (ProGRP) levels are elevated in most patients with SCLC and can aid diagnosis of suspicious lung nodules, which is vital for determining optimal work-up and subsequent required treatment.12–15 The upper normal limit of circulating ProGRP in healthy adults is 60 pg/mL; 12 levels > 150 pg/mL are indicative of SCLC with 93.7% probability. 13
Reports on the use of ProGRP levels for monitoring treatment response and as a prognostic marker in SCLC are limited and conflicting—some studies have shown it to be effective for both purposes, while others report negative results.16–20 The key objective of this study was to determine whether ProGRP levels in patients with SCLC monitored during chemotherapy correlate with CT scan-based tumor response. We also evaluated the prognostic potential of ProGRP.
Materials and methods
Study design
Patients with SCLC at six centers in Europe and China received either platinum-based doublet chemotherapy for first-line treatment, or the appropriate single-agent cytotoxic for any subsequent line, as directed by their physician.
Serum or plasma (ethylenediaminetetraacetic acid) samples for ProGRP measurement were collected prospectively from patients at five centers, at baseline and directly before each chemotherapy cycle. Samples from a comparable study 20 were also retrospectively included to increase total sample size. All centers followed the same pre-analytical handling procedures (which were specified in the study protocol). In addition, storage of prospectively collected patient samples (at −70°C) was consistent across all sites. Good stability of ProGRP in both serum and plasma at a variety of storage conditions has previously been demonstrated. 12
This study was conducted in accordance with the principles of the Declaration of Helsinki and Good Clinical Practice. All patients provided written informed consent prior to the use of their blood samples for research purposes. The study was approved by relevant Ethics Committees/institutional Review Boards (see Supplementary Material).
Objectives
The primary objective was to examine whether changes in ProGRP levels between baseline and after two chemotherapy cycles correlated with CT scan results after the second cycle; which would suggest that changes in ProGRP level may be useful for monitoring treatment response in patients receiving chemotherapy for SCLC.
Following the primary results analysis, two further objectives were included to evaluate the potential predictive value of ProGRP. First, as the majority of patients also provided ProGRP data after chemotherapy Cycle 1, we assessed whether changes in serum ProGRP levels between baseline and Cycle 1 could be used as an early indicator of progression after one cycle and therefore predict the likelihood of disease progression after two cycles. We also investigated whether changes in serum ProGRP levels between baseline, Cycle 1, and Cycle 2 could predict the likelihood of disease progression in these patients.
Among patients treated with first-line chemotherapy, the prognostic value of ProGRP levels was also evaluated based on measurements taken at baseline and end of first-line therapy.
Patients
Key inclusion criteria: aged ≥18 years; SCLC diagnosis (any stage; including the presence of brain metastases); and patient fit enough to receive chemotherapy. Key exclusion criteria: the presence of a secondary tumor in the lung due to metastatic spread from a primary tumor in another organ; glomerular filtration rate <30. Full inclusion/exclusion criteria are detailed in the Supplementary Material.
All patients were required to provide a baseline serum or plasma sample for ProGRP analysis. Those included in treatment monitoring analyses were also required to provide ≥1 additional sample, either after Cycle 1 or 2 (or both); a CT scan after Cycle 2 was also required. Only patients with elevated baseline ProGRP (>100 pg/mL) were included in the analyses, since any clinically relevant ProGRP decline in response to treatment would be difficult to detect in patients without elevated baseline ProGRP. A 100 pg/mL cut-off was chosen based on our data, which showed that 99% of healthy volunteers had ProGRP levels ≤100 pg/mL (not shown).
Only patients receiving first-line chemotherapy were included in the prognostic analyses. In addition to their baseline sample, these patients were also required to provide an additional sample for ProGRP analysis taken at the end of first-line therapy, the last visiting date, or date of death.
Blood draws for ProGRP analysis were performed prior to general anesthesia, contrast agent, or chemotherapy administration.
Assessments
ProGRP levels in serum or plasma were measured using the Elecsys® ProGRP assay (Roche Diagnostics). Previous studies have shown good correlation between the results from samples in serum and plasma on the Elecsys ProGRP assay. 12 Whole body CT scans were conducted at baseline, after Cycle 2, and end of therapy. Scan results were read and interpreted according to local guidelines at each institution. Nonprogressors were defined as patients with complete response (CR), partial response (PR), or stable disease (SD), all of which denote clinical benefit from continued chemotherapy treatment according to Response Evaluation Criteria in Solid Tumors (RECIST v1.1) 21 or World Health Organization (WHO) criteria. 22 Patients with SD were included in the nonprogressors cohort since, in clinical practice, these patients would continue treatment in the same manner as those achieving CR or PR. Progressors were defined as patients with progressive disease based on RECIST v1.1 or WHO criteria.21,22 SCLC was staged according to the International Union Against Cancer tumor node metastasis classification of malignant tumors. 23
Statistical analyses
Statistical analyses, including details of ProGRP levels/CT correlation and ProGRP prognostic analyses, are described in the Supplementary Material.
Results
Baseline characteristics
Baseline ProGRP data were obtained for 312 patients, 189 of whom had post-Cycle 2 CT scan and underwent ProGRP testing after Cycle 1 and/or Cycle 2 and were eligible for inclusion in ≥1 monitoring analysis (Figure 1). In total, 172 patients underwent ProGRP testing after Cycle 2; 141 of whom had elevated baseline ProGRP (> 100 pg/mL) and were included in the primary analysis. The potential predictive value of ProGRP was assessed in the subgroup of patients who underwent ProGRP testing after Cycle 1 and had elevated baseline ProGRP (n = 137), and in those who underwent ProGRP testing after Cycles 1 and 2 and had elevated baseline ProGRP (n = 123). ProGRP prognostic value was assessed in the subgroup who received chemotherapy as first-line therapy, in patients with a baseline ProGRP value (n = 216) and in those who also had a ProGRP value at the end of first-line chemotherapy (n = 110).

Flowchart of patients included in ProGRP monitoring and/or prognosis analyses.
There were no notable differences in baseline characteristics between analysis populations (Table 1). Among all eligible patients (n = 261), median age was 63 years; 63% were male, 77% were current/former smokers, and 81% had advanced Stage IIIB/IV SCLC at diagnosis. In the overall population, 83% were receiving first-line chemotherapy, and 78% received a standard platinum-doublet regimen (Supplementary Table 1).
Patient demographics and baseline characteristics for all eligible patients (n = 261), monitoring analysis population (n = 189), and prognostic analysis population (n = 216).

ProGRP: progastrin-releasing peptide; UICC: Union for International Cancer Control.
At the time of diagnosis.
In the monitoring analysis population (n = 189), 156 (83%) patients had elevated baseline ProGRP and 24 (13%) patients had documented disease progression based on CT scan after Cycle 2.
ProGRP in treatment monitoring
Correlation of change in ProGRP levels after Cycle 2 with imaging results
Of 189 patients in the monitoring analysis population, 172 provided ProGRP data after Cycle 2. Of these patients, 141 had elevated baseline ProGRP (Figure 1) and a ProGRP decline after two cycles that was associated with nonprogression (area under the curve [AUC]: 84%; 95% confidence interval (CI): 72.8–95.1; Figure 2).
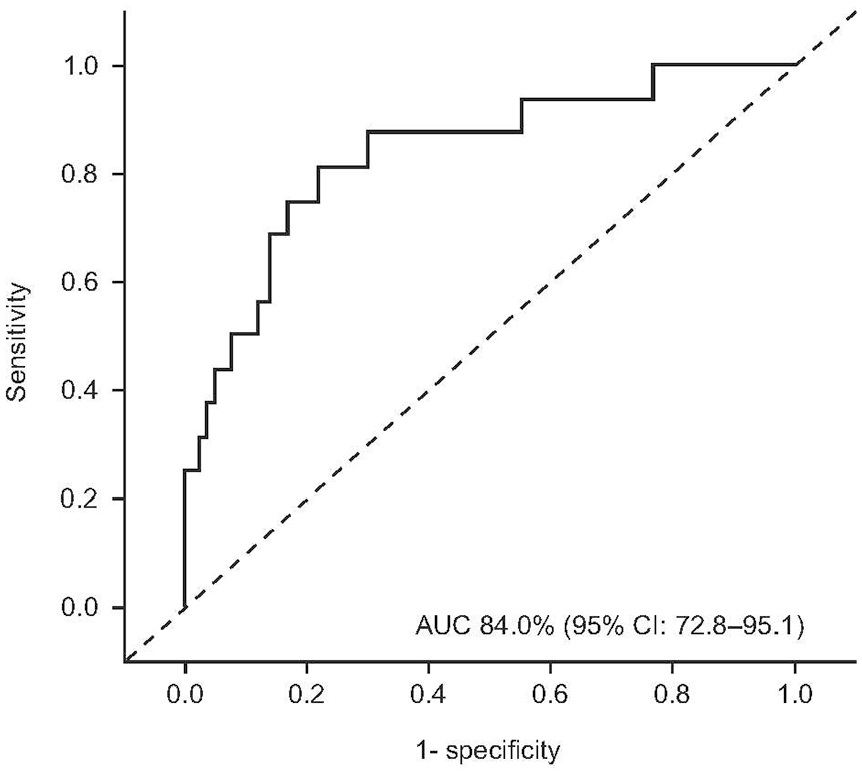
Correlation of ProGRP with imaging results. ROC analysis of ProGRP with CT scans after two chemotherapy cycles for detection of disease progression in patients with SCLC. Only patients with end of Cycle 2 data (ProGRP and CT scan) and baseline ProGRP > 100 pg/mL were included (n = 141; progressors n = 16, nonprogressors n = 125).
Supplementary Table 2 summarizes the sensitivity and specificity of different ProGRP reductions for detecting progression after two chemotherapy cycles. A ≥60% decline in ProGRP after two cycles had 88% sensitivity (95% CI: 61.7−98.4) and 64% specificity (95% CI: 54.9−72.4) in ruling out progression; 64% of nonprogressors had a ≥60% decline in ProGRP. The negative predictive value was 97.6%; the probability that a patient with ≥60% decline was a progressor was 2.4%.
These results strongly suggest that for patients with elevated baseline ProGRP, changes in ProGRP after chemotherapy Cycle 2 correlated with CT scan results and could be used to predict nonprogression.
Potential predictive value of ProGRP after Cycle 1
Of 189 patients in the monitoring analysis population, 162 provided ProGRP data after Cycle 1. Of these patients, 137 had elevated baseline ProGRP (Figure 1) and ProGRP changes from baseline to end of Cycle 1 that were predictive of response (progression vs nonprogression) as determined by imaging at the end of Cycle 2 (AUC 87%; 95% CI: 74.1−99.2; Figure 3(a)).
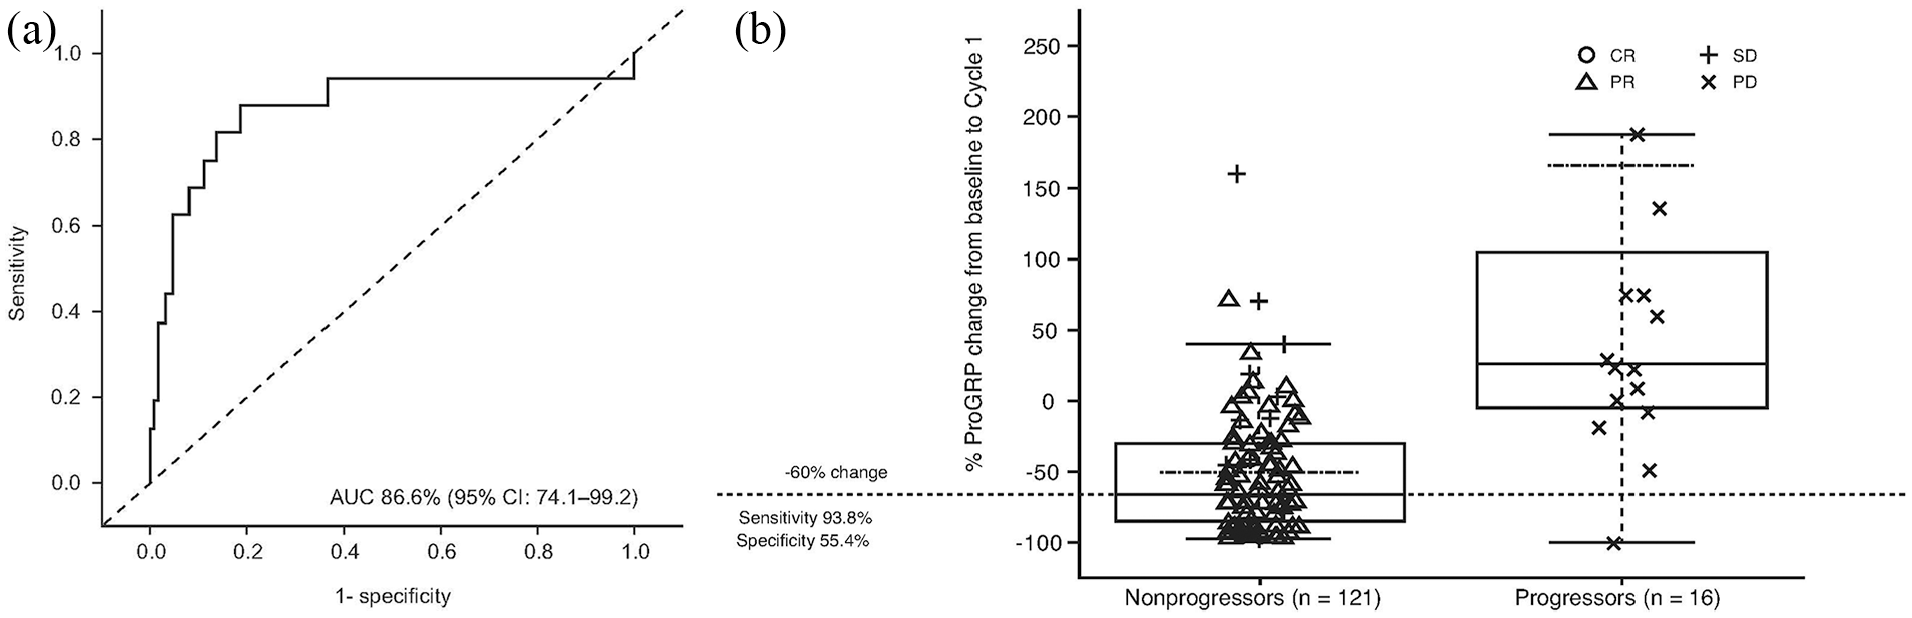
Potential predictive value of ProGRP after chemotherapy Cycle 1 in patients with SCLC: (a) ROC analysis of ProGRP changes after chemotherapy Cycle 1 with CT scans after chemotherapy Cycle 2 to predict disease progression, and (b) the percentage change in ProGRP from baseline to end of Cycle 1 in patients with progression versus without progression. Only patients with end of Cycle 1 ProGRP data, end of Cycle 2 CT scan, and baseline ProGRP levels > 100 pg/mL were included (n = 137; progressors n = 16, nonprogressors n = 121). Figure (b) shows the change in ProGRP from −100% to 250% only and therefore does not show all patients. The dashed-and-dotted line represents the mean ProGRP change from baseline to Cycle 1.
A relative ProGRP decline by ≥60% from baseline after Cycle 1 ruled out 94% of patients with progression (Figure 3(b)), while 55% of nonprogressors had a greater decline. A ≥60% decline in ProGRP levels after Cycle 1 had 94% sensitivity (95% CI: 69.8−99.8) and 55% specificity (95% CI: 46.1−64.4) in ruling out progression. Thus, in patients with a steep ProGRP decline after Cycle 1, an interim CT scan after Cycle 2 could potentially be omitted.
Potential predictive value of ProGRP after both Cycles 1 and 2
Of 189 patients included in the monitoring analysis population, 146 provided ProGRP data after both Cycle 1 and Cycle 2, 123 of whom had elevated ProGRP levels at baseline (Figure 1). Data from these 123 patients showed that the ability of ProGRP to predict nonprogression during treatment was enhanced by repeat measurements after each of the first two cycles. AUC increased from 87% (95% CI: 74.1−99.2) with one measurement to 92% (95% CI: 85.3−97.8) with two measurements (Figure 4(a)).

Potential predictive value of ProGRP after Cycles 1 and 2 in patients with SCLC: (a) ROC analysis of ProGRP changes after chemotherapy Cycle 1 and 2 with CT scans after chemotherapy Cycle 2 to predict disease progression, and (b) relative ProGRP changes from baseline to Cycle 1 versus from Cycle 1 to Cycle 2 (patients in the left lower quadrant had two consecutive decreases in ProGRP levels). Only patients with end of Cycle 1 and Cycle 2 ProGRP data, end of Cycle 2 CT scan, and baseline ProGRP levels >100 pg/mL were included (n = 123; progressors n = 15, nonprogressors n = 108). In Figure (b), the plot is magnified for clarity so does not show patients with very high positive changes. Circles (PR) and crosses (SD) represent nonprogressors, and triangles denote progressors (PD).
Thus, if a patient experienced a ≥25% relative decline in ProGRP levels after the first chemotherapy cycle, and ProGRP levels remained stable or decreased further after the second chemotherapy cycle, the probability of finding progression on the interim CT scan at the end of Cycle 2 was near-zero (100% sensitivity, 71% specificity; Figure 4(b)).
Value of ProGRP in treatment monitoring according to baseline values
Receiver operating characteristic (ROC) curve analyses were performed to demonstrate the correlation between ProGRP levels and CT scan results after Cycle 2, as well as the predictive value of ProGRP after Cycle 1 and after Cycles 1 and 2, in patients with a baseline ProGRP of >100 versus ≤100 pg/mL (Supplementary Table 3). Consistently lower AUC values reported among patients with baseline ProGRP ≤ 100 pg/mL support our suggestion that ProGRP may be a more useful and reliable therapeutic tool for treatment monitoring among patients with elevated ProGRP at baseline.
Prognostic value of ProGRP
All 216 patients who received first-line chemotherapy provided ProGRP data at baseline, with 110 patients also providing ProGRP data at the end of first-line therapy (Figure 1).
Median ProGRP at baseline was 888.25 pg/mL. Overall survival (OS) was poorer in patients whose baseline ProGRP level was above versus below the median (hazard ratio (HR) = 1.87; 95% CI: 1.04–3.37; p = 0.037; Figure 5(a)).

Prognostic value of ProGRP levels measured (a) at baseline (n = 216) and (b) at the end of first-line chemotherapy (n = 110). Figure 5(a) shows survival time from baseline and Figure 5(b) shows survival time from end of first-line chemotherapy, for patients with high (above the median) versus low (below the median) ProGRP levels.
Median ProGRP at end of first-line chemotherapy was 87.24 pg/mL. OS was poorer in patients whose ProGRP level at the end of first-line chemotherapy was above versus below the median, irrespective of the reason for terminating chemotherapy (HR = 2.43; 95% CI: 1.33–4.46; p = 0.004; Figure 5(b)).
Discussion
Studies assessing the usefulness of ProGRP in monitoring patients with SCLC receiving chemotherapy are limited. To our knowledge, this is the largest study to date evaluating the clinical utility of this biomarker as a monitoring tool in SCLC. The observed correlations between ProGRP levels and interim imaging results establish this biomarker as a useful therapy monitoring tool in patients with elevated ProGRP levels at baseline, for whom a decline in ProGRP during treatment was associated with documented nonprogression by CT scan.
In additional analyses, a ≥60% decrease in ProGRP after one cycle was predictive of nonprogression at an early treatment stage, prior to the first CT scan. Thus, patients with a steep ProGRP decline after one cycle of chemotherapy may be considered to be responding to treatment, and additional scans to verify response between courses of chemotherapy may be unnecessary. Importantly, this ProGRP result is available 3−4 weeks before the interim monitoring CT scan (end of Cycle 2), making ProGRP an early indicator for response to therapy.
These results were further enhanced by monitoring ProGRP across the first two cycles. If the first ProGRP decline was ≥25% and ProGRP levels between Cycles 1 and 2 were stable or decreased further, then it was highly likely that the patient’s disease would not progress by the end of Cycle 2; therefore, a CT scan at the end of Cycle 2 could be omitted.
Based on these results, we present clinicians with two approaches for ruling out disease progression using ProGRP monitoring in routine clinical practice: (1) using a cut-off approach after Cycle 1; (2) according to sequential changes in ProGRP after Cycles 1 and 2. Using a 60% cut-off in the first approach, our data indicate that 88% of progressors would be detected and ≥64% spared from CT scans. Clinicians could use Supplementary Table 2 to identify an appropriate cut-off value. The utility of the second approach is illustrated in Supplementary Figure 1, and provides a flowchart to aid clinical decision-making when incorporating ProGRP into treatment monitoring for patients with SCLC.
In clinical practice, patients with SCLC usually receive 4−6 chemotherapy cycles, with CT scans performed at baseline, end of Cycle 2 (interim scan), and end of treatment. Our results suggest that by the time of the interim scan, changes in ProGRP levels alone may assist in ruling out progression in some patients using either approach described. However, the percentage reductions and cut-offs used in this study were based on our patient cohort and require further validation in an external cohort. Nonetheless, compared with previously described formulas to determine response, our methods could provide a simple and straightforward approach.24,25
In assessing ProGRP as a prognostic marker, we found that higher baseline ProGRP levels (≥888.25 pg/mL) were associated with shorter OS than lower levels. Moreover, ProGRP levels measured at the end of first-line chemotherapy appeared to provide more important prognostic information than pre-treatment ProGRP levels. Higher ProGRP levels after first-line chemotherapy (≥87.24 pg/mL) were associated with poorer OS, although absolute levels were markedly lower than those at baseline due to chemotherapy effects.
Previous studies investigating the prognostic value of ProGRP in SCLC have reported conflicting results.16–19 Nisman et al. 17 noted shorter median survival in patients with ProGRP levels >800 pg/mL versus ≤800 pg/mL; a baseline cut-off comparable to the 888.25 pg/mL baseline cut-off used in our study. Shibayama et al. 16 found that patients with elevated baseline ProGRP levels (>49 pg/mL) had significantly shorter survival than those without. However, both Niho et al. 18 and Pujol et al. 19 found no statistical difference in median survival among patients with elevated versus non-elevated ProGRP levels; possibly related to the cut-off levels used.
Our rationale of including only patients with >100 pg/mL baseline ProGRP in the monitoring analyses was to exclude patients with normal ProGRP levels at diagnosis. Our data demonstrate that, among patients with ≤100 pg/mL baseline ProGRP, any ProGRP change during treatment cannot be reliably interpreted, as shown by the consistently lower AUC reported in these patients for the monitoring analyses performed.
A more recent study by Nisman et al. 26 using plasma ProGRP for diagnosing and monitoring SCLC supports our findings that patients with elevated ProGRP are the most suitable for ProGRP monitoring during therapy and provides further support for ProGRP as a diagnostic marker in SCLC. However, Nisman et al. used ROC analyses to evaluate ProGRP as a method of predicting patient response to treatment after completion of chemotherapy, whereas we showed the value of ProGRP to determine OS at the start of chemotherapy in order to highlight its use as a prognostic marker. In addition, we showed ProGRP levels as predictive of response to treatment.
The main limitation of our study was the post hoc nature of our analyses. Also, our results are only valid for patients with elevated baseline ProGRP levels. However, we included OS as an objective endpoint in our study, as this is considered the gold standard for assessing patient outcomes.
In our study, most progressors had received second-line treatment; only four patients experienced progression during first-line chemotherapy. This is consistent with reported clinical characteristics of SCLC behavior and indicates that our patient population was reflective of the general SCLC population. The relatively low total number of progressors included in our study resulted in a wide range of the 95% CI for the ROC curve. Hence, further exploration of ProGRP by line of chemotherapy received is warranted.
Although the median ProGRP level used in our prognosis analyses may not be the optimal cut-off to separate high- and low-risk patients, it provides an unbiased estimation of prognostic performance, as data-driven cut-offs may lead to over-optimistic results and reduce reproducibility.27,28 While several methods are available to model time-dependent prognostic factors that may change during disease progression and treatment (e.g. tumor marker levels), evaluating ProGRP levels at fixed and pre-defined time points provides a straightforward approach with easily interpreted results, highlighting the applicability of ProGRP testing in routine clinical practice.
Research into SCLC treatment response prediction is moving away from druggable driver mutations and toward biomarkers based on gene/protein expression. 29 Our findings demonstrate the potential utility of ProGRP in the early identification of treatment response after one or two chemotherapy cycles. ProGRP may provide a simple, inexpensive tool to assess treatment response and disease progression in patients with SCLC. ProGRP monitoring could be performed locally and avoid the inconvenience and costs associated with repeat interim scans during therapy. An interesting avenue to explore in future studies would be how ProGRP after the first and second cycles in progressors and nonprogressors is related to survival.
Conclusion
Our results suggest that ProGRP is a simple and reliable tool for monitoring response to chemotherapy in patients with SCLC and elevated baseline ProGRP levels. Kinetic ProGRP evaluation using only two measurements may provide an efficient and cost-effective management strategy. Furthermore, progressive disease could potentially be ruled out after one therapeutic cycle with high sensitivity, and ProGRP could provide valuable prognostic information. Given the potential clinical utility of our findings, further prospective validation of ProGRP is warranted.
Supplemental Material
Muley_et_al._ProGRPManuscript_DV-DIA73283_SupplementaryFile_final_06Aug20 – Supplemental material for A continuous responder algorithm to optimize clinical management of small-cell lung cancer with progastrin-releasing peptide as a simple blood test
Supplemental material, Muley_et_al._ProGRPManuscript_DV-DIA73283_SupplementaryFile_final_06Aug20 for A continuous responder algorithm to optimize clinical management of small-cell lung cancer with progastrin-releasing peptide as a simple blood test by Thomas Muley, Xiaotong Zhang, Stefan Holdenrieder, Catharina M Korse, Xiu-yi Zhi, Rafael Molina, Zhongjuan Liu, Gunther Hartmann, Michel M van den Heuvel, Kun Qian, Ramon Marrades, Christine Engel, Ying He, Birgit Wehnl, Farshid Dayyani and Felix Herth in Tumor Biology
Footnotes
Acknowledgements
The authors would like to thank all patients involved in the study and Vinzent Rolny, Roche Diagnostics GmbH, Germany, for providing support with statistical analyses and interpretation and for reviewing the draft manuscript. In Heidelberg, blood samples were provided by Lung BioBank Heidelberg, a member of the Biomaterial Bank Heidelberg (BMBH) and the biobank platform of the German Center for Lung Research (DZL). Medical writing/editorial support was provided by Kim Brown of Roche Diagnostics International Ltd, Switzerland, Sian-Marie Lucas and Angela Corstorphine of Kstorfin Medical Communications Ltd, United Kingdom, and James Everington of Gardiner-Caldwell Communications, Macclesfield, United Kingdom, and was funded by Roche Diagnostics International Ltd (Rotkreuz, Switzerland). ELECSYS is a trademark of Roche.
Author contributions
TM, XZ, SH, CMK, RMo, MMvdH, BW, and FH contributed to the study conception or design, data acquisition, data analysis and/or interpretation, manuscript writing and/or critical review, and approval of final manuscript. XyZ, ZL, GH, KQ, and RMa contributed to the data acquisition, data analysis and/or interpretation, manuscript writing and/or critical review, and approval of final manuscript. YH and FD contributed to the study conception or design, data analysis and/or interpretation, manuscript writing and/or critical review, and approval of final manuscript. CE contributed to the data analysis and/or interpretation, manuscript writing and/or critical review, and approval of final manuscript.
Declaration of conflicting interests
The author(s) declared the following potential conflicts of interest with respect to the research, authorship, and/or publication of this article: T.M. has received research grants, personal fees, and travel grants from Roche Diagnostics. F.H. has received grants/research support from Roche Diagnostics and personal fees for advisory boards and lectures from Pulmonx, BTG, Uptake Medical, Olympus Medical, and Holaira. S.H. has received research grants from Roche Diagnostics, DiaSorin, Sysmex Diagnostics, and Volition SPRL and personal fees from Volition SPRL. X.Z. has received grants/research support from Roche Diagnostics. C.E., Y.H., and B.W. are employees of Roche Diagnostics. At the time of data collection, F.D. was an employee of Roche Diagnostics and has served on advisory boards for Eisai, Genentech, Array, Exelixis, and Foundation Medicine, has received institutional research support from Taiho, AZD, Merck, BMS, and Exelixis, and has served on Speaker’s Bureau for Amgen, Genentech, Sirtex, Ipsen, Eisai, and Exelixis. G.H., M.M.V.D.H., C.M.K., X.-Y.Z., R. Mo., Z.L., K.Q., and R.Ma. have no conflicts of interest to disclose.
Ethical approval
The following ethics committees and institutional review boards provided approval for this study: the Ethics Committee of Xuanwu Hospital of Capital Medical University; the Ethics Committee of Peking Union Medical College Hospital; the Protocol Review Committee of the Netherlands Cancer Institute Antoni van Leeuwenhoek (approval number: PTC12.1482); the Clinical Research Ethics Committee of Clinic Hospital of Barcelona (approval number: 2012/7743); the Ethics Commission of the Faculty of Medicine of the University of Heidelberg (approval number: 00008069); the Ethics Commission of the Faculty of Medicine of the University of Bonn (approval number: 332/11); and the Ethics Commission of the Faculty of Medicine of the University of Munich (approval number: 114-13).
Funding
The author(s) disclosed receipt of the following financial support for the research, authorship, and/or publication of this article: This study was sponsored by Roche Diagnostics.
Guarantor
Dr Xiaotong Zhang of this article.
Supplemental material
Supplemental material for this article is available online.
References
Supplementary Material
Please find the following supplemental material available below.
For Open Access articles published under a Creative Commons License, all supplemental material carries the same license as the article it is associated with.
For non-Open Access articles published, all supplemental material carries a non-exclusive license, and permission requests for re-use of supplemental material or any part of supplemental material shall be sent directly to the copyright owner as specified in the copyright notice associated with the article.